. 2021 Apr 6;12(1):2053.
doi: 10.1038/s41467-021-22352-4.

Single-cell transcriptome atlas and chromatin accessibility landscape reveal differentiation trajectories in the rice root

Affiliations

Single-cell transcriptome atlas and chromatin accessibility landscape reveal differentiation trajectories in the rice root

Tian-Qi Zhang et al. Nat Commun. .

Abstract

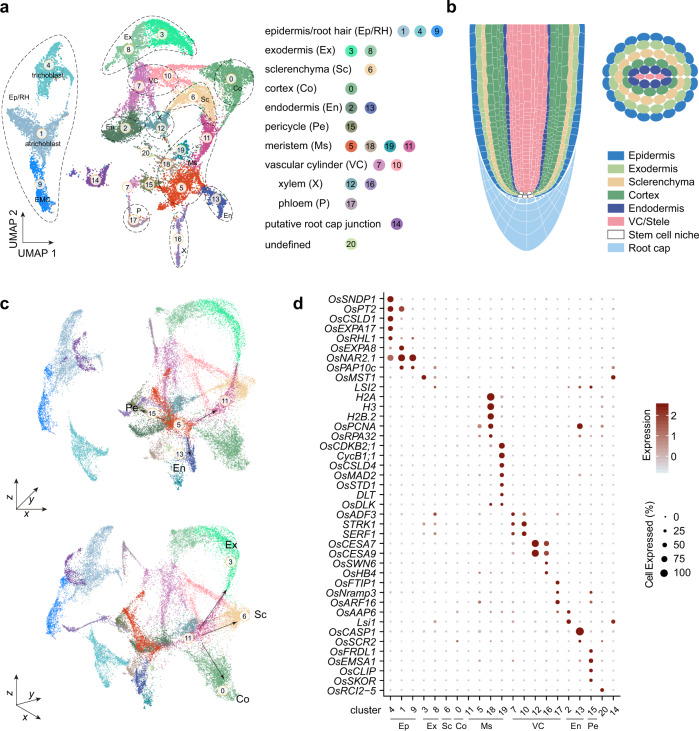
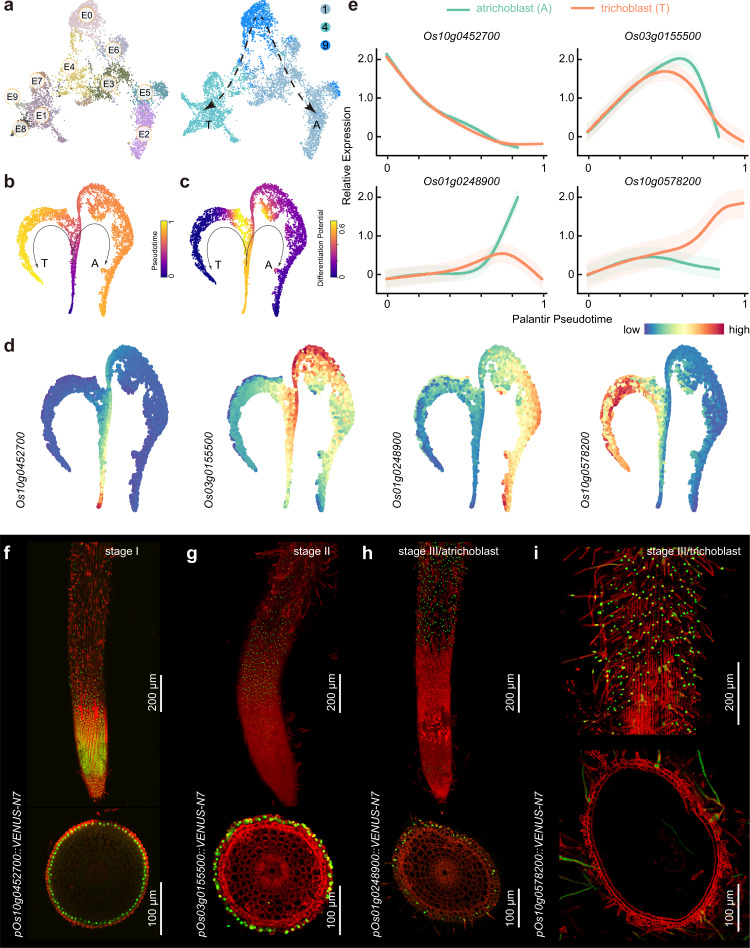
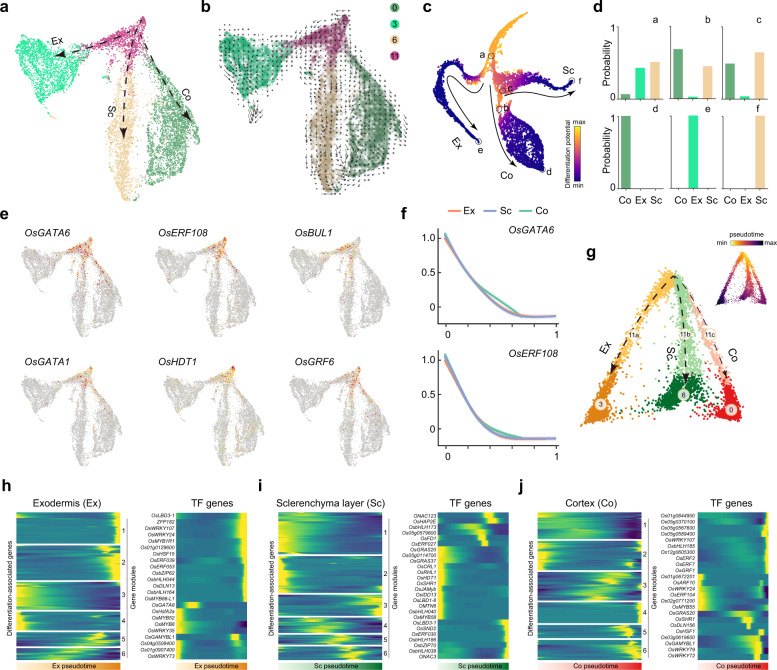
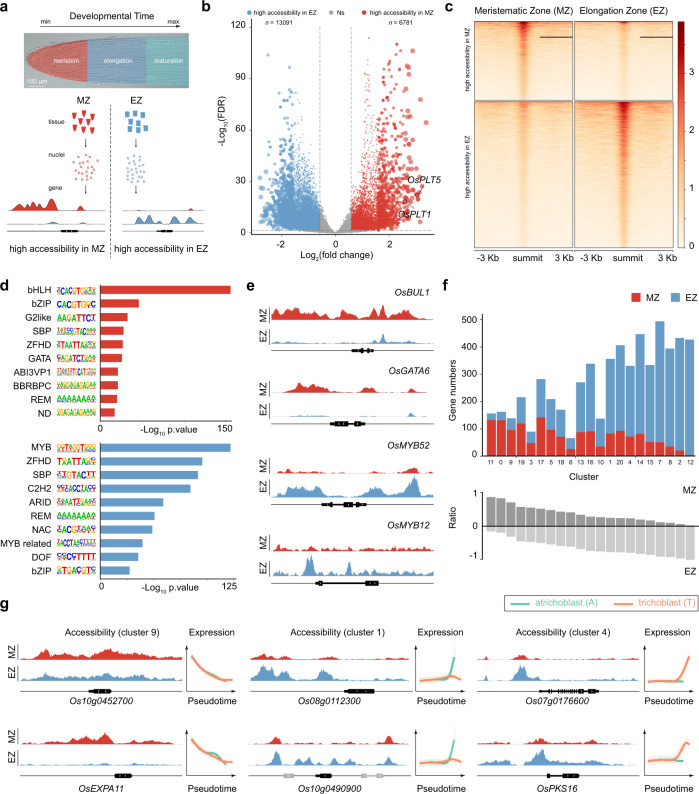
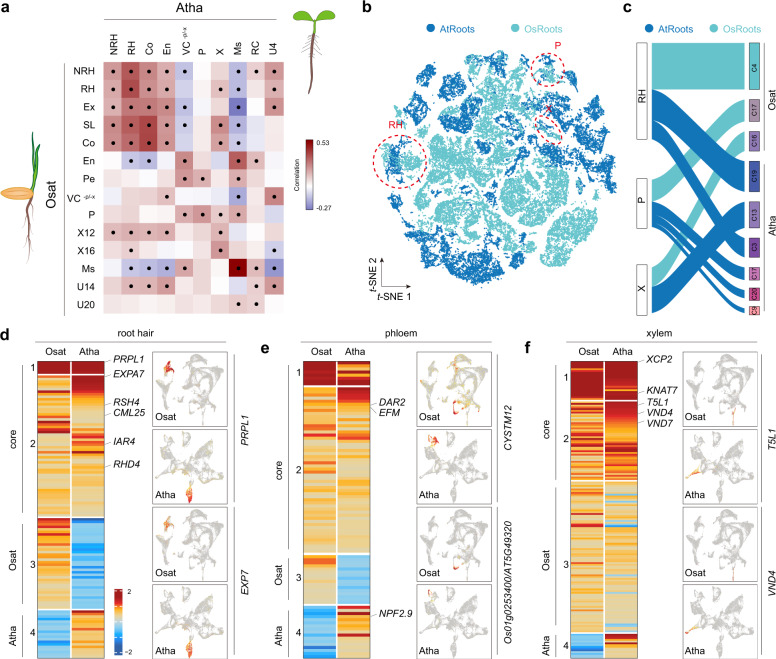
Root development relies on the establishment of meristematic tissues that give rise to distinct cell types that differentiate across defined temporal and spatial gradients. Dissection of the developmental trajectories and the transcriptional networks that underlie them could aid understanding of the function of the root apical meristem in both dicots and monocots. Here, we present a single-cell RNA (scRNA) sequencing and chromatin accessibility survey of rice radicles. By temporal profiling of individual root tip cells we reconstruct continuous developmental trajectories of epidermal cells and ground tissues, and elucidate regulatory networks underlying cell fate determination in these cell lineages. We further identify characteristic processes, transcriptome profiles, and marker genes for these cell types and reveal conserved and divergent root developmental pathways between dicots and monocots. Finally, we demonstrate the potential of the platform for functional genetic studies by using spatiotemporal modeling to identify a rice root meristematic mutant from a cell-specific gene cohort.


Conflict of interest statement

The authors declare no competing interests.

Figures

Fig. 1
Fig. 1. Generation of a rice radicle cell atlas.
a UMAP visualization of 21 cell clusters in rice radicles. Each dot denotes a single cell. Colors denote corresponding cell clusters. EMC, epidermal meristematic cell. b Schematic of anatomy of rice radicle. c Visualization of cell clusters by 3D UMAP scatterplots. Cluster names and colors are the same as in a. d Expression patterns of representative cluster-specific marker genes on UMAP. Dot diameter indicates the proportion of cluster cells expressing a given gene. The full names of selected genes are given in Supplementary Data 3.
Fig. 2
Fig. 2. Differentiation trajectories of epidermal cells.
a UMAP projections showing epidermal cell populations (clusters 1, 4, and 9). E0 to E9, sub-cell clusters. Lines indicate two potential differentiation trajectories toward trichoblasts (T) and atrichoblasts (A). b, c t-SNE map of epidermal cell populations. Cells colored by Palantir pseudotime (b) or differentiation potential (c). d t-SNE map showing the expression pattern of four marker genes. e Expression of marker genes along Palantir pseudotime. fi Expression of marker genes (green) in rice radicles. Three developmental stages (stage I to III) are shown. Six repeats each consisting of individual plants were performed for each gene. Red, FM4-64. Longitudinal (top) and transverse (bottom) sections are shown.
Fig. 3
Fig. 3. Differentiation trajectories of ground tissue.
a UMAP plot showing ground tissue cell populations. Ex, exodermis; Co, cortex; Sc, sclerenchyma layer. Cluster names (Clusters 0, 3, 6, and 11) and colors are the same as in Fig. 1a. b RNA velocity field projected onto the UMAP. Arrows represent average velocity and direction. Cluster names and colors are the same as in a. c, d t-SNE map of ground tissue cell populations. Cell colored by differentiation potential (c). Black lines mark three major differentiation trajectories toward Ex, Co, and Sc, respectively. a to f (black circles), six nodes used for quantification of branch probabilities (d). e, f Expression patterns of selected transcription factor genes on UMAP map (e) or along pseudotime (f). Expression of OsGATA6 and OsERF108 was greatly decreased along pseudotime during cell differentiation toward Ex, Co and Sc. g Pseudotime analysis of ground tissue differentiation trajectories by DPT. The cells in clusters 0, 3, 6 and 11 were grouped and re-clustered. Three differentiation trajectories are shown in different colors. Inset, pseudotime estimation. hj Heatmap showing gene expression pattern during differentiation of Ex (h), Sc (i), and Co (j) along pseudotime (left column). Expression pattern of selected transcription factor (TF) along each differentiation trajectory is given (right column).
Fig. 4
Fig. 4. Inference of transcriptional regulatory basis by ATAC-seq and scRNA-seq.
a Schematic of tissue sampling. MZ, meristematic zone; EZ, elongation zone. b Volcano plot showing differentially accessible peaks between the MZ and EZ samples. Blue and red, highly accessible peaks in the EZ and MZ samples, respectively; Gray, no difference between the MZ and EZ samples. The number of differential peaks in each sample is given. FDR < 0.05; log2(fold change) > 0.58 or <−0.58. c Pileup of ATAC-seq signals. Heat maps are ranked in decreasing order of ATAC-seq signal. Window size: peak summit ±3.0 kb. d Enrichment of transcription factor binding motifs within differential peaks in the MZ (red, top) and EZ (blue, bottom) samples. −Log10(p value) for each binding motif is given. e Representative ATAC-seq tracks for bHLH (OsBUL1), GATA (OsGATA6) and MYB (OsMYB12 and OsMYB52) transcription factor family genes. The genomic loci are shown, and the representative genes are highlighted in black. f Integrative analysis of scRNA-seq and ATAC-seq data. The genes associated with differential peaks identified in c were assigned to 21 cell clusters. The number of genes showing high accessibility in the MZ or EZ in each cell cluster is shown in different colors (top). The ratio (bottom) was calculated by the number of genes showing high accessibility in the MZ or EZ sample/total number of cluster-specific genes. g Representative ATAC-seq tracks for clusters 1, 4, 9 enriched genes. The genomic loci are shown, and the representative genes are highlighted in black. Two representative genes for each cluster are shown. Gene expression patterns during differentiation toward trichoblast (T) and atrichoblast (A) along the pseudotime are shown (right). Color annotation is the same in Fig. 2e.
Fig. 5
Fig. 5. Comparison of rice and Arabidopsis root tips at single-cell resolution.
a Pairwise correlations of Arabidopsis (top) and rice (left) root cell clusters. Dots indicate statistically significant correlations. Atha, A. thaliana; Osat, O. sativa; NRH, non-root hair cells; RH, root hair; Ex, exodermis; SL, sclerenchyma layer; Co, cortex; En, endodermis; Pe, pericycle; VC-P-X, vascular tissue without phloem and xylem; P, phloem; X, xylem; X12 and X16, xylem clusters 12 and 16; Ms, meristematic cells; RC, root cap; U4, U14, and U20, unknown cell clusters 4, 14, and 20. b t-SNE plot showing 30 super cell clusters of Arabidopsis and rice root cells. Dotted circles mark the common RH, P, and X clusters, respectively. c Sankey diagram showing that Arabidopsis shares a high degree of similarities in RH, P, and X cell clusters with rice. Cluster number for Arabidopsis (Supplementary Fig. S7a) and rice (Fig. 1a) root cells is given on the right. df Gene clustering of RH (d), P (e), and X (f) clusters. For each cell type, core and species-specific sub-gene clusters (labeled with Atha or Osat) were identified. The known genes expressed in root hair, phloem and xylem are indicated. The expression pattern of selected core genes for each cell type is plotted on UMAP (right). The full names of selected genes are given in Supplementary Data 3.

References

    1. Rebouillat J, et al. Molecular genetics of rice root development. Rice. 2009;2:15–34. doi: 10.1007/s12284-008-9016-5. - DOI
    1. Coudert Y, Perin C, Courtois B, Khong NG, Gantet P. Genetic control of root development in rice, the model cereal. Trends Plant Sci. 2010;15:219–226. doi: 10.1016/j.tplants.2010.01.008. - DOI - PubMed
    1. Aichinger E, Kornet N, Friedrich T, Laux T. Plant stem cell niches. Annu Rev. Plant Biol. 2012;63:615–636. doi: 10.1146/annurev-arplant-042811-105555. - DOI - PubMed
    1. Benfey PN. Defining the path from stem cells to differentiated tissue. Curr. Top. Dev. Biol. 2016;116:35–43. doi: 10.1016/bs.ctdb.2015.12.002. - DOI - PubMed
    1. Drapek C, Sparks EE, Benfey PN. Uncovering gene regulatory networks controlling plant cell differentiation. Trends Genet. 2017;33:529–539. doi: 10.1016/j.tig.2017.05.002. - DOI - PMC - PubMed

Publication types

LinkOut - more resources