. 2021 Oct;15(10):2830-2842.
doi: 10.1038/s41396-021-00965-3. Epub 2021 Apr 6.

Evolutionary stasis of a deep subsurface microbial lineage

Affiliations

Evolutionary stasis of a deep subsurface microbial lineage

Eric D Becraft et al. ISME J. 2021 Oct.

Abstract

Sulfate-reducing bacteria Candidatus Desulforudis audaxviator (CDA) were originally discovered in deep fracture fluids accessed via South African gold mines and have since been found in geographically widespread deep subsurface locations. In order to constrain models for subsurface microbial evolution, we compared CDA genomes from Africa, North America and Eurasia using single cell genomics. Unexpectedly, 126 partial single amplified genomes from the three continents, a complete genome from of an isolate from Eurasia, and metagenome-assembled genomes from Africa and Eurasia shared >99.2% average nucleotide identity, low frequency of SNP's, and near-perfectly conserved prophages and CRISPRs. Our analyses reject sample cross-contamination, recent natural dispersal, and unusually strong purifying selection as likely explanations for these unexpected results. We therefore conclude that the analyzed CDA populations underwent only minimal evolution since their physical separation, potentially as far back as the breakup of Pangea between 165 and 55 Ma ago. High-fidelity DNA replication and repair mechanisms are the most plausible explanation for the highly conserved genome of CDA. CDA presents a stark contrast to the current model organisms in microbial evolutionary studies, which often develop adaptive traits over far shorter periods of time.


Conflict of interest statement

The authors declare no competing interests.

Figures
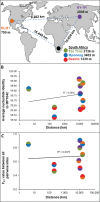
Fig. 1
Fig. 1. General characteristics of the analyzed Candidatus Desulforudis audaxviator populations.
A Global location, distance and depth below surface of environmental samples from which CDA SAGs were obtained. B Average nucleotide identity in relation to geographic distance. C FST in relation to geographic distance. The site-specific colors of the pairwise comparisons are shown for each data point. Standard deviations and standard errors are smaller than symbols (see Table S4).
Fig. 2
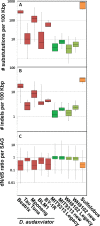
Fig. 2. Evolutionary analyses of Candidatus Desulforudis audaxviator (CDA) SAGs.
Genomic variability among Candidatus Desulforudis audaxviator SAGs (red); SAGs of cyanobacteria cultures MIT9313 and WH8102 (green); and Sulfolobus islandicus genomes (orange) [47]. Variability metrics include: (A) nucleotide substitutions; (B) indels; and (C) dN/dS ratio, with respect to the MP104C reference genome. CDA SAGs are separated by study site. Cyanobacteria values, which were used as methodological controls, were calculated using two references: legacy genome sequences [45, 46] and new co-assemblies of SAGs.
Fig. 3
Fig. 3. Examples of identical prophage and CRISPR sequences in SAGs from geographically distant locations (see Table S6 for a complete list).
A Alignments of SAG prophages sourced from multiple field sites. Viral sequence 1 was found in SAGs from BLM1 (North America) and BY-1R (Eurasia). Viral sequence 2 was found in SAGs from BLM1 (North America) and Tau Tona (Africa). Viral sequence 3 was found in SAGs from Beatrix (Africa) and Tau Tona. Dotted lines show regions with 100% nucleotide identity. Asterisk in BLM1 AH-151-E15 represents the one single nucleotide insert in the alignments. SAGs are color-coded by site; BY-1R, purple; BLM1, orange; Tau Tona, green; and Beatrix, red. B Prophage contigs from BLM1 (North America) and BY-1R (Eurasia) aligned to two different CRISPR spacer regions from Tau Tona (Africa).
Fig. 4
Fig. 4. Flow-cytometric characterization of microorganisms from BLM1.
A Oxidoreductase activity and (B) nucleic acid content analyzed by flow cytometry at BLM1 site in California. Identified cells are color-coded, with CDA colored red and enlarged for visual recognition. The Y-axis is fluorescence. The X-axis is estimated diameter of the sorted cells, derived from the forward light scatter.
Fig. 5
Fig. 5. Candidatus Desulforudis audaxviator DNA polymerase I model.
A Models of the large fragment of polymerase I of CDA (green), large Klenow fragment of E. coli DNA polymerase I (cyan) and Thermus aquaticus DNA polymerase I (purple). See Tables S10A–C for corresponding protein and domain IDs. B Enlarged view of the 3′-5′ exonuclease site and RNaseH-like catalytic residues. C Experimental evaluation of the fidelity of CDA DNA polymerase I, in comparison to Taq and Bst polymerases.

References

    1. Ochman H, Wilson AC. Evolution in bacteria: evidence for a universal substitution rate in cellular genomes. J Mol Evolution. 1987;26:74–86. doi: 10.1007/BF02111283. - DOI - PubMed
    1. Cooper VS, Lenski RE. The population genetics of ecological specialization in evolving Escherichia coli populations. Nature. 2000;407:736–9. doi: 10.1038/35037572. - DOI - PubMed
    1. Gibson B, Eyre-Walker A. Investigating evolutionary rate variation in bacteria. J Mol Evol. 2019;87:317–26. doi: 10.1007/s00239-019-09912-5. - DOI - PMC - PubMed
    1. Parks DH, Rinke C, Chuvochina M, Chaumeil P-A, Woodcroft BJ, Evans PN, et al. Recovery of nearly 8,000 metagenome-assembled genomes substantially expands the tree of life. Nat Microbiol. 2017;2:1533–42. doi: 10.1038/s41564-017-0012-7. - DOI - PubMed
    1. Hug LA, Baker BJ, Anantharaman K, Brown CT, Probst AJ, Castelle CJ, et al. A new view of the tree of life. Nat Microbiol. 2016;1:16048. doi: 10.1038/nmicrobiol.2016.48. - DOI - PubMed

Publication types