. 2021 Apr 23;6(4):1408-1417.
doi: 10.1021/acssensors.1c00312. Epub 2021 Apr 7.

Detecting COVID-19 from Breath: A Game Changer for a Big Challenge

Affiliations

Detecting COVID-19 from Breath: A Game Changer for a Big Challenge

Giorgia Giovannini et al. ACS Sens. .

Abstract

Coronavirus disease 2019 (COVID-19) is probably the most commonly heard word of the last 12 months. The outbreak of this virus (SARS-CoV-2) is strongly compromising worldwide healthcare systems, social behavior, and everyone's lives. The early diagnosis of COVID-19 and isolation of positive cases has proven to be fundamental in containing the spread of the infection. Even though the polymerase chain reaction (PCR) based methods remain the gold standard for SARS-CoV-2 detection, the urgent demand for rapid and wide-scale diagnosis precipitated the development of alternative diagnostic approaches. The millions of tests performed every day worldwide are still insufficient to achieve the desired goal, that of screening the population during daily life. Probably the most appealing approach to consistently monitor COVID-19 spread is the direct detection of SARS-CoV-2 from exhaled breath. For instance, the challenging incorporation of reliable, highly sensitive, and cost-efficient detection methods in masks could represent a breakthrough in the development of portable and noninvasive point-of-care diagnosis for COVID-19. In this perspective paper, we discuss the critical technical aspects related to the application of breath analysis in the diagnosis of viral infection. We believe that, if achieved, it could represent a game-changer in containing the pandemic spread.

Keywords: COVID-19; VOCs; breath; detection; diagnostics; sensor; virus; volatile organic compounds.


Conflict of interest statement

The authors declare no competing financial interest.

Figures

Figure 1
Figure 1
Transmission of COVID-19. Human atomization of viruses arises from coughing or sneezing of an infected person, producing virus-containing droplets (>5 μm) and aerosols (<5 μm). Virus transmission from person to person occurs through direct/indirect contact and airborne aerosol/droplet routes. Large droplets mainly settle out of the air to cause person/object contamination, whereas aerosols efficiently disperse in air. Direct and airborne transmissions occur in short-range and extended distance/time, respectively. Inhaled airborne viruses are deposited directly on to the human respiration tract. Figure adapted with permission from ref (6), 2020, editor of the National Academy of Sciences.
Figure 2
Figure 2
High-frequency testing with low analytic sensitivity versus low-frequency testing with high analytic sensitivity. A person’s infection trajectory (blue line) is shown in the context of two surveillance regimens (circles) with different analytic sensitivity. Higher frequency testing is more likely to test in the infectious window. Therefore, although both testing regimens detect the infection (orange circles), the high-frequency lateral flow test is more likely to detect it during the transmission window (shading), despite its lower analytic sensitivity. The figure is not an accurate representation of exactly when a positive test is likely to signify that a case is infectious. Adapted with permission from ref (1). BMJ Publishing Group.
Figure 3
Figure 3
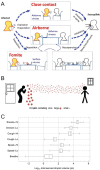
(A) Scheme of different possible transmission routes of SARS-CoV-2 through expiration (i.e., breathing, coughing, sneezing). Besides the close range and airborne transmission, virus-containing droplets can settle on surfaces (fomites, leading to self-inoculation). (Reproduced with permission from ref (78), Springer Nature). (B) Air diffusion of large and small virus-containing droplets. (Reproduced with permission from ref (57), Elsevier Ltd.) (C) Box-whisker chart of log10 of aerosol droplet volume (pL = picoliters). Box – median values; whisker – minimum and maximum values. The volume is considered as pL/20 min of breathing and speaking, and as pL per cough and sneeze (Reproduced with permission from ref (76)).
Figure 4
Figure 4
(a) Example of breath collection with the developed breathalyzer from a patient in Wuhan, China. (b) Representative response of a sensor to three different breath samples. The normalized response of the same in the breathalyzer to three different samples: patient A, COVID-19, first sample when infected; patient A, second sample after being determined as recovered; and healthy control. The x-axis represents the cycle measurement. (c–f) Diagnosis of COVID-19 patients based on breath sample response. Panels c, d, and e show data classification from sensor responses to breath samples as represented by the canonical variable of the discriminant analysis. Box plots of the first canonical score of the training set (70% of the samples) and test set (30% of the samples). The horizontal dashed line in the box plots represents the cutoff value of the model: true positive (TP), true negative (TN), false positive (FP), false negative (FN). (c) COVID-19 patients (n = 41) and healthy controls (n = 57). (d) COVID-19 patients (n = 41) and other lung infection/condition controls (n = 32). (e) COVID-19 patients at first (n = 41) and second sampling (n = 21). (f) ROC curves for the breath-sensor response in patients with COVID-19 (Co) infection compared with controls (C) (black); in COVID-19 infection compared with other lung infection/conditions (LI), (red); and in COVID-19 infection first sample (Co1) compared to COVID-19 infection second sample (Co2) (blue). p < 0.0001. (Reproduced with permission from ref (17) ACS Publications).
Figure 5
Figure 5
(a) COVID-19 ROS diagnosis (CRD) system consists of three needle electrodes coated with functionalized multiwall carbon nanotubes. (b) Selective electrochemical reactions of released ROS on MWCNTs produces cathodic ionic peaks. (c) ROS-related electrochemical cyclic voltammetry cathodic peaks from the fresh sputum of two different patients were involved in COVID-19 and hospitalized in comparison with a confirmed normal case. (Reproduced with permission from ref (92). Elsevier Ltd.).

References

    1. Crozier A.; Rajan S.; Buchan I.; McKee M. Put to the Test: Use of Rapid Testing Technologies for Covid-19. BMJ. 2021, n208.10.1136/bmj.n208. - DOI - PubMed
    1. Pokhrel P.; Hu C.; Mao H. Detecting the Coronavirus (CoVID-19). ACS Sensors 2020, 5 (8), 2283–2297. 10.1021/acssensors.0c01153. - DOI - PMC - PubMed
    1. Samson R.; Navale G. R.; Dharne M. S. Biosensors: Frontiers in Rapid Detection of COVID-19. 3 Biotech 2020, 10 (9), 1–9. 10.1007/s13205-020-02369-0. - DOI - PMC - PubMed
    1. Ribeiro B. V.; Cordeiro T. A. R.; Oliveira e Freitas G. R.; Ferreira L. F.; Franco D. L. Biosensors for the Detection of Respiratory Viruses: A Review. Talanta Open 2020, 2, 100007.10.1016/j.talo.2020.100007. - DOI - PMC - PubMed
    1. Morawska L.; Milton D. K. It Is Time to Address Airborne Transmission of Coronavirus Disease 2019 (COVID-19). Clin. Infect. Dis. 2020, 71 (9), 2311–2313. 10.1093/cid/ciaa939. - DOI - PMC - PubMed