

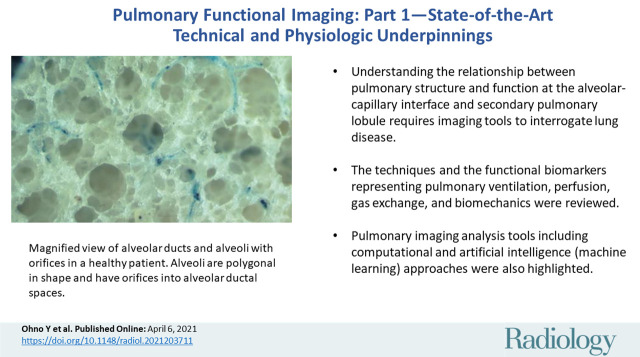
Pulmonary Functional Imaging: Part 1-State-of-the-Art Technical and Physiologic Underpinnings
- PMID: 33825513
- PMCID: PMC8165947
- DOI: 10.1148/radiol.2021203711
Pulmonary Functional Imaging: Part 1-State-of-the-Art Technical and Physiologic Underpinnings
Abstract
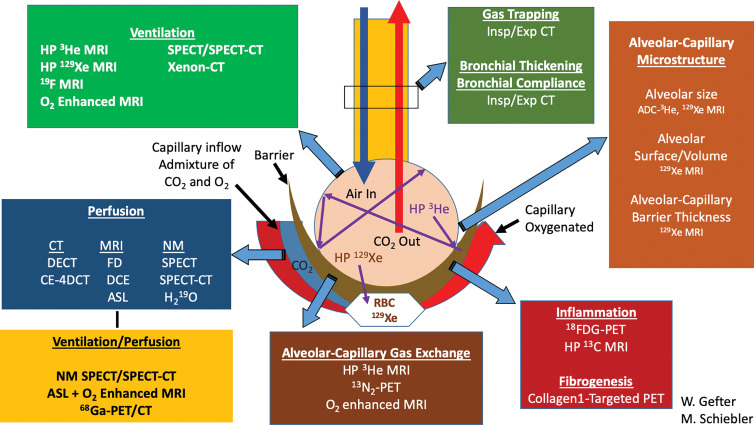
Over the past few decades, pulmonary imaging technologies have advanced from chest radiography and nuclear medicine methods to high-spatial-resolution or low-dose chest CT and MRI. It is currently possible to identify and measure pulmonary pathologic changes before these are obvious even to patients or depicted on conventional morphologic images. Here, key technological advances are described, including multiparametric CT image processing methods, inhaled hyperpolarized and fluorinated gas MRI, and four-dimensional free-breathing CT and MRI methods to measure regional ventilation, perfusion, gas exchange, and biomechanics. The basic anatomic and physiologic underpinnings of these pulmonary functional imaging techniques are explained. In addition, advances in image analysis and computational and artificial intelligence (machine learning) methods pertinent to functional lung imaging are discussed. The clinical applications of pulmonary functional imaging, including both the opportunities and challenges for clinical translation and deployment, will be discussed in part 2 of this review. Given the technical advances in these sophisticated imaging methods and the wealth of information they can provide, it is anticipated that pulmonary functional imaging will be increasingly used in the care of patients with lung disease. © RSNA, 2021 Online supplemental material is available for this article.
Conflict of interest statement
Figures
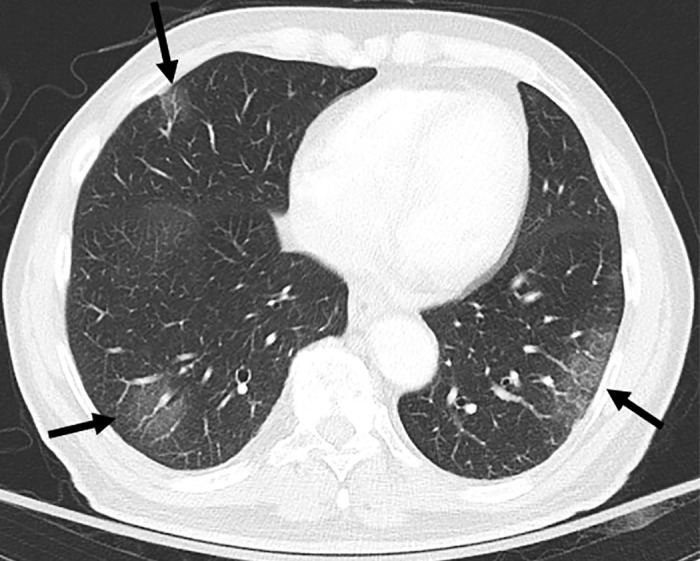
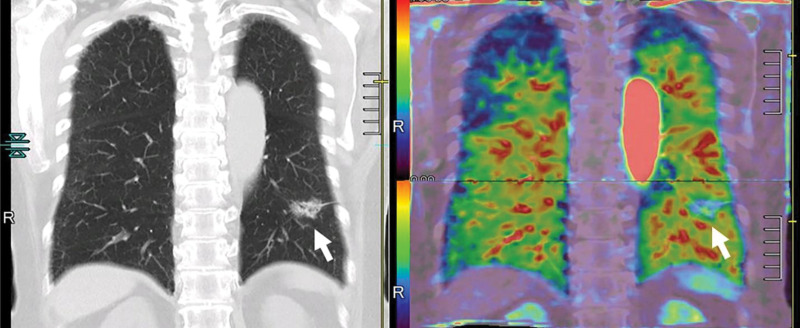
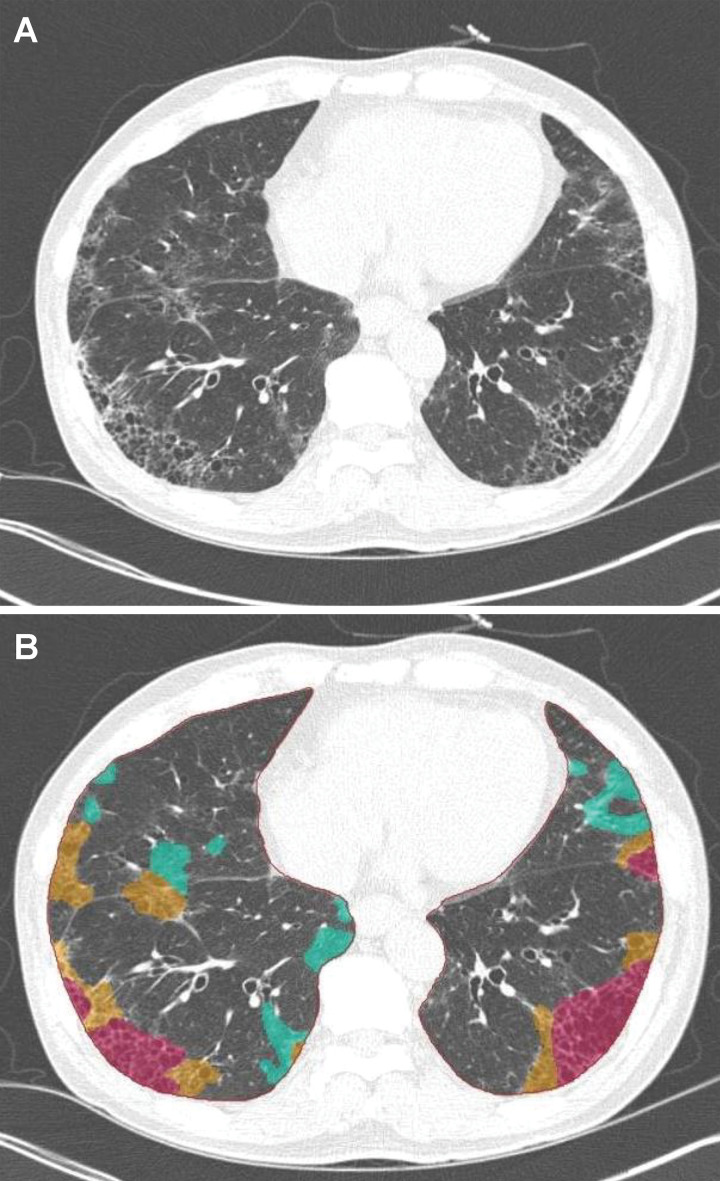
![Images in a 43-year-old male patient with pulmonary emphysema and bullae. A, Thin-section coronal image at lung window setting (left) and quantitatively assessed thin-section multiplanar reconstruction image with density-masked CT technique (right). Emphysematous lung in right upper lung (small arrow) and giant bulla in the left upper lung (large arrow) are clearly demonstrated. On quantitatively assessed thin-section multiplanar reconstruction image, healthy lung appears as green, and emphysematous lung or bullae appears as red with applying threshold value 2950 HU. B, Oxygen-enhanced MRI scan shown as a relative-enhancement map (gray scale, 0% [black] and 50% [white]). Emphysematous lung in right upper lung (small arrow) and giant bulla in the left upper lung (large arrow) are clearly demonstrated as black areas. In addition, the remainder of both lungs are heterogeneously enhanced because of emphysematous lung and airflow limitations.](https://cdn.ncbi.nlm.nih.gov/pmc/blobs/d597/8165947/cbfde9670f28/radiol.2021203711.fig6.jpg)
Similar articles
-
Pulmonary Functional Imaging: Part 2-State-of-the-Art Clinical Applications and Opportunities for Improved Patient Care.Radiology. 2021 Jun;299(3):524-538. doi: 10.1148/radiol.2021204033. Epub 2021 Apr 13. Radiology. 2021. PMID: 33847518 Free PMC article. Review.
-
Outracing Lung Signal Decay - Potential of Ultrashort Echo Time MRI.Rofo. 2019 May;191(5):415-423. doi: 10.1055/a-0715-2246. Epub 2018 Sep 26. Rofo. 2019. PMID: 30257269 English.
-
[Functional imaging of the lung using a gaseous contrast agent: (3)helium-magnetic resonance imaging].Rofo. 2005 May;177(5):660-9. doi: 10.1055/s-2005-858063. Rofo. 2005. PMID: 15871081 Review. German.
-
Pulmonary Ventilation Maps Generated with Free-breathing Proton MRI and a Deep Convolutional Neural Network.Radiology. 2021 Feb;298(2):427-438. doi: 10.1148/radiol.2020202861. Epub 2020 Dec 8. Radiology. 2021. PMID: 33289613
-
Functional imaging of the lungs with gas agents.J Magn Reson Imaging. 2016 Feb;43(2):295-315. doi: 10.1002/jmri.25002. Epub 2015 Jul 27. J Magn Reson Imaging. 2016. PMID: 26218920 Free PMC article. Review.
Cited by
-
State of the Art MR Imaging for Lung Cancer TNM Stage Evaluation.Cancers (Basel). 2023 Feb 2;15(3):950. doi: 10.3390/cancers15030950. Cancers (Basel). 2023. PMID: 36765907 Free PMC article. Review.
-
Lung functional imaging.Breathe (Sheff). 2023 Sep;19(3):220272. doi: 10.1183/20734735.0272-2022. Epub 2023 Nov 14. Breathe (Sheff). 2023. PMID: 38020338 Free PMC article.
-
Wasted ventilation in mild COPD: protocol for a clinical physiology and functional imaging study.ERJ Open Res. 2025 Jun 16;11(3):00686-2024. doi: 10.1183/23120541.00686-2024. eCollection 2025 May. ERJ Open Res. 2025. PMID: 40524929 Free PMC article.
-
Using Functional Lung MRI to Predict Chronic Lung Allograft Dysfunction.Radiology. 2023 May;307(4):e230636. doi: 10.1148/radiol.230636. Epub 2023 Apr 18. Radiology. 2023. PMID: 37070992 Free PMC article. No abstract available.
-
Artificial intelligence in functional imaging of the lung.Br J Radiol. 2022 Apr 1;95(1132):20210527. doi: 10.1259/bjr.20210527. Epub 2021 Dec 10. Br J Radiol. 2022. PMID: 34890215 Free PMC article. Review.
References
-
- West JB. Respiratory Physiology People and Ideas. New York, NY: Springer-Verlag, 1996.
-
- Albertin K. Structural organization and quantitative morphology of the lung. In: Cutillo AG, ed. Application of Magnetic Resonance to the Study of Lung. Armonk, NY: Futura, 1996; 73–114.
-
- Staub NC. Pulmonary edema. Physiol Rev 1974;54(3):678–811. - PubMed
-
- Piiper J, Scheid P. Models for a comparative functional analysis of gas exchange organs in vertebrates. J Appl Physiol 1982;53(6):1321–1329. - PubMed
Publication types
MeSH terms
Substances
Grants and funding
- R01 HL126771/HL/NHLBI NIH HHS/United States
- R01 HL091762/HL/NHLBI NIH HHS/United States
- S10 OD016394/OD/NIH HHS/United States
- R01 HL130974/HL/NHLBI NIH HHS/United States
- U01 HL146002/HL/NHLBI NIH HHS/United States
- R01 HL111024/HL/NHLBI NIH HHS/United States
- R01 HL135142/HL/NHLBI NIH HHS/United States
- U01 HL102225/HL/NHLBI NIH HHS/United States
- UG1 HL139118/HL/NHLBI NIH HHS/United States
- R01 CA203636/CA/NCI NIH HHS/United States
- U01 CA209414/CA/NCI NIH HHS/United States
- PJT 148624/CIHR/Canada
- HEV 440431/CIHR/Canada
LinkOut - more resources
Full Text Sources
Other Literature Sources
Medical
Miscellaneous
