

Association of Human Mobility Restrictions and Race/Ethnicity-Based, Sex-Based, and Income-Based Factors With Inequities in Well-being During the COVID-19 Pandemic in the United States
- PMID: 33825836
- PMCID: PMC8027913
- DOI: 10.1001/jamanetworkopen.2021.7373
Association of Human Mobility Restrictions and Race/Ethnicity-Based, Sex-Based, and Income-Based Factors With Inequities in Well-being During the COVID-19 Pandemic in the United States
Abstract
Importance: An accurate understanding of the distributional implications of public health policies is critical for ensuring equitable responses to the COVID-19 pandemic and future public health threats.
Objective: To identify and quantify the association of race/ethnicity-based, sex-based, and income-based inequities of state-specific lockdowns with 6 well-being dimensions in the United States.
Design, setting, and participants: This pooled, repeated cross-sectional study used data from 14 187 762 households who participated in phase 1 of the population-representative US 2020 Household Pulse Survey (HPS). Households were invited to participate by email, text message, and/or telephone as many as 3 times. Data were collected via an online questionnaire from April 23 to July 21, 2020, and participants lived in all 50 US states and the District of Columbia.
Exposures: Indicators of race/ethnicity, sex, and income and their intersections.
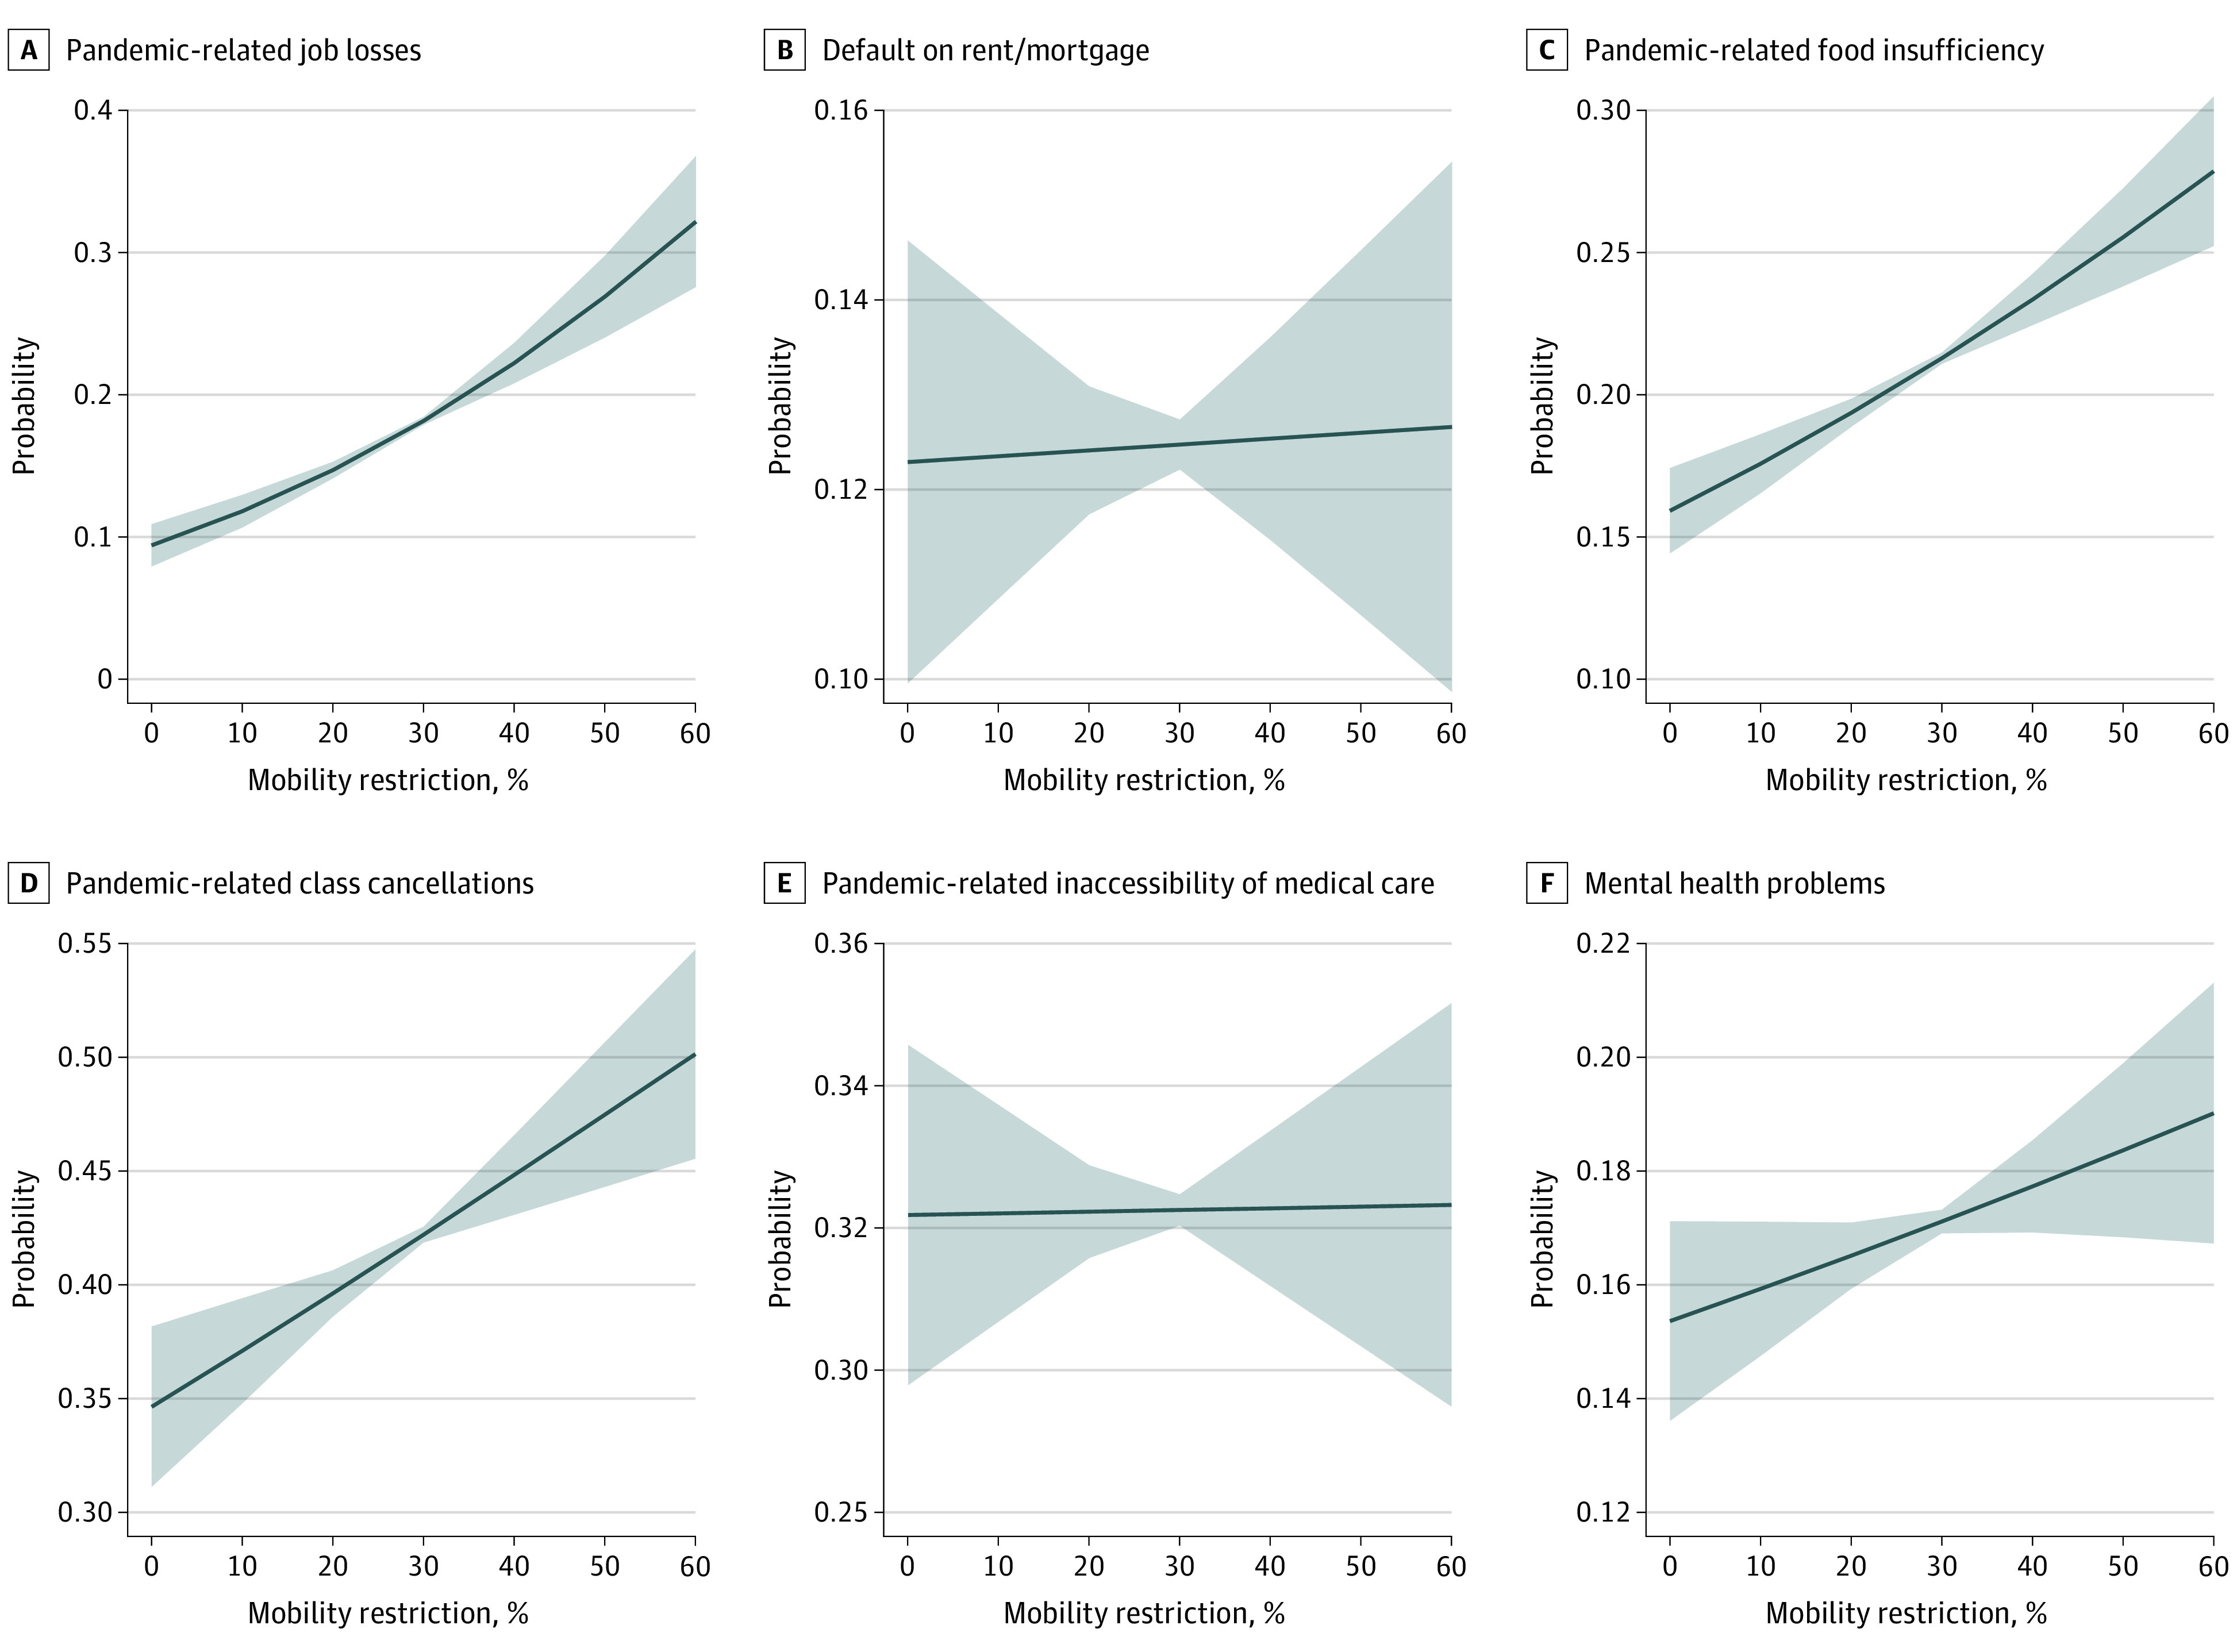
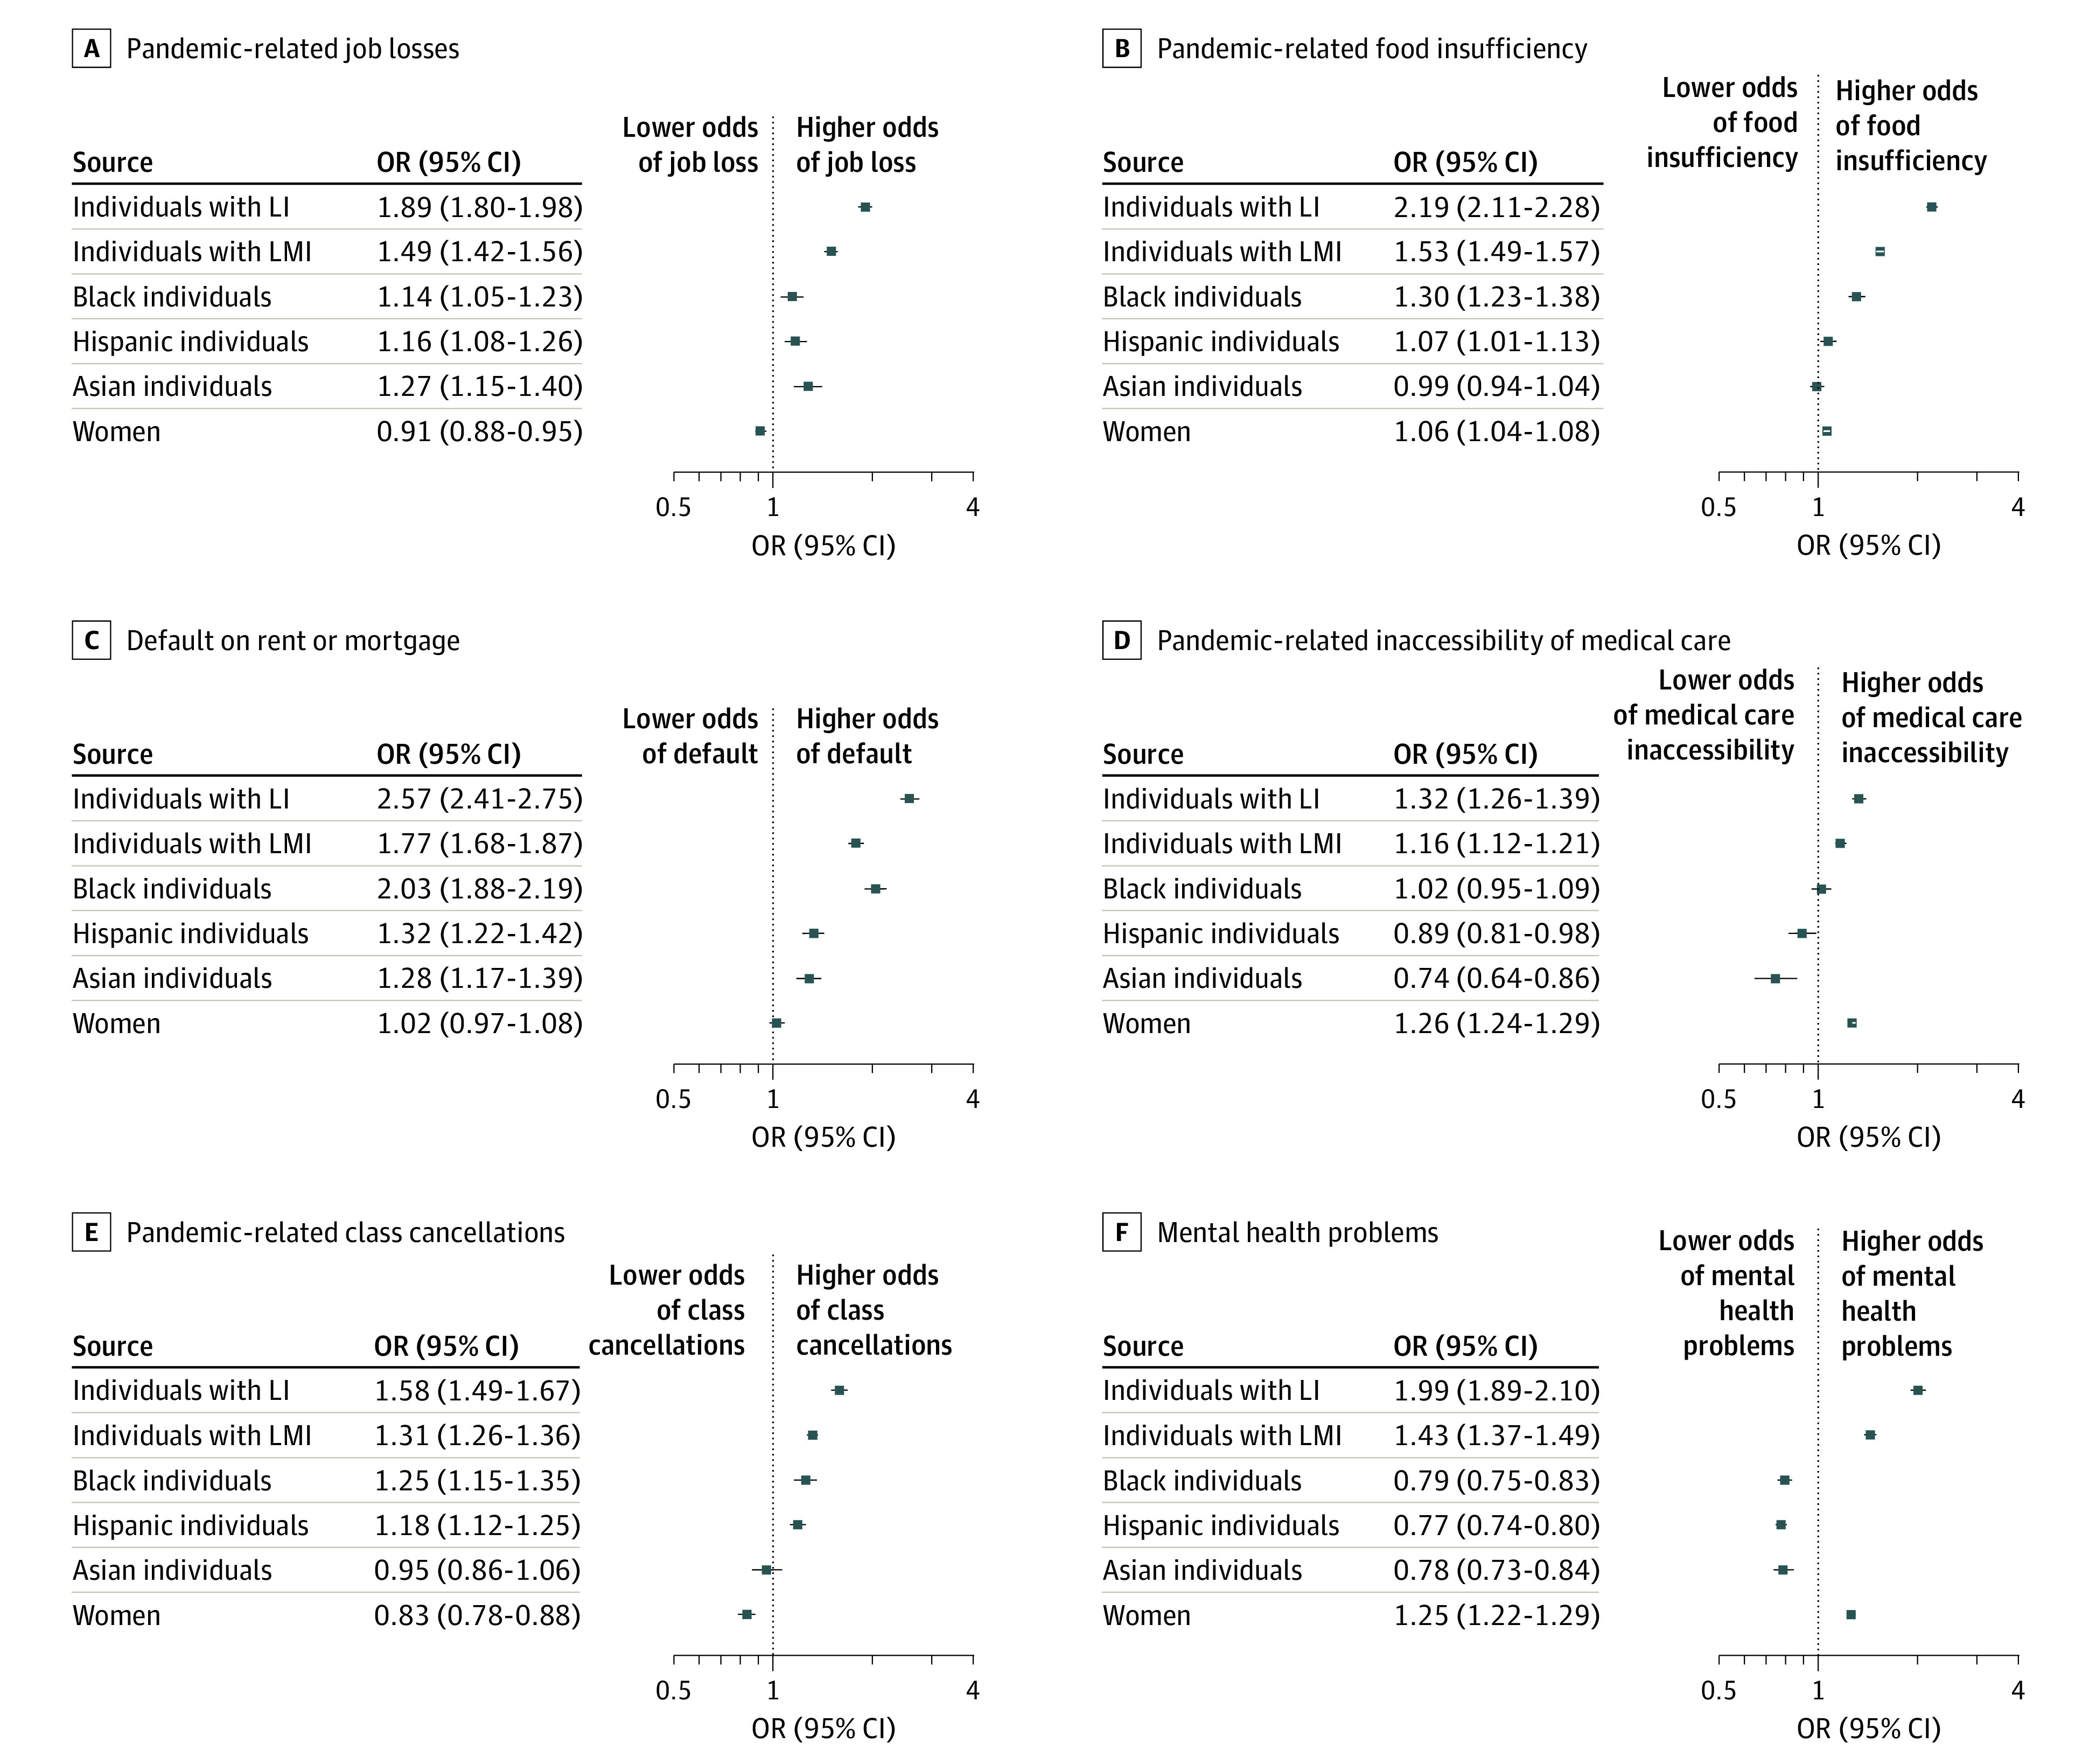
Main outcomes and measures: Unemployment; food insufficiency; mental health problems; no medical care received for health problems; default on last month's rent or mortgage; and class cancellations with no distance learning. Race/ethnicity, sex, income, and their intersections were used to measure distributional implications across historically marginalized populations; state-specific, time-varying population mobility was used to measure lockdown intensity. Logistic regression models with pooled repeated cross-sections were used to estimate risk of dichotomous outcomes by social group, adjusted for confounding variables.
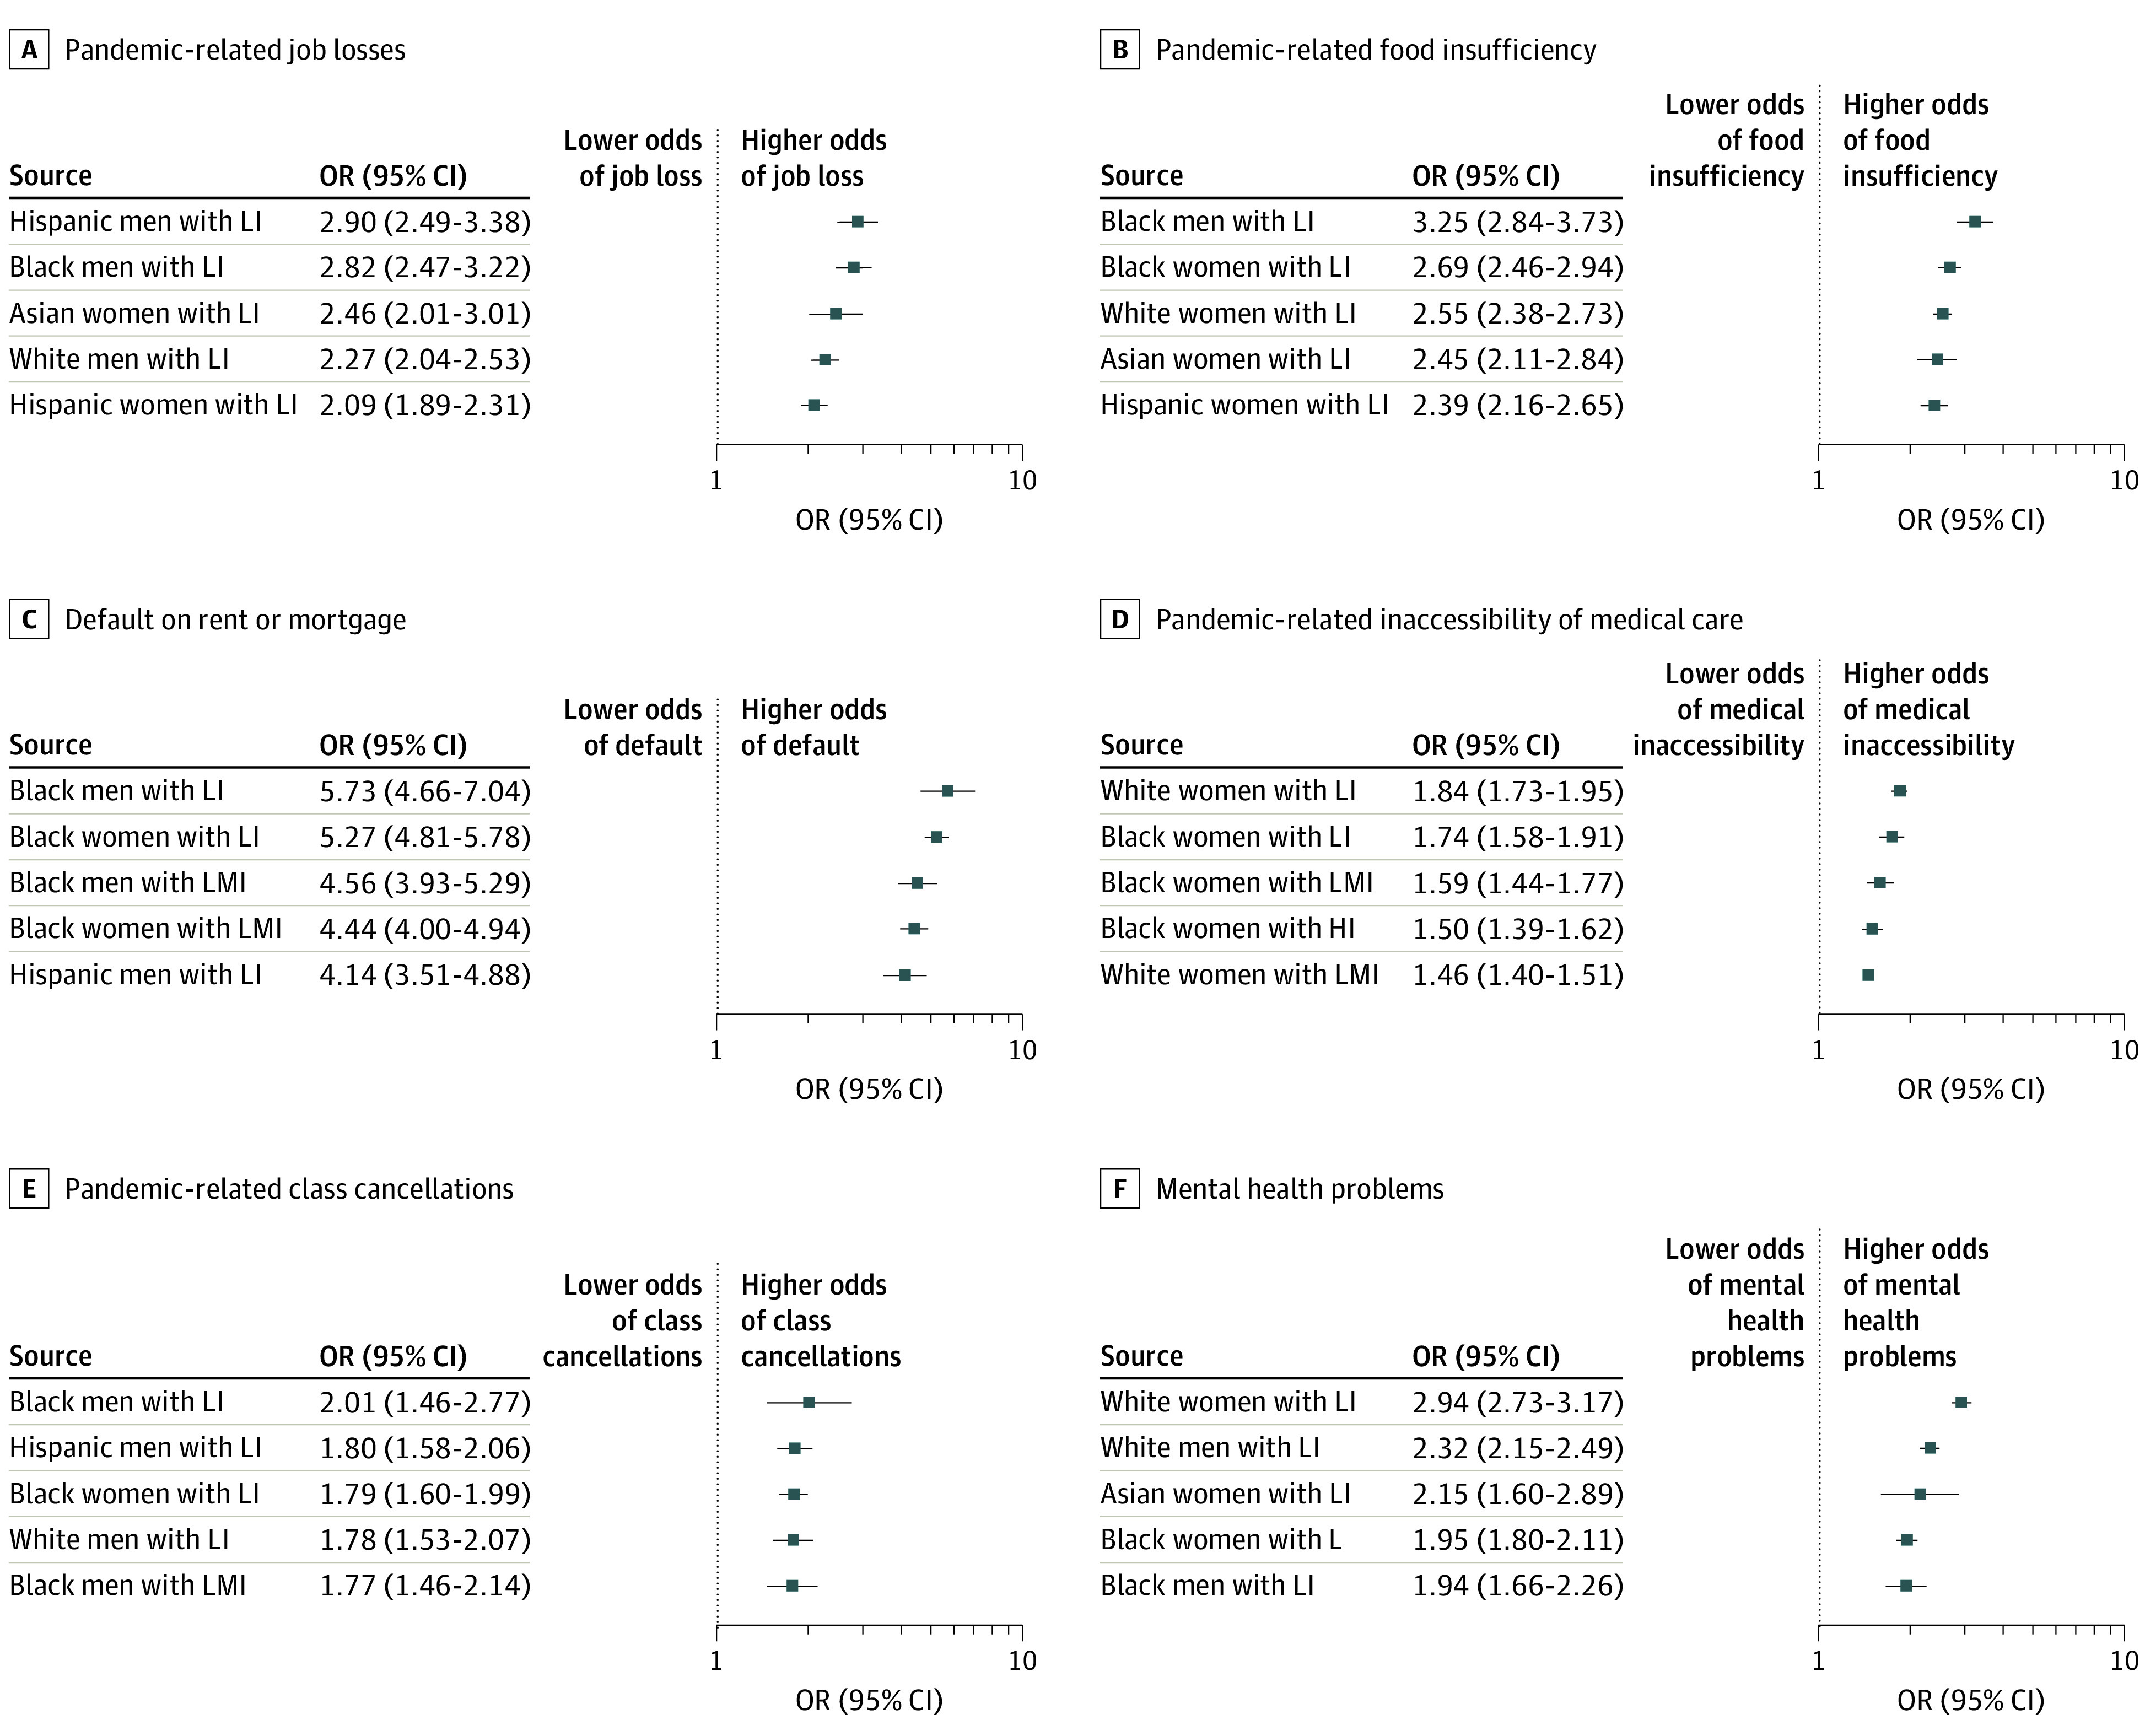
Results: The 1 088 314 respondents (561 570 [51.6%; 95% CI, 51.4%-51.9%] women) were aged 18 to 88 years (mean [SD], 51.55 [15.74] years), and 826 039 (62.8%; 95% CI, 62.5%-63.1%) were non-Hispanic White individuals; 86 958 (12.5%; 95% CI, 12.4%-12.7%), African American individuals; 86 062 (15.2%; 95% CI, 15.0%-15.4%), Hispanic individuals; and 50 227 (5.6%; 95% CI, 5.5%-5.7%), Asian individuals. On average, every 10% reduction in mobility was associated with higher odds of unemployment (odds ratio [OR], 1.3; 95% CI, 1.2-1.4), food insufficiency (OR, 1.1; 95% CI, 1.1-1.2), mental health problems (OR, 1.04; 95% CI, 1.0-1.1), and class cancellations (OR, 1.1; 95% CI, 1.1-1.2). Across most dimensions compared with White men with high income, African American individuals with low income experienced the highest risks (eg, food insufficiency, men: OR, 3.3; 95% CI, 2.8-3.7; mental health problems, women: OR, 1.9; 95% CI, 1.8-2.1; medical care inaccessibility, women: OR, 1.7; 95% CI, 1.6-1.9; unemployment, men: OR, 2.8; 95% CI, 2.5-3.2; rent/mortgage defaults, men: OR, 5.7; 95% CI, 4.7-7.1). Other high-risk groups were Hispanic individuals (eg, unemployment, Hispanic men with low income: OR, 2.9; 95% CI, 2.5-3.4) and women with low income across all races/ethnicities (eg, medical care inaccessibility, non-Hispanic White women: OR, 1.8; 95% CI, 1.7-2.0).
Conclusions and relevance: In this cross-sectional study, African American and Hispanic individuals, women, and households with low income had higher odds of experiencing adverse outcomes associated with the COVID-19 pandemic and stay-at-home orders. Blanket public health policies ignoring existing distributions of risk to well-being may be associated with increased race/ethnicity-based, sex-based, and income-based inequities.
Conflict of interest statement
Figures
References
-
- Adhikari S, Pantaleo NP, Feldman JM, Ogedegbe O, Thorpe L, Troxel AB. Assessment of community-level disparities in coronavirus disease 2019 (COVID-19) infections and deaths in large US metropolitan areas. JAMA Netw Open. 2020;3(7):e2016938-e2016938. doi:10.1001/jamanetworkopen.2020.16938 - DOI - PMC - PubMed
Publication types
MeSH terms
LinkOut - more resources
Full Text Sources
Other Literature Sources
Medical
Miscellaneous
