

Expression of Genes in the 16p11.2 Locus during Development of the Human Fetal Cerebral Cortex
- PMID: 33825894
- PMCID: PMC8328201
- DOI: 10.1093/cercor/bhab067
Expression of Genes in the 16p11.2 Locus during Development of the Human Fetal Cerebral Cortex
Abstract
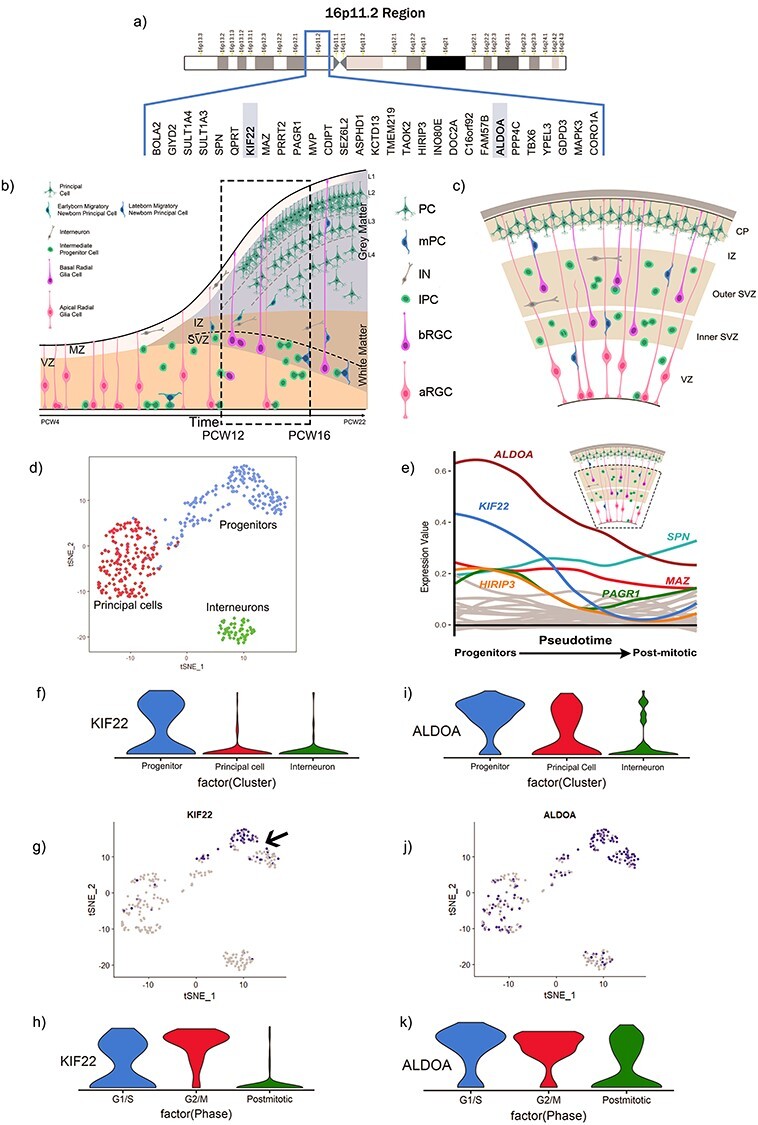
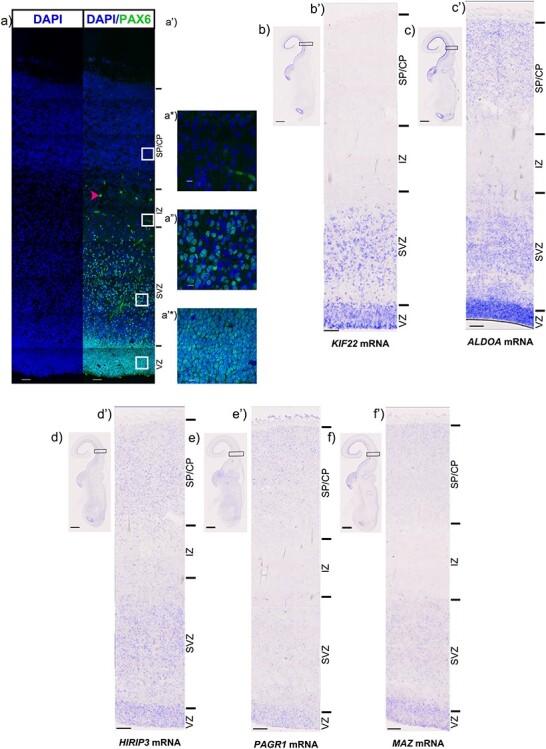
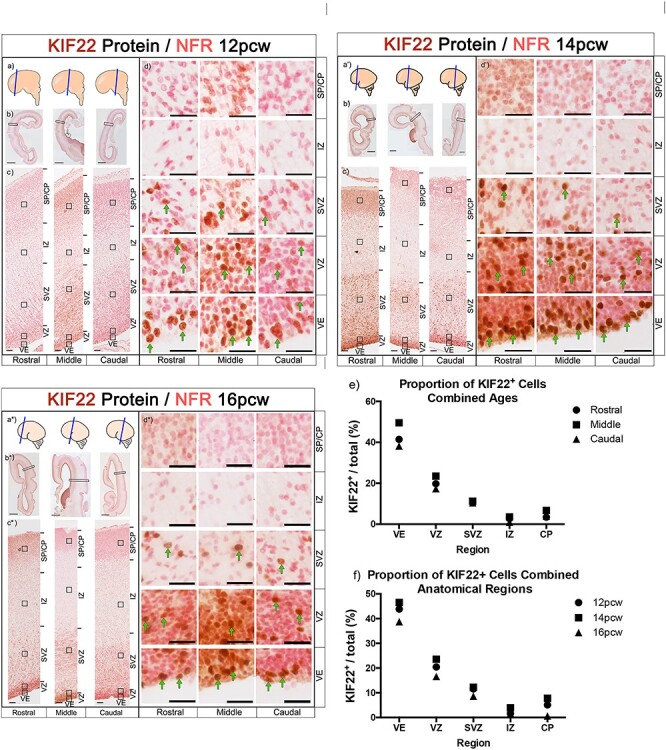
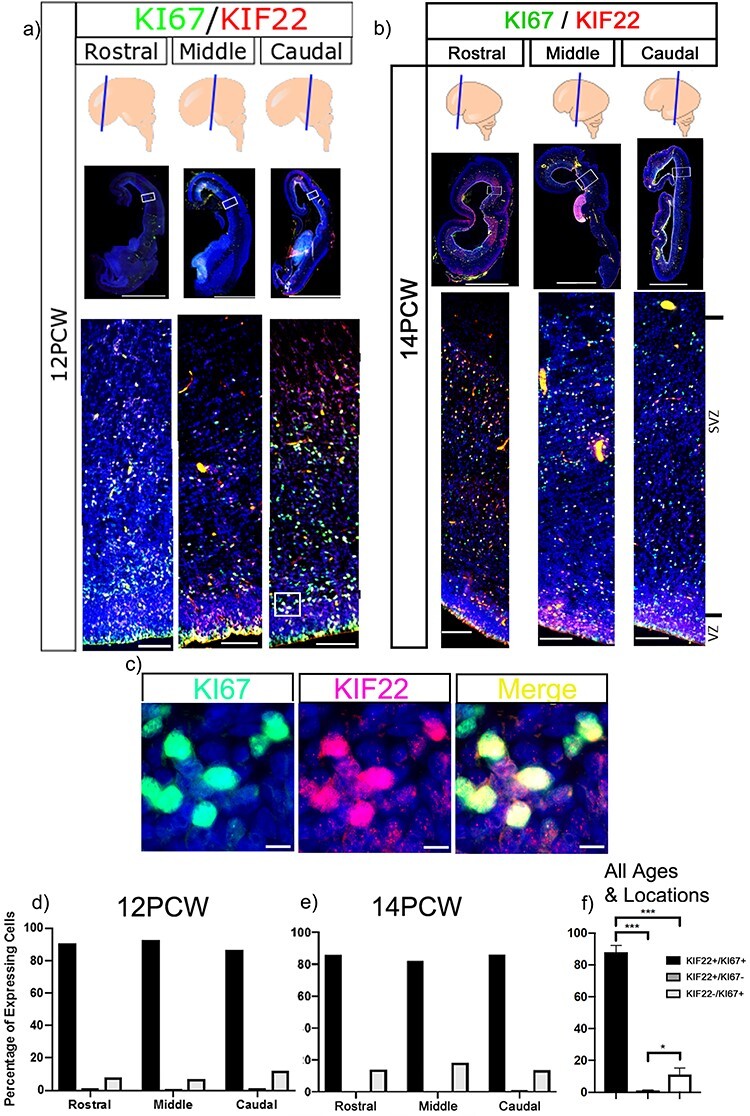
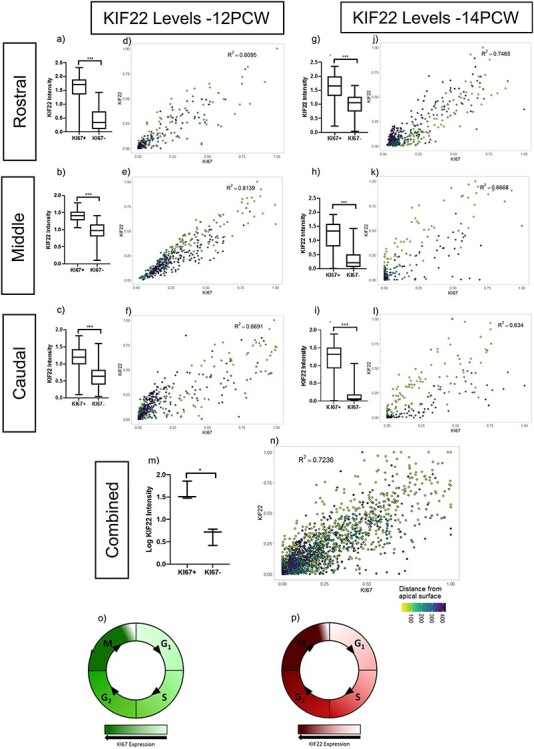
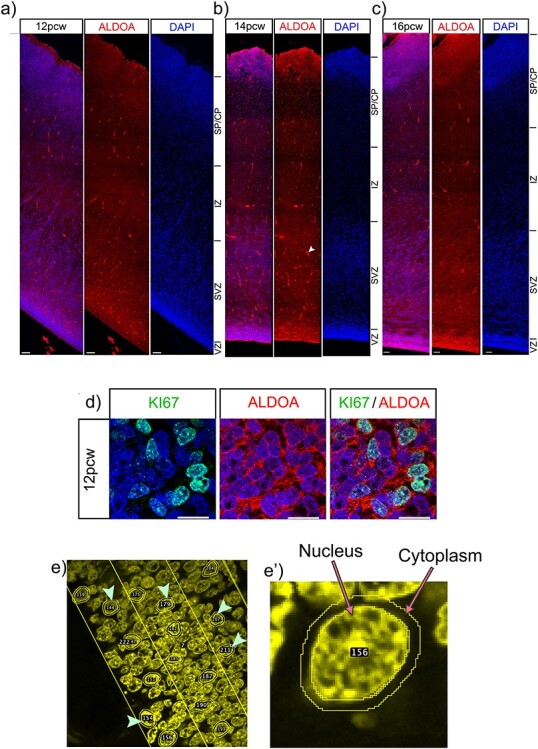
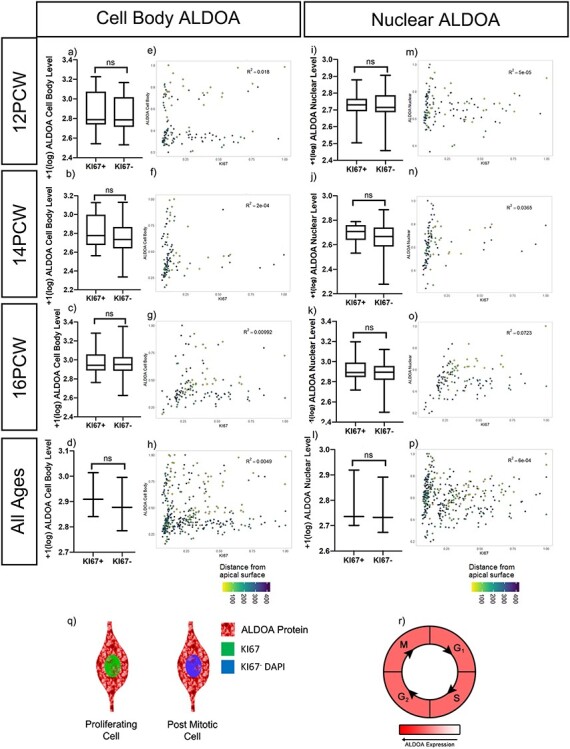
The 593 kbp 16p11.2 copy number variation (CNV) affects the gene dosage of 29 protein coding genes, with heterozygous 16p11.2 microduplication or microdeletion implicated in about 1% of autism spectrum disorder (ASD) cases. The 16p11.2 CNV is frequently associated with macrocephaly or microcephaly indicating early defects of neurogenesis may contribute to subsequent ASD symptoms, but it is unknown which 16p11.2 transcripts are expressed in progenitors and whose levels are likely, therefore, to influence neurogenesis. Analysis of human fetal gene expression data revealed that KIF22, ALDOA, HIRIP3, PAGR1, and MAZ transcripts are expressed in neural progenitors with ALDOA and KIF22 significantly enriched compared to post-mitotic cells. To investigate the possible roles of ALDOA and KIF22 proteins in human cerebral cortex development we used immunohistochemical staining to describe their expression in late first and early second trimester human cerebral cortex. KIF22 protein is restricted to proliferating cells with its levels increasing during the cell cycle and peaking at mitosis. ALDOA protein is expressed in all cell types and does not vary with cell-cycle phase. Our expression analysis suggests the hypothesis that altered neurogenesis in the cerebral cortex contributes to ASD in 16p11.2 CNV patients.
Keywords: ALDOA; CNV; KIF22; autism; cerebral cortex.
© The Author(s) 2021. Published by Oxford University Press.
Figures
Similar articles
-
Psychotic symptoms in 16p11.2 copy-number variant carriers.Autism Res. 2020 Feb;13(2):187-198. doi: 10.1002/aur.2232. Epub 2019 Nov 14. Autism Res. 2020. PMID: 31724820
-
Cortical organoids model early brain development disrupted by 16p11.2 copy number variants in autism.Mol Psychiatry. 2021 Dec;26(12):7560-7580. doi: 10.1038/s41380-021-01243-6. Epub 2021 Aug 26. Mol Psychiatry. 2021. PMID: 34433918 Free PMC article.
-
Transcriptional consequences of 16p11.2 deletion and duplication in mouse cortex and multiplex autism families.Am J Hum Genet. 2014 Jun 5;94(6):870-83. doi: 10.1016/j.ajhg.2014.05.004. Am J Hum Genet. 2014. PMID: 24906019 Free PMC article.
-
16p11.2 Copy Number Variations and Neurodevelopmental Disorders.Trends Neurosci. 2020 Nov;43(11):886-901. doi: 10.1016/j.tins.2020.09.001. Epub 2020 Sep 28. Trends Neurosci. 2020. PMID: 32993859 Free PMC article. Review.
-
Copy-number variation in the pathogenesis of autism spectrum disorder.Psychiatry Clin Neurosci. 2014 Feb;68(2):85-95. doi: 10.1111/pcn.12128. Epub 2013 Dec 29. Psychiatry Clin Neurosci. 2014. PMID: 24372918 Review.
Cited by
-
16p11.2 deletion accelerates subpallial maturation and increases variability in human iPSC-derived ventral telencephalic organoids.Development. 2023 Feb 15;150(4):dev201227. doi: 10.1242/dev.201227. Epub 2023 Feb 24. Development. 2023. PMID: 36826401 Free PMC article.
-
TAOK2 rescues autism-linked developmental deficits in a 16p11.2 microdeletion mouse model.Mol Psychiatry. 2022 Nov;27(11):4707-4721. doi: 10.1038/s41380-022-01785-3. Epub 2022 Sep 19. Mol Psychiatry. 2022. PMID: 36123424 Free PMC article.
-
A Hypothesis: Metabolic Contributions to 16p11.2 Deletion Syndrome.Bioessays. 2025 Mar;47(3):e202400177. doi: 10.1002/bies.202400177. Epub 2024 Dec 29. Bioessays. 2025. PMID: 39988938 Free PMC article. Review.
-
PA1 participates in the maintenance of blood-testis barrier integrity via cooperation with JUN in the Sertoli cells of mice.Cell Biosci. 2022 Apr 4;12(1):41. doi: 10.1186/s13578-022-00773-y. Cell Biosci. 2022. PMID: 35379345 Free PMC article.
-
Prenatal phenotypes and pregnancy outcomes of fetuses with 16p11.2 microdeletion/microduplication.BMC Pregnancy Childbirth. 2024 Jul 22;24(1):494. doi: 10.1186/s12884-024-06702-w. BMC Pregnancy Childbirth. 2024. PMID: 39039444 Free PMC article.
References
-
- Bayer SA, Altman J. 2002. The Human Brain During the Late First Trimester. England: Taylor & Francis Group (Head Office) United Kingdom.
-
- Bayer SA, Altman J. 2005. The Human Brain During The Second Trimester. England: Taylor & Francis Group (Head Office) United Kingdom.
-
- Beasley CL, Pennington K, Behan A, Wait R, Dunn MJ, Cotter D. 2006. Proteomic analysis of the anterior cingulate cortex in the major psychiatric disorders: evidence for disease-associated changes. Proteomics. 6:3414–3425. - PubMed
-
- Beutler E, Scott S, Bishop A, Margolis N, Matsumoto F, Kuhl W. 1973. Red cell aldolase deficiency and hemolytic anemia: a new syndrome. Trans Assoc Am Physicians. 86:154–166. - PubMed
-
- Bijlsma EK, Gijsbers AC, Schuurs-Hoeijmakers JH, Haeringen A, Fransen van de Putte DE, Anderlid BM, Lundin J, Lapunzina P, Pérez Jurado LA, Delle Chiaie B, et al. . 2009. Extending the phenotype of recurrent rearrangements of 16p11.2: deletions in mentally retarded patients without autism and in normal individuals. Eur J Med Genet. 52:77–87. - PubMed
Publication types
MeSH terms
Grants and funding
LinkOut - more resources
Full Text Sources
Other Literature Sources
Medical
Miscellaneous
