Review
. 2021 Aug;46(8):3579-3595.
doi: 10.1007/s00261-021-03059-y. Epub 2021 Apr 7.

Contrast-enhanced ultrasound (CEUS) in HCC diagnosis and assessment of tumor response to locoregional therapies

Affiliations
Review

Contrast-enhanced ultrasound (CEUS) in HCC diagnosis and assessment of tumor response to locoregional therapies

John R Eisenbrey et al. Abdom Radiol (NY). 2021 Aug.

Abstract

Hepatocellular carcinoma (HCC) is a global problem constituting the second leading cause of cancer deaths worldwide, thereby necessitating an accurate and cost-effective solution for managing care. Ultrasound is well poised to address this need due to its low cost, portability, safety, and excellent temporal resolution. The role of ultrasound for HCC screening has been well established and supported by multiple international guidelines. Similarly, contrast-enhanced ultrasound (CEUS) can be used for the characterization of focal liver lesions in high-risk populations, and standardized criteria for CEUS have been established by the American College of Radiology Liver Imaging Reporting & Data System (LI-RADS). Following HCC identification, CEUS can also be highly beneficial in treatment planning, delivery, and monitoring HCC response to locoregional therapies. Specific advantages of CEUS include providing real-time treatment guidance and improved diagnostic performance for the detection of residual tumor viability or recurrence, thereby identifying patients in need of retreatment substantially earlier than contrast-enhanced CT and MRI. This review provides a primer on ultrasound and CEUS for the screening and characterization of HCC, with an emphasis on assessing tumor response to locoregional therapies.

Keywords: Ablation; Contrast-enhanced ultrasound; HCC; LI-RADS; Transarterial embolization; Ultrasound.


Conflict of interest statement

Conflict of interest JRE: Equipment, contrast agent, and research support from GE Healthcare. Equipment support from Siemens Health-ineers. Equipment support from Canon Medical Systems. Drug and speaker fees from Lantheus Medical Imaging. Royalties from Elsevier. HG: None. ES: None. AL: GE Healthcare—research support, consulting, and speaker fees; Siemens—research support; Canon Medical—research support; Bracco Diagnostics—research support, advisory board member; Elsevier—book royalties.

Figures

Fig. 1
Fig. 1
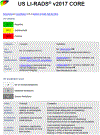
American College of Radiology US LI-RADS criteria describing reporting criteria for HCC screening in high-risk populations. Reproduced with permission from the American College of Radiology (ACR) [8]
Fig. 2
Fig. 2
US LI-RADS Category and Visualization Scores. Figure 2A-D Category Scores. a US-1 Negative: No ultrasound evidence of HCC. Here, a benign cyst is shown with the arrow. b US-2 Subthreshold. Observation is detected that may warrant short-term ultrasound surveillance. The arrow points to a subcentimeter echogenic observation only seen on the high-resolution linear array surface images. c, d Positive: Observation is detected that may warrant multiphase contrast-enhanced imaging. Here, a solid hypoechoic mass is detected on screening ultrasound marked by the arrow. Figure 2e-g Visualization Scores. e Visualization A has no or minimal limitations. f Visualization B has moderate limitations due to extensive coarsened echotexture from cirrhosis. g Visualization C has severe limitations due to a very limited sonographic window
Fig. 3
Fig. 3
American College of Radiology CEUS LI-RADS criteria describing reporting criteria for the characterization of focal liver lesions in high-risk populations. Reproduced with permission from the ACR [9]
Fig. 4
Fig. 4
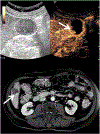
Example images showing the use of CEUS LI-RADS. (Left) B-mode image demonstrating an indeterminate liver lesion (arrows). (Center) CEUS shows hyperenhancement in the mass (arrows) relative to the adjacent liver during the arterial phase. (Right) Late and mild washout is observed within the mass (arrow) in the portal phase. Using CEUS LI-RADS criteria, this mass is classified as CEUS LR-5
Fig. 5
Fig. 5
HCC patient after MWA ablation. a Late-arterial CT image demonstrates avascular ablation cavity (*) and a vague area of increased enhancement anterior to the ablation cavity (arrow) that was interpreted as AV-shunt. b Portal-venous CT image in the same patient demonstrates area of decreased enhancement anterior to the ablation cavity (arrow) that was interpreted as post-ablation changes with no evidence of recurrent or residual tumor. On ultrasound, the ablation cavity is well visualized on B-mode (circled). c Early arterial CEUS with avascular ablation cavity (*) similar to CT and a large area of arterial phase hyperenhancement (arrow), which on portalvenous CEUS image d demonstrated early washout (arrow), consistent with incomplete ablation and large residual tumor anterior to the ablation cavity
Fig. 6
Fig. 6
HCC patient after MWA ablation. a Pre-contrast T1-weighted MRI image demonstrates ablation cavity (*) expected post-ablation hemorrhagic necrosis. b Contrast-enhanced MRI image demonstrates avascular ablation cavity (*) with mild peripheral enhancement (arrow). c Early arterial CEUS demonstrates completely avascular ablation cavity (*), similar to MRI, with small area of central calci fication (arrow) seen on corresponding B-mode image. No areas of arterial phase hyperenhancement (APHE) were detected in the surrounding liver parenchyma. d Portal venous CEUS image demonstrates no contrast washout surrounding the ablation cavity (arrow), confirming the absence of residual untreated tumor. Please, note far superior resolution of CEUS compared to CE-MRI
Fig. 7
Fig. 7
HCC patient after TACE. (Top): CEUS 1 week post treatment demonstrates the tumor (circled on B-mode) with peripheral nodular enhancement (arrow) in the arterial phase, suggesting the presence of viable tumor. (Bottom) Similar findings are demonstrated on CE-MRI 1 month post treatment, indicating a need for retreatment. These findings illustrate how retreatment can potentially be performed earlier when using CEUS for residual detection
Fig. 8
Fig. 8
HCC patient after TACE. (Top) CEUS 1 week post treatment demonstrates the tumor (circled on B-mode) with no internal enhancement (arrow) in the arterial phase with smooth margins indicating complete tumor embolization. (Bottom) Similar findings are demonstrated on CE-MRI 1 month post treatment, indicating the absence of viable tumor (arrow). These findings illustrate how patient management can be established earlier using CEUS as compared to MRI
Fig. 9
Fig. 9
HCC patient after TACE. a CEUS 1 month post treatment demonstrates clear internal enhancement within the tumor (circled on B-mode) in the arterial phase and irregular enhancing margins on the right border of the treatment cavity (arrow), indicating viable tumor. b CE-MRI at 1 month demonstrates no clear evidence of residual tumor viability within the treatment cavity (arrow). Tumor viability was later confirmed by tumor growth and viable vascularity on angiography during retreatment. These findings show how CEUS can improve the diagnostic performance of MRI for monitoring response of HCC to TACE
Fig. 10
Fig. 10
Incomplete HCC treatment after TARE. a pretreatment contrast-enhanced MRI shows a 6.8 cm HCC (circled) in segment 6/7. b MRI 4 months post TARE demonstrates patchy arterial phase contrast enhancement (arrow) within the treated HCC. c CEUS 4 months post TARE using dual imaging showing the tumor (circled) on B-mode and patchy arterial phase contrast enhancement within the viable residual tumor (arrow) with much greater resolution compared to MRI

Similar articles

Cited by

References

    1. Horowitz JM, Kamel IR, Arif-Tiwari H, Asrani SK, Hindman NM, Kaur H, McNamara MM, Noto RB, Qayyum A, Lalani T (2017) ACR Appropriateness Criteria(®) Chronic Liver Disease. J Am Coll Radiol 14:S391–s405. 10.1016/j.jacr.2017.08.045 - DOI - PubMed
    1. American College of Radiology Committee on LI-RADS® (2018) CT/MRI LI-RADS® v2018 CORE. https://www.acr.org/-/media/ACR/Files/RADS/LI-RADS/LI-RADS-2018-Core.pdf.... Accessed 01 January 2021
    1. Ferlay J, Soerjomataram I, Ervik M, Dikshit R, Eser S, Mathers C, Rebelo M, Parkin DM, Forman D, Bray F (2012) GLOBOCAN 2012: Estimated Cancer Incidence, Mortality and Prevalence Worldwide in 2012. International Agency for Research on Cancer. globocan.iarc.fr. Accessed 01 January 2021
    1. National Cancer Institute Surveillance, Epidemiology, and End Results (SEER) Program (2009) SEER*Stat Database: Incidence-SEER Research Data 9 Registries. Accessed 01 January 2021
    1. Wilson JM, Jungner YG (1968) Principles and practices of screening for disease. World Health Organization. https://apps.who.int/iris/handle/10665/37650. Accessed 01 January 2021

Publication types

MeSH terms

LinkOut - more resources