. 2021 Apr 22;125(15):3739-3751.
doi: 10.1021/acs.jpcb.0c10992. Epub 2021 Apr 7.

Thermodynamics and Free Energy Landscape of BAR-Domain Dimerization from Molecular Simulations

Affiliations

Thermodynamics and Free Energy Landscape of BAR-Domain Dimerization from Molecular Simulations

Adip Jhaveri et al. J Phys Chem B. .

Abstract

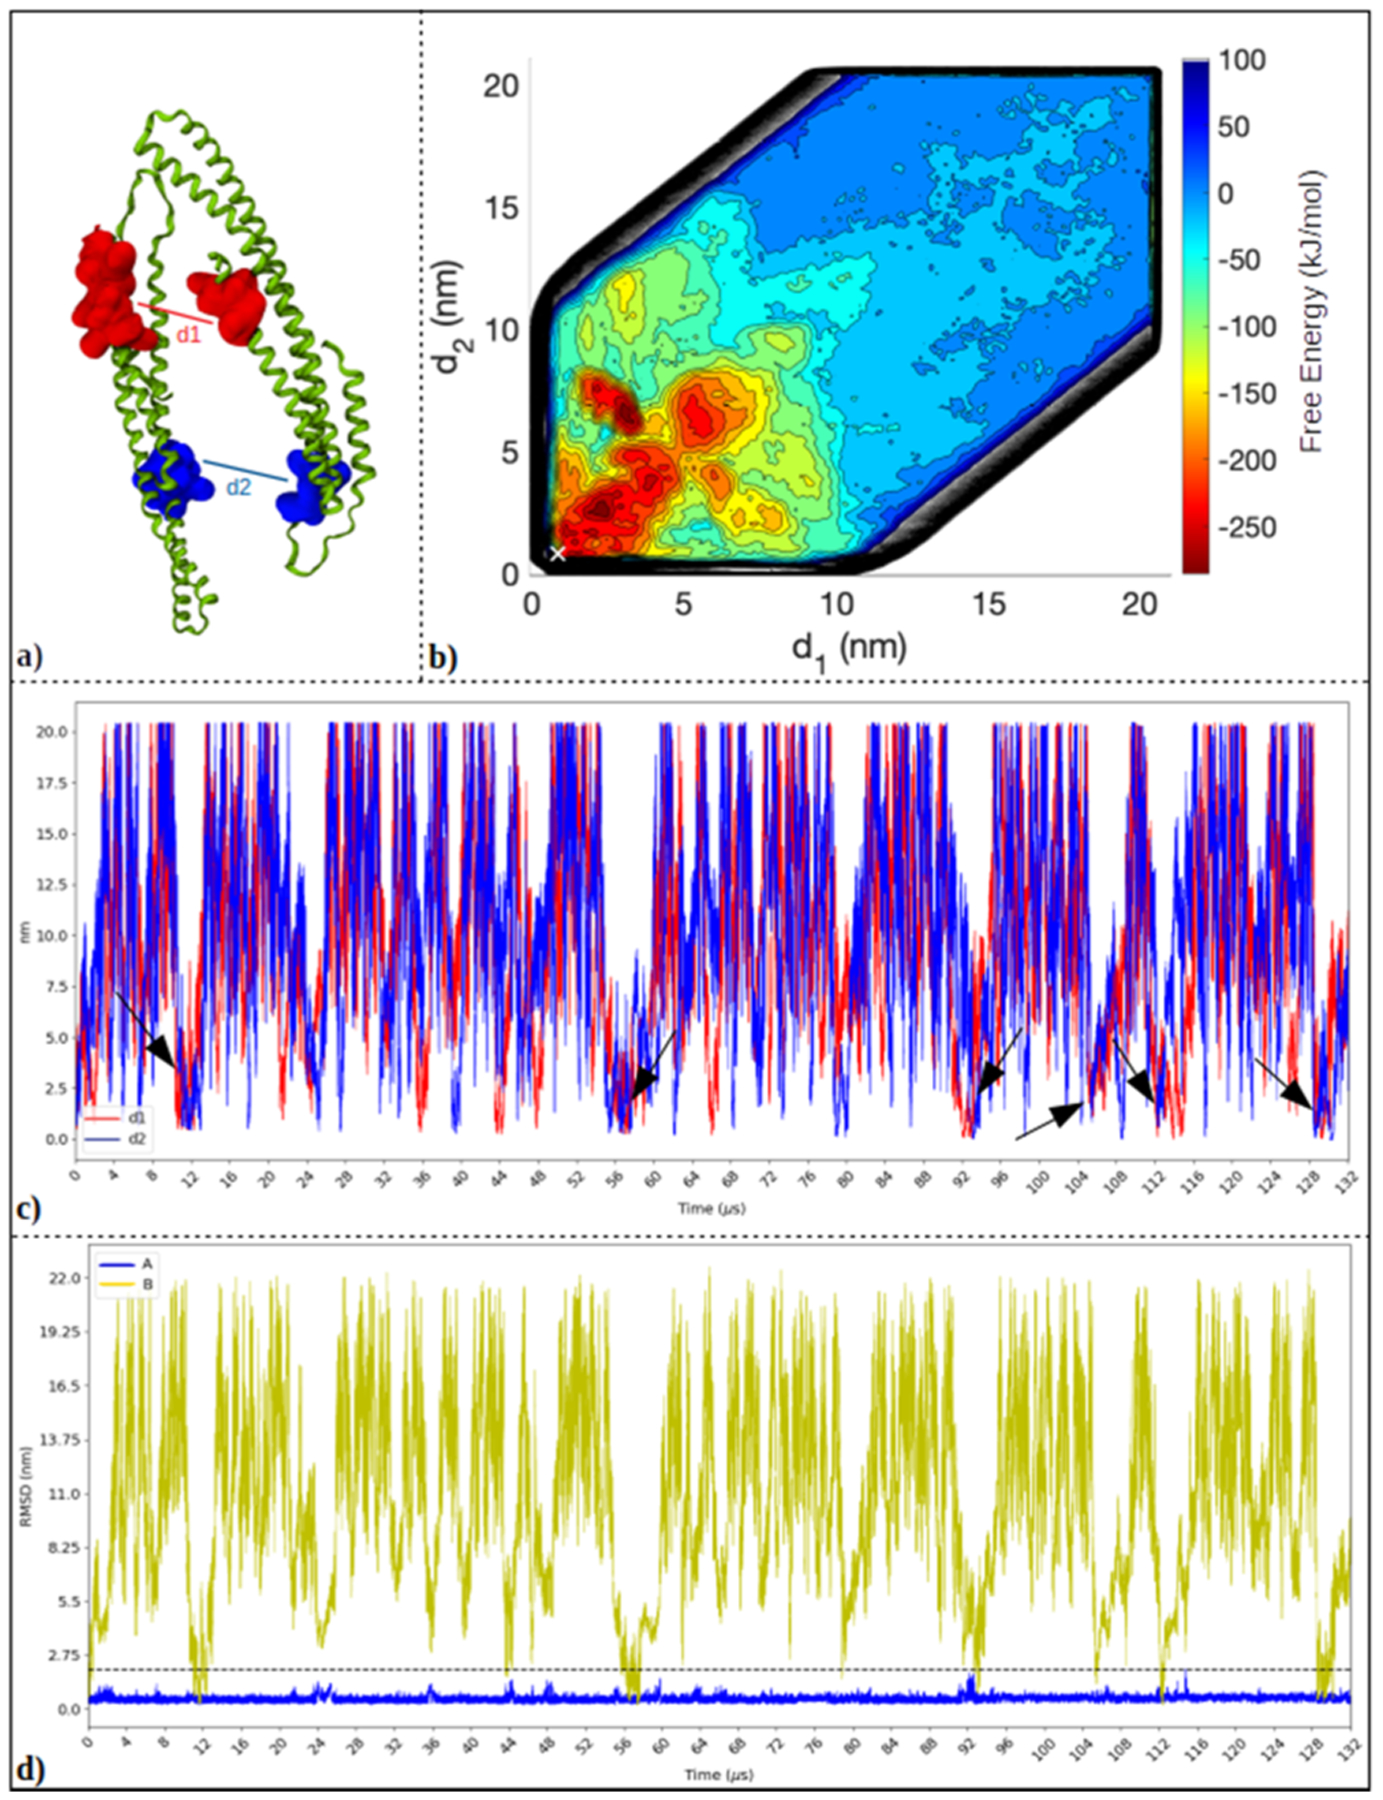
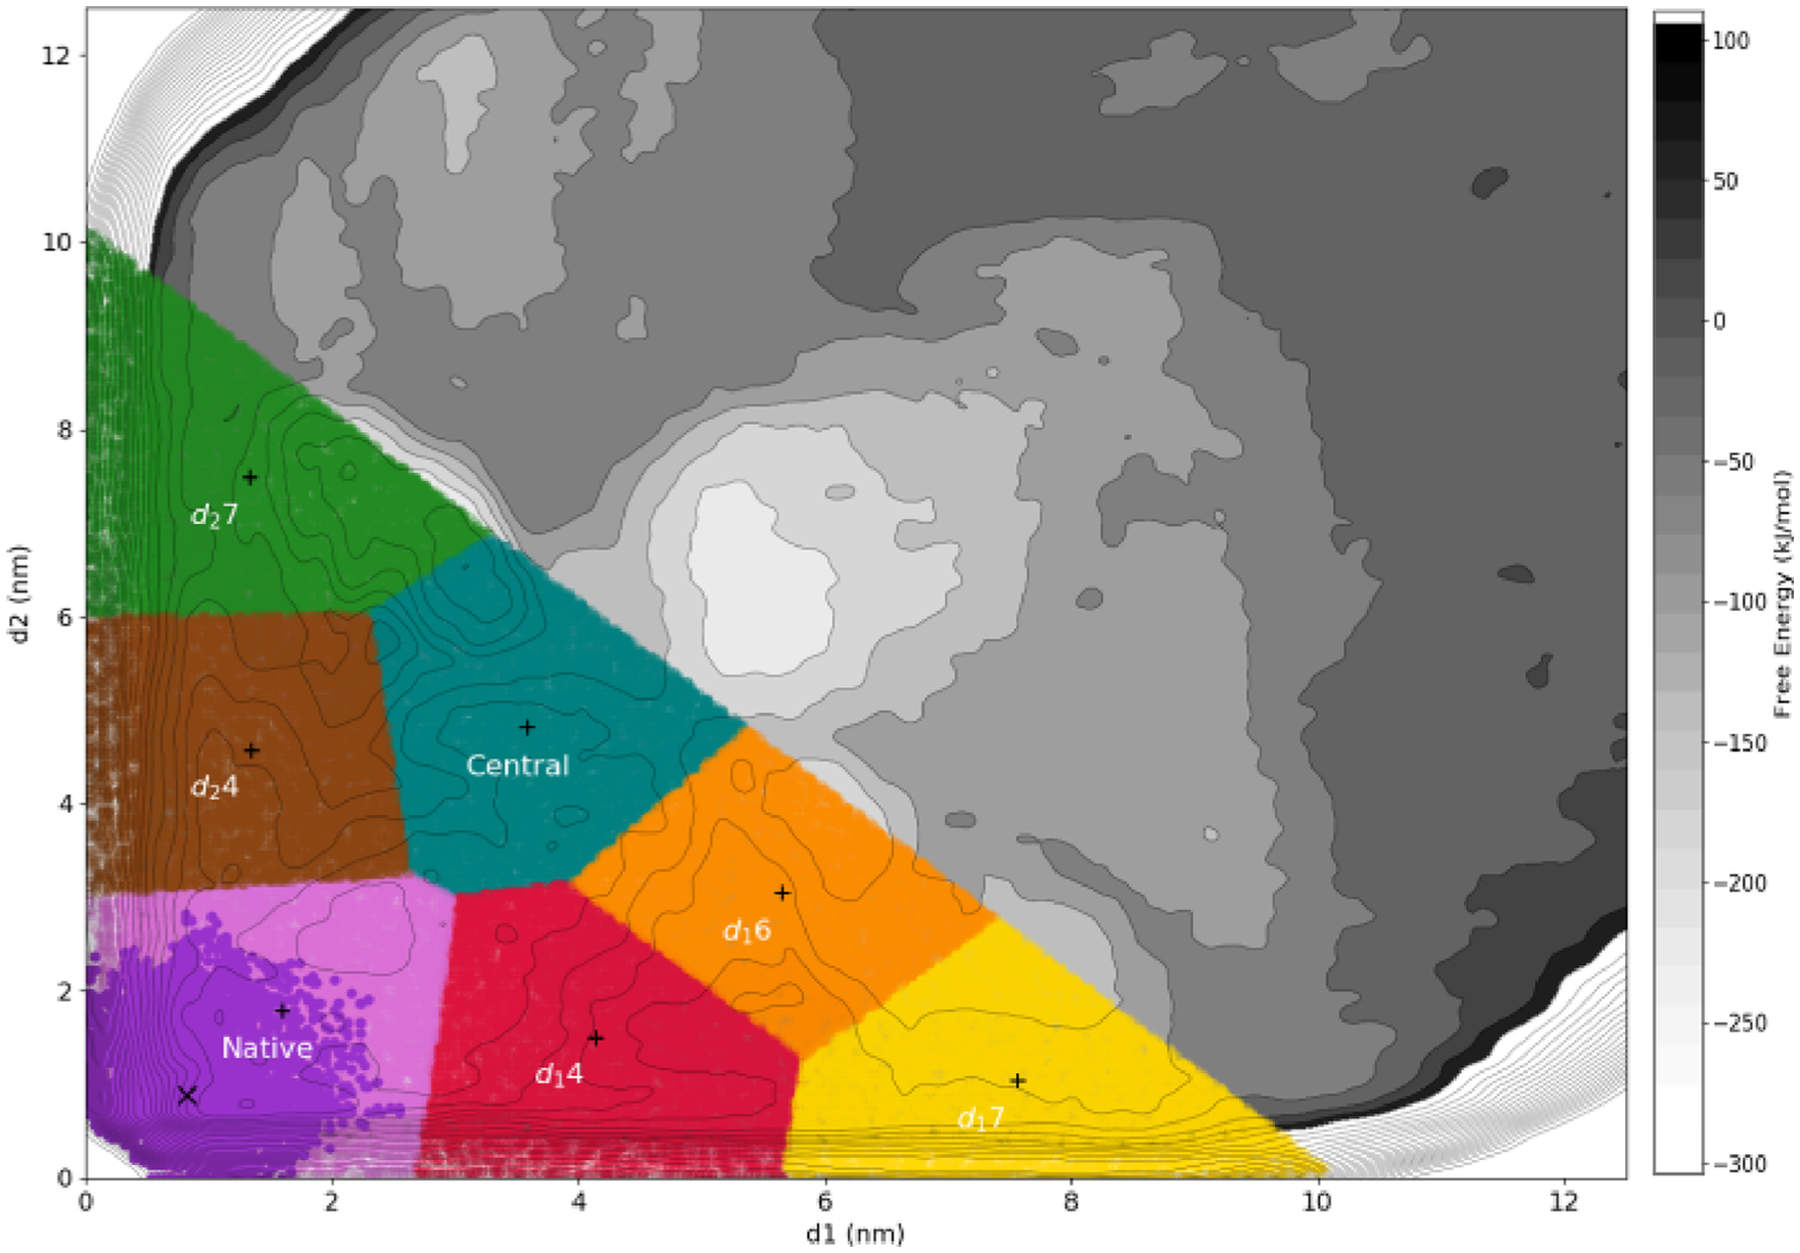
Proteins with BAR domains function to bind to and remodel biological membranes, where the dimerization of BAR domains is a key step in this function. These domains can dimerize in solution or after localizing to the membrane surface. Here, we characterize the binding thermodynamics of homodimerization between the LSP1 BAR domain proteins in solution, using molecular dynamics (MD) simulations. By combining the MARTINI coarse-grained protein models with enhanced sampling through metadynamics, we construct a two-dimensional free energy surface quantifying the bound versus unbound ensembles as a function of two distance variables. With this methodology, our simulations can simultaneously characterize the structures and relative stabilities of a range of sampled dimers, portraying a heterogeneous and extraordinarily stable bound ensemble, where the proper crystal structure dimer is the most stable in a 100 mM NaCl solution. Nonspecific dimers that are sampled involve contacts that are consistent with experimental structures of higher-order oligomers formed by the LSP1 BAR domain. Because the BAR dimers and oligomers can assemble on membranes, we characterize the relative alignment of the known membrane binding patches, finding that only the specific dimer is aligned to form strong interactions with the membrane. Hence, we would predict a strong selection of the specific dimer in binding to or assembling when on the membrane. Establishing the pairwise stabilities of homodimer contacts is difficult experimentally when the proteins form stable oligomers, but through the method used here, we can isolate these contacts, providing a foundation to study the same interactions on the membrane.


Conflict of interest statement

The authors declare no competing financial interest.

Figures

Figure 1.
Figure 1.
(a) Crystal structure of the LSP1 homodimer, showing both chains A and B represented in a ribbon form. Each chain follows a gradient from blue (N terminus) to green (C terminus). (b) LSP1 homodimer rotated by 90° around the z axis and 90° again around the x axis relative to (a). The color scheme is same as in (a). (c) Surface representation of the homodimer colored according to electrostatic potential and in similar orientation as in (b). We can see positively charged, blue colored, patches (highlighted by black boxes) of the dimer, which interacts with the negatively charged membrane.
Figure 2.
Figure 2.
(a) LSP1 chains A and B with the CVs, d1 and d2 between the two binding sites (shown as surface representation in red and blue). (b) Contour plot of the free energy as a function of d1 and d2 as calculated from metadynamics. This is the instantaneous FES after 132 μs. The “X” represents the CV values for the crystal structure. (c) Progression of d1 (red) and d2 (blue) with time. The arrows represent transition events to the native bound state, calculated where the RMSD between our dimer and the crystal structure drops below 2 nm. (d) Change in RMSD of chain A (blue) and chain B (yellow) with time.
Figure 3.
Figure 3.
Time evolution of the free energy difference ΔG0. (a) ΔG0 values are reported as bound state free energies relative to the same unbound ensemble, which is always denoted by the region outside the blue lines, where d1, d2 = 12.5 nm. The time evolution of the blue solid line is the difference between the free energy inside and outside of the blue lines. We define two sub-regions of the bound ensemble for comparison, a specific bound region (black dashed) and a nonspecific region (magenta dashed). The specific bound regions is d1 < 4, d2 < 4.5. The nonspecific region is 4 < d1 < 8 and 4 < d2 < 8. Significant oscillations in free energies occur due to the relative slow timescale of filling up regions of CV space and no dampening applied to bias potentials. The standard deviations of ΔG are 57 kJ/mol (blue), 70 kJ/mol (black), and 54 kJ/mol (magenta). (b) Dependence of the two-state ΔG0 on the cutoff in d1, d2 between bound and unbound. Values averaged after 72 μs (purple), and final values (cyan) are shown.
Figure 4.
Figure 4.
Simulations of LSP1 homodimerization in 100 mM NaCl. (a) The 1D FES display similar energy scales as without salt, but the region closest to the crystal structure (vertical lines) are now the most stable, and the nonspecific states are more compact, in some cases significantly less stable than the region closest to the crystal (vertical lines). (b) Full 2D FES (white X at crystal). All energy units kJ/mol. (c) CV sampling in time, where we note we increased the box size from 24 to 36 nm (at 19 μs). (d) Standard free energy difference as the sampling accumulates shows the specific bound state is determining the overall bound state free energy after 25 μs. At the end of the simulation, ΔG0 = −248 kJ/mol.
Figure 5.
Figure 5.
FES after 132 μs with bound ensemble clusters shown. There are seven clusters, configurations of which are projected on an enlarged FES (d1 < 12.5 nm, d2 < 12.5 nm) from Figure 2b. Clustering was performed for all configurations where chains A and B are in contact (see Section II) and with d1 + d2 < 10.2 nm. The crystal structure, denoted by a black X, is included in the Native cluster. The darker shade in the Native cluster represents the configurations with RMSD of <1 nm. Three clusters have relative short values of d2 and are then labeled by their d1 values via d14 (red; d1 = 4.14, d2 = 1.5), d16 (orange; d1 = 5.66, d2 = 3.0), and d17 (yellow; d1 = 7.57, d2 = 1.04). One cluster has similar d1 and d2 values, labeled Central (teal; d1 = 3.56, d2 = 4.80). Two clusters have short values of d1 and are then labeled by their d2 values via d24 (brown; d1 = 1.34, d2 = 4.57) and d27 (green; d1 = 1.34, d2 = 7.47). The centroids of each clusters are displayed by a black +.
Figure 6.
Figure 6.
Clustered structures and their associated free energies. The Crystal structure contains only a very small region of the CV space around the crystal structure. The other clusters are defined as shown in Figure 5. The Native cluster is closest to and encompassing the crystal structure. All ΔGo values are in kJ/mol, with SEM. Chain A is in orange and Chain B is green, with the CV patches colored as in Figure 2.
Figure 7.
Figure 7.
Distance and orientation distributions of bound clusters. The Native cluster in mauve encompasses the crystal structure, indicated in black X in all panels, but also has more variation. (a) Distance dc tracks the separation between the monomer centers. (b) RMSD between chain B and the crystal structure, after aligning chain A (Section II), which is zero by definition for the crystal. (c) Distance dM is the separation between the two membrane binding patches (one patch per monomer). (d) The angle α reports the orientation of membrane binding patches relative to each other (Section II). In the crystal, they are close to a parallel orientation.
Figure 8.
Figure 8.
Contact map. We have partitioned all the residues of the monomer into 11 groups, based on whether they are part of the natively bound interface (d1, d2, dc, NP-1, and NP-2), or residues that are not part of the bound interface (tail, NNP-1, NNP-2, NNP-3, and NNP-4). Lastly, the residues that stabilize contacts of the dimer with the membrane are in M. Clusters are the same as in Figure 6. Color bars indicate the fraction of contacts formed between groups, across the ensemble of states per cluster.

Similar articles

Cited by

References

    1. Simunovic M; Evergren E; Callan-Jones A; Bassereau P Curving Cells Inside and Out: Roles of BAR Domain Proteins in Membrane Shaping and Its Cellular Implications. Annu. Rev. Cell Dev. Biol 2019, 35, 111–129. - PubMed
    1. McMahon HT; Boucrot E Molecular mechanism and physiological functions of clathrin-mediated endocytosis. Nat. Rev. Mol. Cell Biol 2011, 12, 517–533. - PubMed
    1. Ziółkowska NE; Karotki L; Rehman M; Huiskonen JT; Walther TC Eisosome-driven plasma membrane organization is mediated by BAR domains. Nat. Struct. Mol. Biol 2011, 18, 854–856. - PubMed
    1. Nicot AS; et al. Mutations in amphiphysin 2 (BIN1) disrupt interaction with dynamin 2 and cause autosomal recessive centronuclear myopathy. Nat. Genet 2007, 39, 1134–1139. - PubMed
    1. Masuda M; Mochizuki N Structural characteristics of BAR domain superfamily to sculpt the membrane. Semin. Cell Dev. Biol 2010, 21, 391–398. - PubMed

Publication types

LinkOut - more resources