

Two-dimensional shear wave elastography and ultrasound-guided attenuation parameter for progressive non-alcoholic steatohepatitis
- PMID: 33826669
- PMCID: PMC8026049
- DOI: 10.1371/journal.pone.0249493
Two-dimensional shear wave elastography and ultrasound-guided attenuation parameter for progressive non-alcoholic steatohepatitis
Abstract
Background and aims: We investigated the usefulness of combining two-dimensional shear wave elastography and the ultrasound-guided attenuation parameter for assessing the risk of progressive non-alcoholic steatohepatitis, defined as non-alcoholic steatohepatitis with a non-alcoholic fatty liver disease activity score of ≥4 and a fibrosis stage of ≥2.
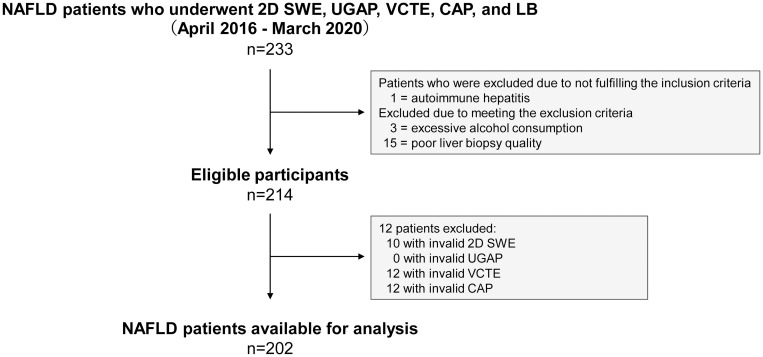
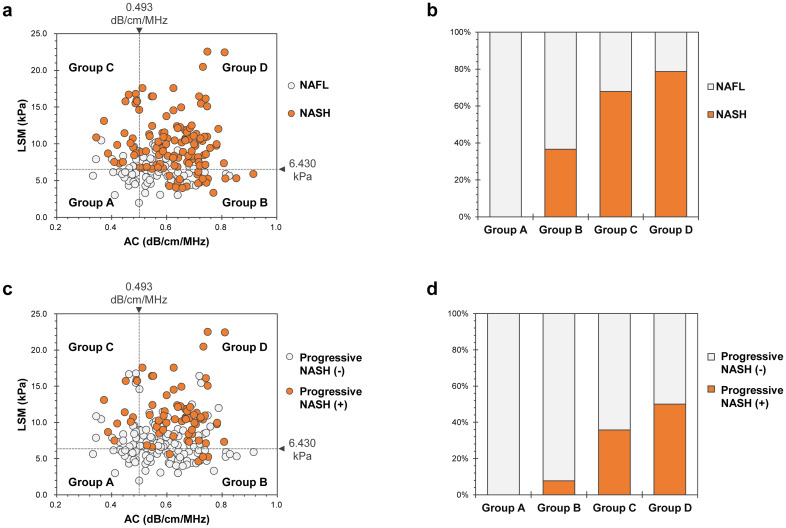
Methods: This prospective study included 202 patients with non-alcoholic fatty liver disease who underwent two-dimensional shear wave elastography, ultrasound-guided attenuation parameter, vibration-controlled transient elastography, the controlled attenuation parameter, and liver biopsy on the same day. Patients were grouped according to liver stiffness measurement using two-dimensional shear wave elastography and the attenuation coefficient, assessed using the ultrasound-guided attenuation parameter: A, low liver stiffness measurement/low attenuation coefficient; B, low liver stiffness measurement/high attenuation coefficient; C, high liver stiffness measurement/low attenuation coefficient; and D, high liver stiffness measurement/high attenuation coefficient.
Results: Two-dimensional shear wave elastography and vibration-controlled transient elastography had equivalent diagnostic performance for fibrosis. The areas under the curve of the ultrasound-guided attenuation parameter for identifying steatosis grades ≥S1, ≥S2, and S3 were 0.89, 0.91, and 0.92, respectively, which were significantly better than those of the controlled attenuation parameter (P<0.05). The percentages of progressive non-alcoholic steatohepatitis in Groups A, B, C, and D were 0.0%, 7.7%, 35.7%, and 50.0%, respectively (P<0.001). The prediction model was established as logit (p) = 0.5414 × liver stiffness measurement (kPa) + 7.791 × attenuation coefficient (dB/cm/MHz)-8.401, with area under the receiver operating characteristic curve, sensitivity, and specificity values of 0.832, 80.9%, and 74.6%, respectively; there was no significant difference from the FibroScan-aspartate aminotransferase score.
Conclusion: Combined assessment by two-dimensional shear wave elastography and the ultrasound-guided attenuation parameter is useful for risk stratification of progressive non-alcoholic steatohepatitis and may be convenient for evaluating the necessity of specialist referral and liver biopsy.
Conflict of interest statement
The authors have read the journal’s policy, and the authors of this manuscript have the following competing interests: T.O., S.N. and N.K. are paid employees of GE Healthcare Japan. This does not alter our adherence to PLOS ONE policies on sharing data and materials. The other authors declare that they have no competing interests. There are no products in development or marketing products to declare.
Figures
Similar articles
-
Accuracy of Two-Dimensional Shear Wave Elastography and Attenuation Imaging for Evaluation of Patients With Nonalcoholic Steatohepatitis.Clin Gastroenterol Hepatol. 2021 Apr;19(4):797-805.e7. doi: 10.1016/j.cgh.2020.05.034. Epub 2020 May 22. Clin Gastroenterol Hepatol. 2021. PMID: 32450363
-
Accuracy of FibroScan Controlled Attenuation Parameter and Liver Stiffness Measurement in Assessing Steatosis and Fibrosis in Patients With Nonalcoholic Fatty Liver Disease.Gastroenterology. 2019 May;156(6):1717-1730. doi: 10.1053/j.gastro.2019.01.042. Epub 2019 Jan 25. Gastroenterology. 2019. PMID: 30689971
-
Diagnostic Performance of 2-D Shear-Wave Elastography with Propagation Maps and Attenuation Imaging in Patients with Non-Alcoholic Fatty Liver Disease.Ultrasound Med Biol. 2021 Aug;47(8):2128-2137. doi: 10.1016/j.ultrasmedbio.2021.03.025. Epub 2021 May 10. Ultrasound Med Biol. 2021. PMID: 33985827
-
Diagnostic accuracy of elastography and magnetic resonance imaging in patients with NAFLD: A systematic review and meta-analysis.J Hepatol. 2021 Oct;75(4):770-785. doi: 10.1016/j.jhep.2021.04.044. Epub 2021 May 13. J Hepatol. 2021. PMID: 33991635
-
Liver fibrosis assessment: MR and US elastography.Abdom Radiol (NY). 2022 Sep;47(9):3037-3050. doi: 10.1007/s00261-021-03269-4. Epub 2021 Oct 23. Abdom Radiol (NY). 2022. PMID: 34687329 Free PMC article. Review.
Cited by
-
Indian National Association for Study of the Liver (INASL) Guidance Paper on Nomenclature, Diagnosis and Treatment of Nonalcoholic Fatty Liver Disease (NAFLD).J Clin Exp Hepatol. 2023 Mar-Apr;13(2):273-302. doi: 10.1016/j.jceh.2022.11.014. Epub 2022 Dec 7. J Clin Exp Hepatol. 2023. PMID: 36950481 Free PMC article. Review.
-
Reliability and stability of ultrasound-guided attenuation parameter in evaluating hepatic steatosis.J Ultrasound. 2024 Mar;27(1):145-152. doi: 10.1007/s40477-023-00856-7. Epub 2024 Jan 28. J Ultrasound. 2024. PMID: 38281291 Free PMC article.
-
Impact of shear wave elastography and attenuation imaging for predicting life-threatening event in patients with metabolic dysfunction-associated steatotic liver disease.Sci Rep. 2025 Feb 7;15(1):4547. doi: 10.1038/s41598-025-87974-w. Sci Rep. 2025. PMID: 39915518 Free PMC article.
-
Ultrasound Methods for the Assessment of Liver Steatosis: A Critical Appraisal.Diagnostics (Basel). 2022 Sep 22;12(10):2287. doi: 10.3390/diagnostics12102287. Diagnostics (Basel). 2022. PMID: 36291976 Free PMC article. Review.
-
Choline-deficient, high-fat diet-induced MASH in Göttingen Minipigs: characterization and effects of a chow reversal period.Am J Physiol Gastrointest Liver Physiol. 2024 Oct 1;327(4):G571-G585. doi: 10.1152/ajpgi.00120.2024. Epub 2024 Jul 23. Am J Physiol Gastrointest Liver Physiol. 2024. PMID: 39041677 Free PMC article.
References
MeSH terms
LinkOut - more resources
Full Text Sources
Other Literature Sources
Medical
Miscellaneous
