. 2021 Apr 7;17(4):e1009141.
doi: 10.1371/journal.ppat.1009141. eCollection 2021 Apr.

Integration in oncogenes plays only a minor role in determining the in vivo distribution of HIV integration sites before or during suppressive antiretroviral therapy

Affiliations

Integration in oncogenes plays only a minor role in determining the in vivo distribution of HIV integration sites before or during suppressive antiretroviral therapy

John M Coffin et al. PLoS Pathog. .

Abstract

HIV persists during antiretroviral therapy (ART) as integrated proviruses in cells descended from a small fraction of the CD4+ T cells infected prior to the initiation of ART. To better understand what controls HIV persistence and the distribution of integration sites (IS), we compared about 15,000 and 54,000 IS from individuals pre-ART and on ART, respectively, with approximately 395,000 IS from PBMC infected in vitro. The distribution of IS in vivo is quite similar to the distribution in PBMC, but modified by selection against proviruses in expressed genes, by selection for proviruses integrated into one of 7 specific genes, and by clonal expansion. Clones in which a provirus integrated in an oncogene contributed to cell survival comprised only a small fraction of the clones persisting in on ART. Mechanisms that do not involve the provirus, or its location in the host genome, are more important in determining which clones expand and persist.


Conflict of interest statement

I have read the journal’s policy and the authors of this manuscript have the following competing interests: JWM is a consultant to Gilead Sciences and Merck Co., Inc., and owns share options in Co-Crystal Pharmaceuticals, Inc. JMC is a member of the Scientific Advisory Board of ROME Therapeutics, Inc. All other authors declare no competing interests.

Figures

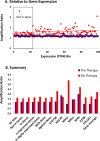
Fig 1
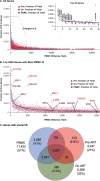
Fig 1. Gene expression and integration.
The complete set of ca 22,000 RefSeq genes was slightly modified to remove overlaps (see Methods). The non-overlapping genes were divided into either 100 bins or 4 bins, based on transcripts per million reads (TPM) obtained from the RNA-seq analysis of the in vitro infected PBMC. The 100-bin RNA-seq data are shown in green triangles in all panels. The combined IS data are shown for the genes in each of the 4 bins in all panels for PBMC (blue), pre-ART donors (plum) and on-ART donors (red). Darker colors in C and D indicate proviruses oriented in the same direction as the host gene; lighter colors are in the opposite orientation. A. Total integration site (IS) density (sites/Mb) in each bin, normalized to the average for the whole genome (125 sites/Mb for PBMC, 4.28 sites/Mb pre-ART, and 10.7 sites/Mb on-ART). B. The orientation of the proviruses relative to the host gene was calculated for each bin as (proviruses oriented the same as the gene-proviruses opposite the gene)/(total proviruses). Dashed lines indicate p values (binomial) >0.05. C and D. Ratios of proviruses per bin for the pre-ART (C) or on-ART (D) samples. Note that the higher the ratio, the smaller the number of IS in the donor samples relative to the in vitro infected PBMC samples. S1 Fig shows the same results with the 100-bin IS data included.
Fig 2
Fig 2. Comparative ranking of genes by integration frequency.
The non-overlapping RefSeq genes were ranked according to the number of unique IS in the PBMC in vitro dataset (blue squares), along with the number of sites in the same genes in the pre-ART (plum triangles) and on-ART (red diamonds) datasets. A. All 20,207 genes in the dataset are shown; a little over half have one or more IS in the in vitro PBMC dataset. Points with no IS have been removed for clarity, and the genes with no IS in PBMC are assigned a rank at random. The inset shows an expanded view of the 30 genes with the most IS. The top 10 are labeled, as is STAT5B (number 28). B. Expanded view of the 2500 genes (indicated by the box in A) with the most IS. The 7 genes in which an integrated provirus directly contributes to persistence and/or clonal expansion of the infected cell are circled and labeled. Some pre-ART points are indicated with arrows for clarity. C. Venn diagram showing the genes with at least one IS in the three datasets, and how those genes are shared among the datasets. Numbers indicate the number of genes in each category.
Fig 3
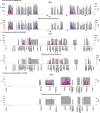
Fig 3. Analysis of IS in MKL2.
Using the Excel-based application described in S2 Fig, a selected region of the genome of any size is divided into 250 bins. The IS in each bin are tabulated and the number of IS in the bin is shown as a bar, with the orientation of the provirus relative to the numbering of the chromosome indicated by color (red for the same as the chromosome and blue for the opposite). The grey boxes indicate the location and relative RNA level of the genes in each bin. RefSeq genes (from the hg19 sequence database) are shown at the bottom of each plot, with arrows indicating their orientation relative to the numbering of the chromosome. The figure shows the distribution of genes and IS on chromosome 16 at 3 different scales. In all panels, the top image shows the distribution of IS from PBMC infected in vitro; the bottom, the distribution of the unique IS data from on-ART donors. A. Entire chromosome 16 (ca 353,000 bp/bin); the arrow shows the region in which IS are enriched in the on-ART samples. The box shows the region enlarged in panel B. Because <10% of the 824 genes could be accommodated on the X-axis, chromosomal position is shown instead. B. A 10Mb region of chromosome 16, (40 kb/bin) centered on MKL2. Again, the box indicates the region expanded in panel C. C. A 2 Mb region of chromosome 16 (8 kb/bin) centered on MKL2. The boxed region is expanded in Fig 4A.
Fig 4
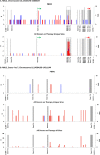
Fig 4. IS in MKL2 A.
The complete MKL2 gene (308 bp/bin). The gray bars show the position of exons, with their height indicating the expression level of the gene in TPM, as in Fig 3. The protein coding region is indicated by the colored arrows above the maps. The boxed region is enlarged in panel B. B. Cluster of MKL2 IS on-ART in introns 4–6 (50bp/bin). Top, in vitro PBMC IS; middle, on ART unique sites; bottom on-ART, all sites.
Fig 5
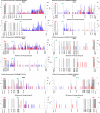
Fig 5. HIV IS in other genes in which proviruses can give the host cell a selective advantage.
Maps were generated for each of the genes in Table 3 as described in Fig 4. For each pair of panels, the map at the top shows the IS distribution for the PBMC infected in vitro, and the on-ART distribution is at the bottom A. STAT5B (309 bp/bin). B. BACH2 (1.48 kb/bin). C. MKL1 (906 bp/bin). D. MYB (151 bp/bin). E. IL2RB (197 bp/bin) F. POU2F1 (828 kb/bin).
Fig 6
Fig 6. IS distribution, RNA level, and clonal amplification.
The amplification ratio for all integrated proviruses was calculated using (total number of IS)/(number of unique IS). A. Each RefSeq gene in the non-overlapping dataset was assigned to one of 100 bins (ca. 200 genes in each bin) based on the level of RNA for the gene (as TPM in the in vitro infected PBMC), and the overall amplification ratio was calculated for the sites in each bin. Non-expressed genes were assigned to bins at random. The regression lines shown have a slope of 0.0008 and 0.0013 (p = 0.88 an 0.12) for pre-ART and on-ART bins, respectively. B shows the clonal amplification ratios pre-ART and on-ART. Color coding is the same as in previous figures: Plum, pre-ART; red, on-ART.

References

    1. Coffin JM. HIV population dynamics in vivo: implications for genetic variation, pathogenesis, and therapy. Science. 1995;267(5197):483–9. 10.1126/science.7824947 . - DOI - PubMed
    1. Ho DD, Neumann AU, Perelson AS, Chen W, Leonard JM, Markowitz M. Rapid turnover of plasma virions and CD4 lymphocytes in HIV-1 infection. Nature. 1995;373(6510):123–6. Epub 1995/01/12. 10.1038/373123a0 . - DOI - PubMed
    1. Wei X, Ghosh S, Taylor ME, Johnson VA, Emini EA, Deutsch P, et al.. Viral dynamics in human immunodeficiency virus type 1 infection. Nature. 1995;373:117–22. 10.1038/373117a0 - DOI - PubMed
    1. Joos B, Fischer M, Kuster H, Pillai SK, Wong JK, Boni J, et al.. HIV rebounds from latently infected cells, rather than from continuing low-level replication. Proceedings of the National Academy of Sciences of the United States of America. 2008;105(43):16725–30. 10.1073/pnas.0804192105 - DOI - PMC - PubMed
    1. Cohn LB, Chomont N, Deeks SG. The Biology of the HIV-1 Latent Reservoir and Implications for Cure Strategies. Cell Host Microbe. 2020;27(4):519–30. 10.1016/j.chom.2020.03.014 . - DOI - PMC - PubMed

Publication types

MeSH terms