. 2021 Jul 6;186(3):1382-1396.
doi: 10.1093/plphys/kiab162.

Perception of solar UV radiation by plants: photoreceptors and mechanisms

Affiliations

Perception of solar UV radiation by plants: photoreceptors and mechanisms

Neha Rai et al. Plant Physiol. .

Abstract

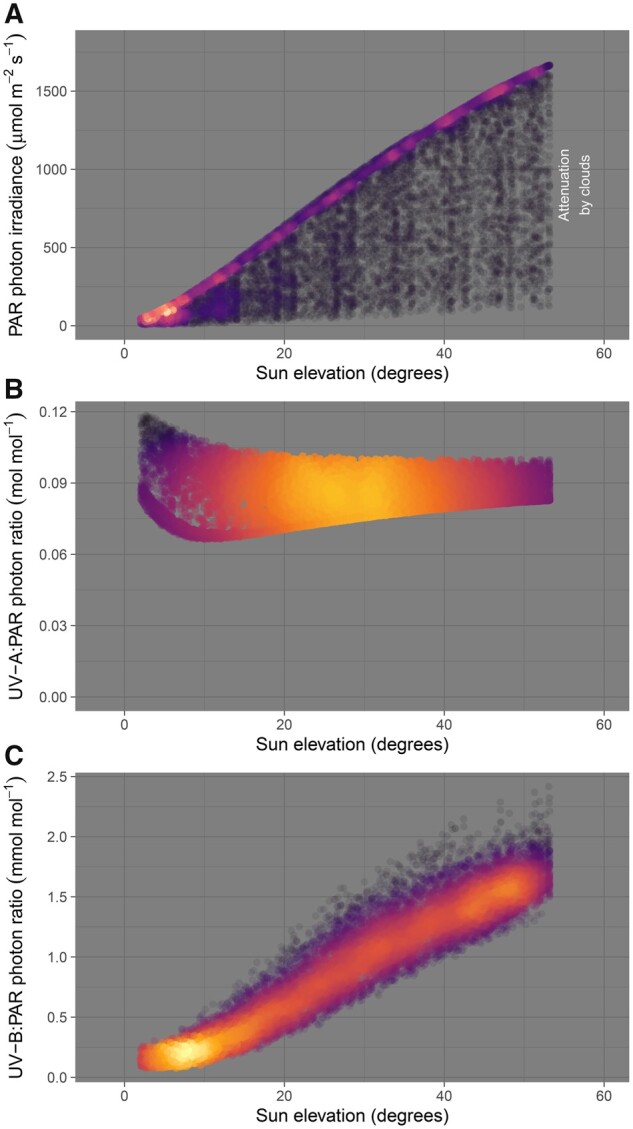
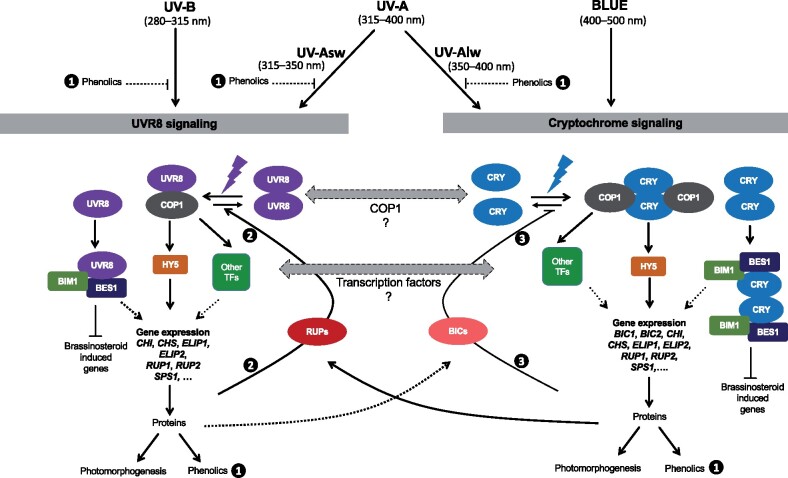
About 95% of the ultraviolet (UV) photons reaching the Earth's surface are UV-A (315-400 nm) photons. Plant responses to UV-A radiation have been less frequently studied than those to UV-B (280-315 nm) radiation. Most previous studies on UV-A radiation have used an unrealistic balance between UV-A, UV-B, and photosynthetically active radiation (PAR). Consequently, results from these studies are difficult to interpret from an ecological perspective, leaving an important gap in our understanding of the perception of solar UV radiation by plants. Previously, it was assumed UV-A/blue photoreceptors, cryptochromes and phototropins mediated photomorphogenic responses to UV-A radiation and "UV-B photoreceptor" UV RESISTANCE LOCUS 8 (UVR8) to UV-B radiation. However, our understanding of how UV-A radiation is perceived by plants has recently improved. Experiments using a realistic balance between UV-B, UV-A, and PAR have demonstrated that UVR8 can play a major role in the perception of both UV-B and short-wavelength UV-A (UV-Asw, 315 to ∼350 nm) radiation. These experiments also showed that UVR8 and cryptochromes jointly regulate gene expression through interactions that alter the relative sensitivity to UV-B, UV-A, and blue wavelengths. Negative feedback loops on the action of these photoreceptors can arise from gene expression, signaling crosstalk, and absorption of UV photons by phenolic metabolites. These interactions explain why exposure to blue light modulates photomorphogenic responses to UV-B and UV-Asw radiation. Future studies will need to distinguish between short and long wavelengths of UV-A radiation and to consider UVR8's role as a UV-B/UV-Asw photoreceptor in sunlight.


Figures

Figure 1
Figure 1
Sunlight during five summers at Kumpula, Helsinki (60.20400 N, 24.95811 E). Summaries computed from simulated hourly spectral solar irradiance at ground level are plotted against solar elevation above the horizon. A, Photon irradiance of PAR; B, UV-A:PAR photon ratio; C, UV-B:PAR photon ratio. The color indicates the local density of observations, with the “hotter” red to yellow regions mostly corresponding to data for clear-sky conditions and the “cooler” dark points corresponding to different degrees of cloud cover. Original data consist in 11,759 hourly simulations for sun elevation angles higher than 3–7 degrees at the center of the hour, for the period 1 May to 30 September of years 2013–2017, produced by Anders V. Lindfors with a radiation transfer model (libradtran) (Lindfors et al., 2009; Emde et al., 2016).
Figure 2
Figure 2
Transcript abundance after 6 h exposure to filtered sunlight in three genotypes of Arabidopsis plants. A separate pie chart for each genotype shows the percentage of differentially expressed genes responding uniquely to UV-B radiation (orange), uniquely to UV-A radiation (green), and common to both UV-B and UV-A radiation (yellow). A–C, responding uniquely to short-wavelength UV-A (UV-Asw) radiation (red), uniquely to long-wavelength UV-A (UV-Alw) radiation (light blue), and common to both UV-Asw and UV-Alw radiation (dark blue). D–F, Figure based on the transcriptome analysis of Rai et al. (2020).
Figure 3
Figure 3
Solar UV radiation at different solar elevations and corresponding estimates of absorbed photons by photoreceptor UV RESISTANCE LOCUS 8 (UVR8) molecules. Panels (A)–(D) show modeled solar spectrum for clear sky conditions and sun elevation angles (h) of 90, 60, 30, and 15 degrees. Panels (E)–(H) show result from convolution of the spectra in (A)–(D) with the in vitro absorbance spectrum of the UVR8 protein (Rai et al., 2020, Supplemental Figure S7) predicting that UVR8 will absorb both UV-B and UV-A radiation in sunlight. The solar spectrum was simulated with the Quick TUV simulator for a depth of the ozone layer of 300 DU. Computations and plotting were done in R (R Core Team, 2020) with packages from the R for photobiology suite (Aphalo, 2015) and the tidyverse (Wickham et al., 2019). UV-Asw: short wavelength UV-A, UV-Alw: long wavelength UV-A.
Figure 4
Figure 4
Comparison of published action spectra for UV RESISTANCE LOCUS 8 (UVR8)-mediated expression of the gene ELONGATED HYPOCOTYL 5 (HY5) (Brown et al., 2009; Díaz-Ramos et al., 2018) to the published absorption spectrum of UVR8 (Rai et al., 2020). High and low refer to action spectra computed for different levels of monomerization, as reported in the original publications. All spectra are normalized to one at 300 nm.
Figure 5
Figure 5
A model combining different hypotheses for coaction downstream of UV RESISTANCE LOCUS 8 (UVR8) and cryptochromes 1 and 2 (CRYs) in UV responses and possible modulation by other wavelengths. We postulate a first level of interaction through CONSTITUTIVELY PHOTOMORPHOGENIC 1 (COP1) as both UVR8 and CRYs physically interact with COP1, second level through shared TFs (e.g. ELONGATED HYPOCOTYL 5 [HY5], BRI1-EMS-SUPPRESSOR1 [BES1], BES1-INTERACTING MYC-LIKE 1 [BIM1], note that both UVR8 and CRYs physically interact with BES1 and BIM1*), and a third level through REPRESSOR OF UV-B PHOTOMORPHOGENESIS 1 (RUP1) and RUP2, and BLUE-LIGHT INHIBITOR OF CRYPTOCHROMES 1 (BIC1) and BIC2. The complete arrows show paths supported by experimental evidence while the dotted arrows show hypothetical mechanisms that are compatible with current knowledge. Numbers 1–3 refer to the negative feedback loops described in Box 2. CHI: CHALCONE ISOMERASE, CHS: CHALCONE SYNTHASE, ELIP 1: EARLY LIGHT-INDUCED PROTEIN 1, ELIP2: EARLY LIGHT-INDUCED PROTEIN 2, SPS1: SOLANESYL DIPHOSPHATE SYNTHASE 1 (* not shown in the model).

References

    1. Aphalo PJ, Albert A, McLeod AR, Heikkilä A, Gómez I, López Figueroa F, Robson TM, Strid Å (2012) Manipulating UV radiation. InAphalo PJ, Albert A, Björn LO, McLeod AR, Robson TM, Rosenqvist E, eds, Beyond the Visible: A Handbook of Best Practice in Plant UV Photobiology , Ed 1,University of Helsinki, Department of Biosciences, Division of Plant Biology, pp 35–70
    1. Aphalo PJ (2015) The r4photobiology suite: spectral irradiance. UV4Plants Bull 1:21–29
    1. Ballaré CL (2014) Light regulation of plant defense. Annu Rev Plant Biol 65:335–363 - PubMed
    1. Ballaré CL, Pierik R (2017) The shade-avoidance syndrome: Multiple signals and ecological consequences. Plant Cell Environ 40:2530–2543 - PubMed
    1. Banerjee R, Schleicher E, Meier S, Viana RM, Pokorny R, Ahmad M, Bittl R, Batschauer A (2007) The signaling state of Arabidopsis cryptochrome 2 contains flavin semiquinone. J Biol Chem 282:14916–14922 - PubMed

Publication types