. 2021 Jun 21;60(26):14578-14585.
doi: 10.1002/anie.202103010. Epub 2021 May 19.

XFEL Crystal Structures of Peroxidase Compound II

Affiliations

XFEL Crystal Structures of Peroxidase Compound II

Hanna Kwon et al. Angew Chem Int Ed Engl. .

Abstract

Oxygen activation in all heme enzymes requires the formation of high oxidation states of iron, usually referred to as ferryl heme. There are two known intermediates: Compound I and Compound II. The nature of the ferryl heme-and whether it is an FeIV =O or FeIV -OH species-is important for controlling reactivity across groups of heme enzymes. The most recent evidence for Compound I indicates that the ferryl heme is an unprotonated FeIV =O species. For Compound II, the nature of the ferryl heme is not unambiguously established. Here, we report 1.06 Å and 1.50 Å crystal structures for Compound II intermediates in cytochrome c peroxidase (CcP) and ascorbate peroxidase (APX), collected using the X-ray free electron laser at SACLA. The structures reveal differences between the two peroxidases. The iron-oxygen bond length in CcP (1.76 Å) is notably shorter than in APX (1.87 Å). The results indicate that the ferryl species is finely tuned across Compound I and Compound II species in closely related peroxidase enzymes. We propose that this fine-tuning is linked to the functional need for proton delivery to the heme.

Keywords: heme; heme proteins; peroxidase.


Conflict of interest statement

The authors declare no conflict of interest.

Figures

Figure 1
Figure 1
Formation of Compound II in CcP monitored by stopped‐flow. A) Formation of ferrous CcP: Ferric CcP (6 μM) was mixed with 2–3 equivalents of dithionite and spectra monitored over 10 s. The dashed line is the first species observed after mixing and represents the ferric enzyme, and the solid line represents the ferrous spectrum which was completely formed within 10 s of the mixing event. Absorbance values in the visible region have been multiplied by a factor of three. Conditions: 10 mM potassium phosphate, 150 mM KCl pH 6.5, 25.0 °C. This ferrous species was stable for at least 15 minutes at room temperature, after which time it decayed back to ferric. B) Formation of CcP Compound II: In a sequential mixing experiment ferric CcP (6 μM) was premixed with a stoichiometric amount of dithionite for 10 s (to enable complete formation of ferrous CcP) then H2O2 (5 equivalents) was added and spectral changes were monitored over 10 s. The dashed line is the first species observed after mixing and represents the ferrous species (at t=1 ms); this spectrum (λ max=439, 558, 590sh nm) is similar to the spectrum of the ferrous enzyme formed in the single mix experiments in (A). The solid line after reaction with H2O2 is assigned as a Compound II species (λ max=420, 530, 560 nm). Over longer timescales (≈500 s), this Compound II species was observed to decay slowly (k obs≈0.004 s−1) back to a ferric‐like species (Figure S1).
Figure 2
Figure 2
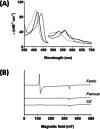
Formation of Compound II in CcP monitored by EPR. A) Absorption spectra of ferric, ferrous and Compound II forms of CcP used for EPR analysis: Ferric CcP (250 μM, dotted line) was reacted with 5–10 equivalents of dithionite to produce ferrous CcP (dashed line); Compound II (black solid line) was prepared by reaction of ferrous protein with 10 equivalents of H2O2. All spectra were recorded immediately after mixing and prior to flash freezing. Absorbance values in the visible region have been multiplied by a factor of three. Conditions: 10 mM potassium phosphate, 150 mM KCl pH 6.5, 25.0 °C. B) EPR spectra −9 GHz EPR spectra of the corresponding solutions from the experiments in (A) of the ferric (top spectrum), ferrous (middle spectrum) and Compound II (bottom spectrum) derivatives of CcP prepared by reaction of ferrous CcP with 10 equivalents of H2O2 and flash frozen immediately after mixing (see Experimental Section in the Supporting Information).
Figure 3
Figure 3
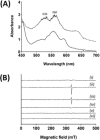
Formation of Compound II of CcP in crystals. A) Single crystal UV‐visible spectra (100 K) of crystals formed by reaction with dithionite (to give ferrous CcP, solid line), followed by reaction with 0.2 mM H2O2 (to give Compound II, dashed line). B) 9 GHz EPR spectra of single crystals of CcP. (i) Ferric CcP. (ii) Compound I formed by reaction of a ferric crystal with 0.2 mM H2O2. (iii) After storage of the crystal in (ii) for 20 days in liquid nitrogen; (iv) Compound II formed by reaction with dithionite and H2O2 as in (A). (v) After storage of the sample in (iv) for 20 days in liquid nitrogen; (vi) Background.
Figure 4
Figure 4
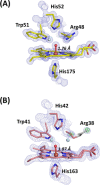
XFEL crystal structures of Compound II. A) CcP Compound II: Electron density of CcP Compound II is shown in blue (contoured at 2.0 σ). The O atom is positioned at 1.76 Å from the heme iron. Oxygen atoms of water molecules are shown in light blue, and the ferryl oxygen is shown in red (to differentiate it from water). B) APX Compound II: Electron density of APX Compound II is shown in blue (contoured at 2.0 σ). The difference density calculated by omitting Arg 38 is shown in green (contoured at 3 σ). Note the weak density beyond the Cδ of the side chain for Arg 38 (shown at 1.2 σ). Atoms of Arg38 are shown in grey where the atomic positions are unclearly defined. The ferryl O atom is positioned at 1.87 Å from the heme iron. Oxygen atoms of water molecules are shown in light blue, and the ferryl oxygen is shown in red, as for (A).
Figure 5
Figure 5
Hydrogen bonding in the active site. A) Electron density of CcP Compound II is shown in blue (contoured at 2.0σ). The difference density calculated by omitting hydrogens is shown in green (contoured at 3σ). The O atom is positioned at 1.76 Å from the heme iron. Water is shown in light blue color. B) Hydrogen bonding patterns for Compound II in CcP. C) Hydrogen bonding patterns for Compound II in APX showing Arg38 in two different locations: the “out” (left, as in Figure 4 B top) and “in” (right) positions. Waters are shown in light blue, and swap interchangeably as Arg38 moves between the two locations. Note that in the “out” position, Arg38 is hydrogen bonded to the water molecule through the Nη, and not as previously [14] through the adjacent Nϵ. The ferryl oxygen is shown in red and hydrogen bonds are in dotted lines in all figures.
Figure 6
Figure 6
Comparison of Fe−O bond lengths obtained for various ferric (A) and ferryl (B) inorganic structures in the Cambridge Structure Database, alongside those for Compound I and Compound II protein structures (C, D). Photoreduction is not a complicating factor in small‐molecule crystal structures. A) Plot showing Fe−O bond lengths for complexes of iron in the ferric oxidation state in the Cambridge Structure Database. The plot shows only ferric structures with hydroxide (OH, highlighted in red circles) or water (H2O, black) as a ligand to the iron. Not shown in this plot, are structures for a FeIII=O species (Fe‐O=1.81 Å [35] ). The majority (all but three) of the FeIII‐OH structures in the CSD lie in the range 1.8–1.9 Å. B) The equivalent plot for complexes of iron in the ferryl oxidation state, in the Cambridge Structure Database. All structures are assigned as FeIV=O species, with the exception one structure which is assigned as FeIV‐OH (red circle [27] ). Exact bonds lengths for each of the individual FeIV species are given in the SI. C) Fe−O bond lengths obtained from crystal structures of Compound I (see also Table S2). D) The same as (C), but for Compound II (see also Table S2).

References

    1. None
    1. Groves J. T., J. Inorg. Biochem. 2006, 100, 434–447; - PubMed
    1. Moody P. C. E., Raven E. L., Acc. Chem. Res. 2018, 51, 427–435. - PubMed
    1. None
    1. Keilin D., Mann T., Proc. R. Soc. London Ser. B 1937, 122, 119–133;

Publication types

LinkOut - more resources