. 2021 Apr 6;35(1):108954.
doi: 10.1016/j.celrep.2021.108954.

High-fidelity estimates of spikes and subthreshold waveforms from 1-photon voltage imaging in vivo

Affiliations

High-fidelity estimates of spikes and subthreshold waveforms from 1-photon voltage imaging in vivo

Michael E Xie et al. Cell Rep. .

Abstract

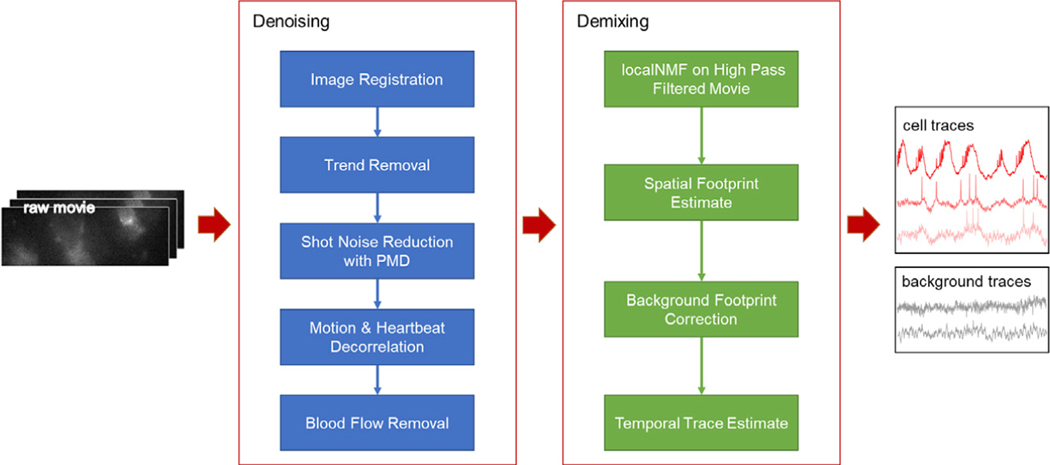
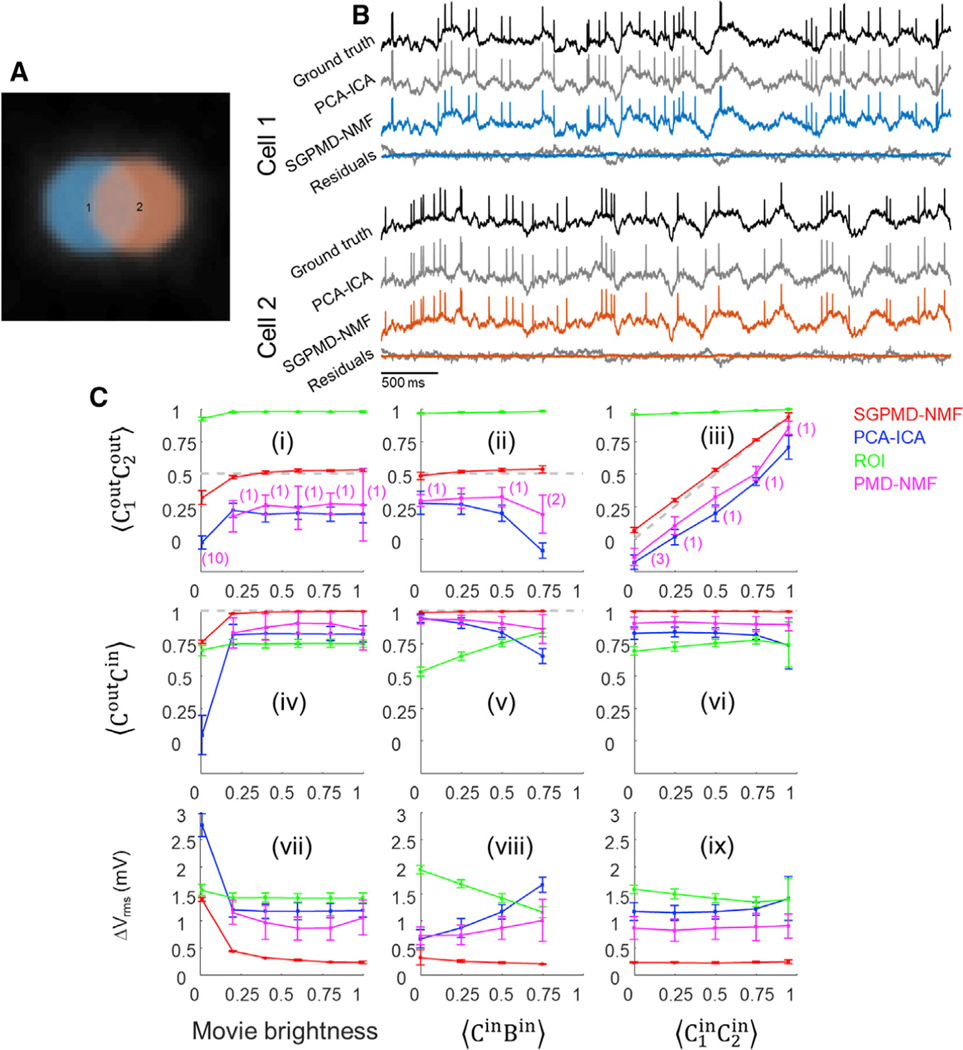
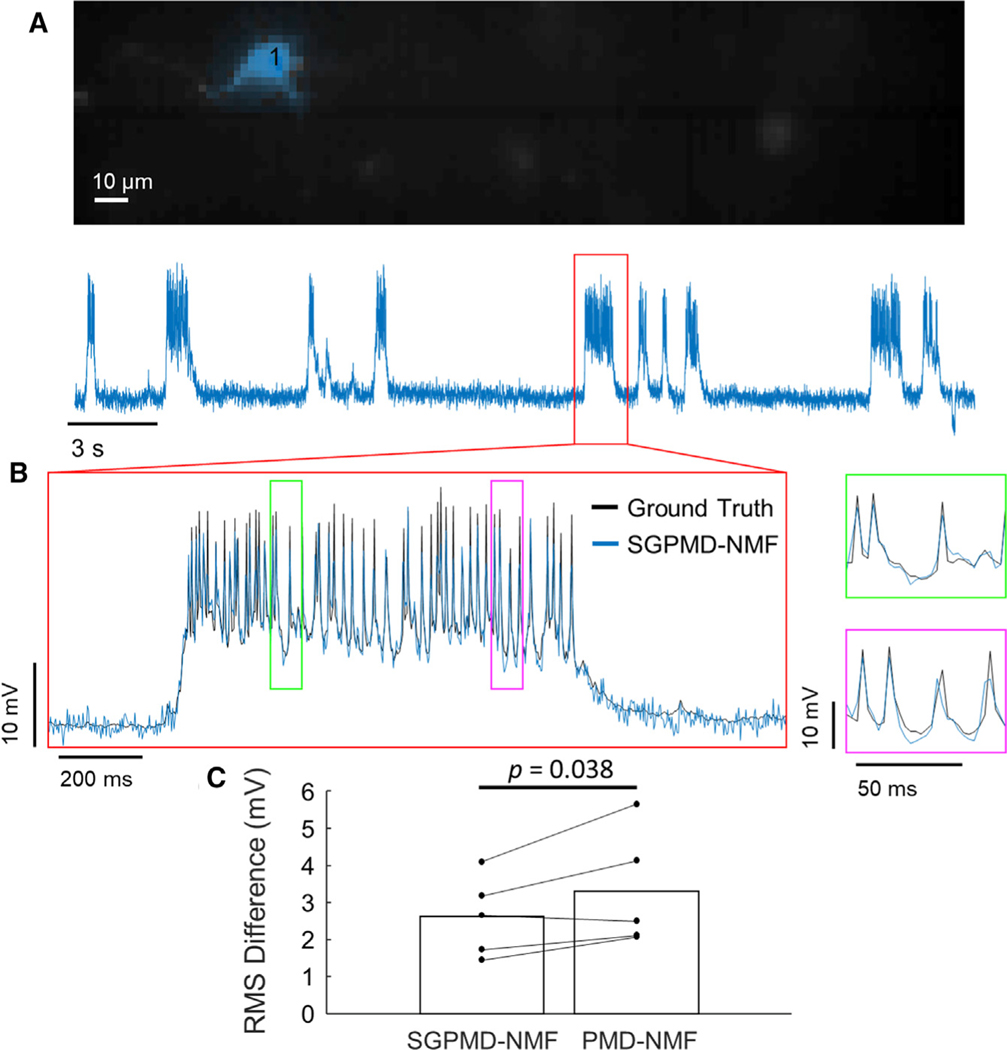
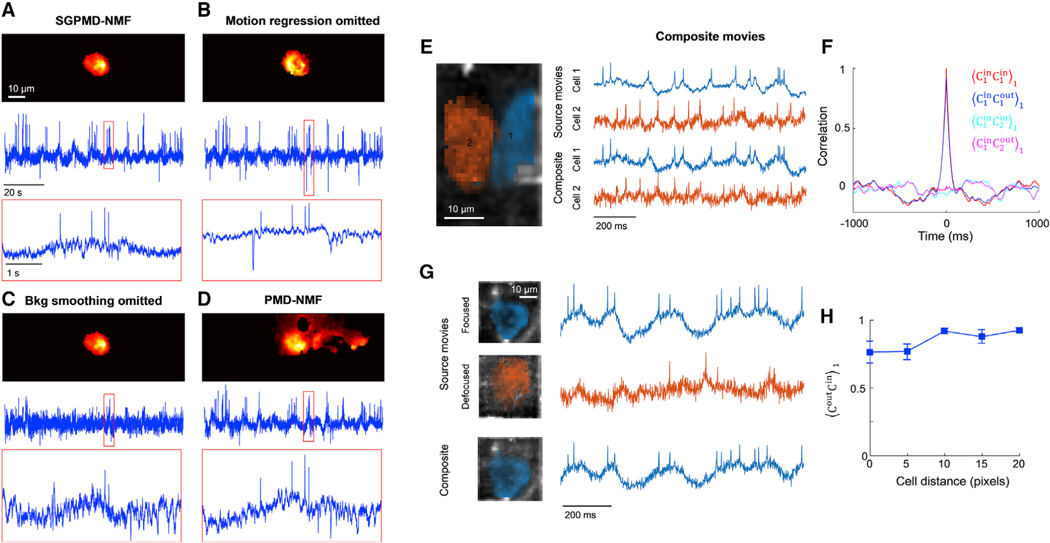
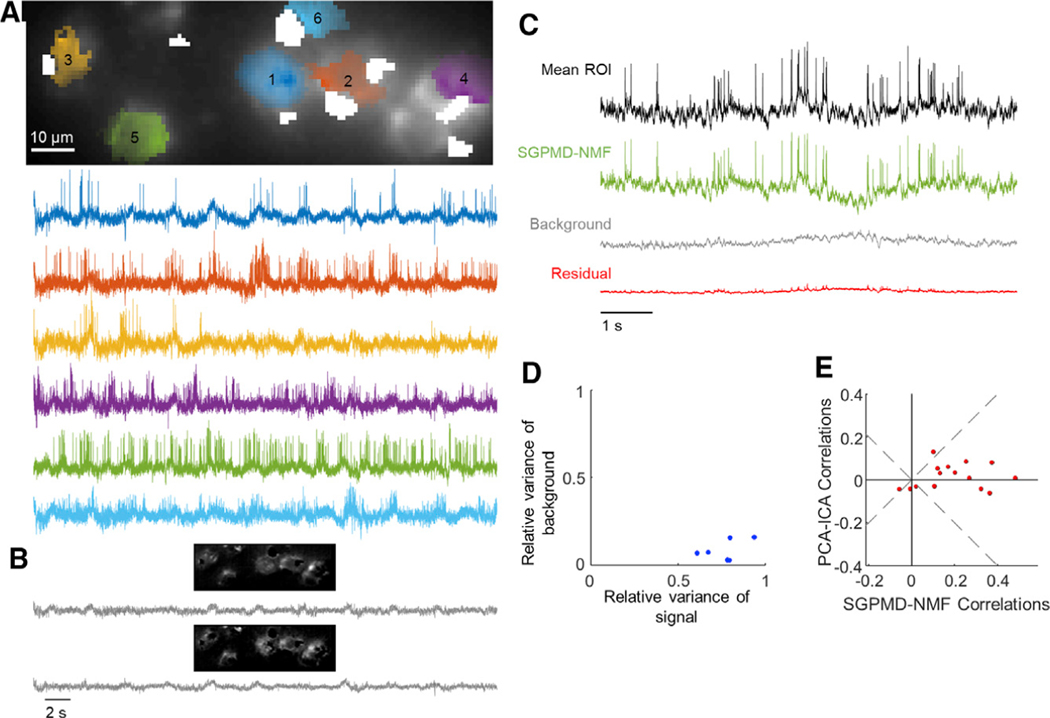
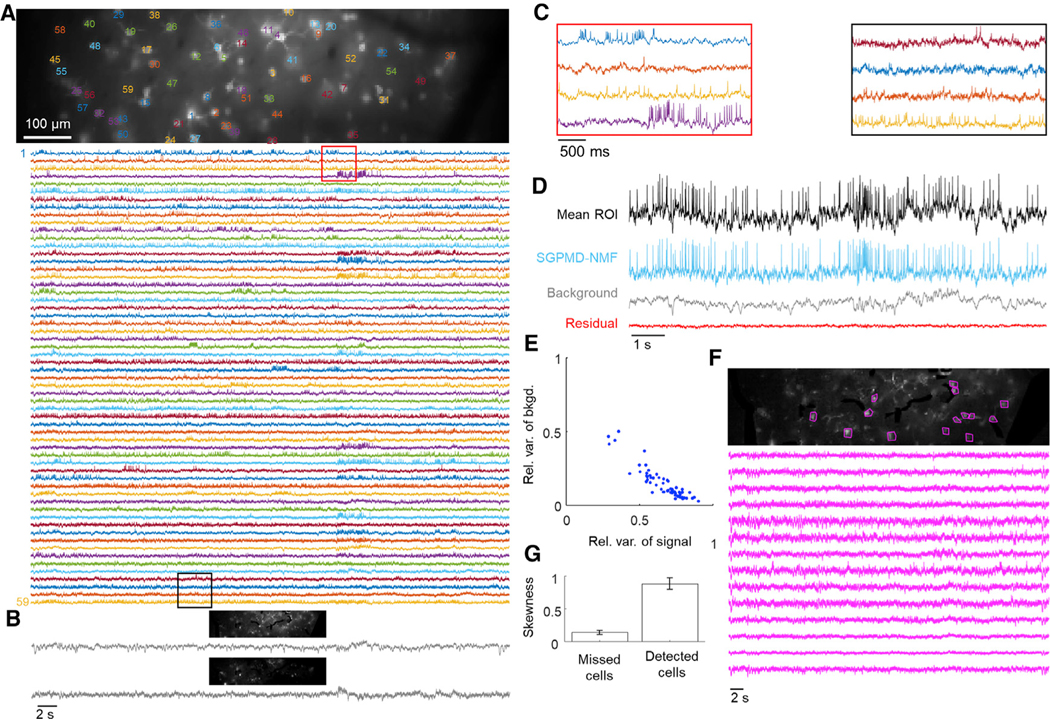
The ability to probe the membrane potential of multiple genetically defined neurons simultaneously would have a profound impact on neuroscience research. Genetically encoded voltage indicators are a promising tool for this purpose, and recent developments have achieved a high signal-to-noise ratio in vivo with 1-photon fluorescence imaging. However, these recordings exhibit several sources of noise and signal extraction remains a challenge. We present an improved signal extraction pipeline, spike-guided penalized matrix decomposition-nonnegative matrix factorization (SGPMD-NMF), which resolves supra- and subthreshold voltages in vivo. The method incorporates biophysical and optical constraints. We validate the pipeline with simultaneous patch-clamp and optical recordings from mouse layer 1 in vivo and with simulated and composite datasets with realistic noise. We demonstrate applications to mouse hippocampus expressing paQuasAr3-s or SomArchon1, mouse cortex expressing SomArchon1 or Voltron, and zebrafish spines expressing zArchon1.

Keywords: signal extraction; voltage imaging.


Conflict of interest statement

Declaration of interests A.E.C. is a co-founder of Q-State Biosciences. The other authors declare no competing interests.

Figures

Figure 1.
Figure 1.. Pipeline for denoising and demixing in vivo voltage imaging data
The denoising steps (blue) comprise a set of distinct corrections for the sources of statistical noise and systematic artifacts that can arise in vivo. The demixing steps (green) use action potentials to identify the cell footprints and the differing spatial profiles of in-focus versus out-of-focus sources to apportion subthreshold dynamics between cells and background.
Figure 2.
Figure 2.. Validation of the SGPMD-NMF algorithm on simulated data
(A) Example field of view comprising two simulated cells with spatial overlap and correlated subthreshold dynamics and a broad background whose dynamics were also correlated with each of the cells. (B) Comparison of signal extraction via PCA-ICA versus SGPMD-NMF. The signals extracted via SGPMD-NMF were substantially closer to the ground truth than were the signals extracted via PCA-ICA. (C) Quantification (mean ± SD) of SGPMD-NMF performance as a function of signal characteristics compared with PCA-ICA, ROI average, and PMD-NMF. Here XY is the cross-correlation of X and Y, C1 and C2 are the signals of the two cells, and B is the background. When subscripts are omitted, the calculation is averaged over both cells. Superscripts ‘‘in’’ and ‘‘out’’ refer to the ground truth voltage input and the extracted fluorescence output, respectively. ΔVrms is the root-meansquare voltage difference between extracted signal and ground truth voltage (lower values indicate better performance). In (i), (ii), (iv), (v), (vii), and (viii), CinCin=0.5 (gray dashed line; closer proximity to this line indicates better performance). In (ii), (iii), (v), (vi), (viii), and (ix), movie brightness = 1. In a few trials, PMD-NMF failed to converge and the results were omitted. The number of such trials is listed in the first row in parentheses and applies to plots in the second and third rows.
Figure 3.
Figure 3.. Validation of SGPMD-NMF with in vivo electrophysiology
(A) Spatial footprint (top) and signal (bottom) extracted from an in vivo voltage imaging recording (mouse cortex L1 expressing Voltron) with simultaneous patch clamp. (B) Inset of signal shown in (A) with patch-clamp ground truth recording overlaid. Further insets are marked in green and magenta and shown to the right. (C) RMS differences between electrophysiological ground truth and voltage imaging signal extracted by SGPMD-NMF (2.6 mV) and PMD-NMF (3.3 mV; mean displayed by bar, n = 5 independent recordings). p = 0.038, paired 1-sided t test.
Figure 4.
Figure 4.. Validation of SGPMD-NMF algorithm against sources with motion, background, and overlapping cells
(A–D) Four analyses of the same recording (mouse hippocampal CA1 pyramidal cells expressing SomArchon1). Top: image of the cell footprint. Middle: extracted fluorescence trace. Bottom: close-up of the fluorescence in the boxed region. (A) Full SGPMD-NMF. (B) SGPMD-NMF with the motion regression step omitted. (C) SGPMD-NMF with the background smoothing step omitted. (D) PMD-NMF. (E) Left: composite movies were formed by adding two separately acquired single-cell movies (mouse hippocampal CA1 oriens interneurons expressing paQuasAr3-s) with a 20-pixel lateral offset between the cells. Right: signals were extracted from the source movies individually and from the composite movie jointly. (F) Temporal cross-correlations of input and output traces showed good fidelity of extracted relative to input traces. Here XY1 is the cross-correlation of X and Y normalized by its value at a lag-1 time step (see STAR Methods for details). Shadings show mean ± SEM over 4 composite movies. (G) Left: second set of composite movies was formed by adding two separately acquired single-cell movies of the same cell (mouse hippocampal CA1 oriens interneurons expressing paQuasAr3-s), one with the cell in focus and one with the cell 20 μm out of focus. The lateral offset between the two cells ranged from 0 pixels to 20 pixels. Right: signals were extracted from the source movies individually and from the composite movie jointly. In the composite movie, only the in-focus cell was extracted as a cell signal, and the out-of-focus cell was treated as background. (H) Correlation of output traces with corresponding input traces as a function of overlap between the two cells. Error bars show mean ± SEM over 4 composite movies.
Figure 5.
Figure 5.. Voltage imaging in the mouse hippocampus CA1 pyramidal cell layer (PCL) using SomArchon1
Cells expressed SomArchon1 and were imaged via micromirror-based, soma-targeted, structured illumination. (A) Top: image of the field of view, showing dense neurons as occurs in the pyramidal cell layer of CA1. The cell footprints are overlaid. Regions contaminated by blood flow are masked in white. Bottom: extracted single-cell traces. Subthreshold depolarizations clearly coincided with elevated spike rates, giving confidence that the subthreshold waveforms reflect membrane potential. (B) Background components from SGPMD-NMF. The two components that explained the most variance in the movie are included, with each component’s spatial profile above the corresponding temporal trace. (C) Average across pixels in cell 5 in the denoised movie (mean ROI), SGPMD-NMF reconstructed signal movie (SGPMD-NMF), reconstructed background movie (background), and residual movie (residual). (D) Scatterplot of the relative variance of each cell background versus signal. (E) Comparison of the pairwise cell-cell cross-correlations between SGPMD-NMF and PCA-ICA. Most (12 of 15) pairwise correlations had a smaller magnitude for PCA-ICA versus SGPMD-NMF.
Figure 6.
Figure 6.. Voltage imaging in mouse cortex L1 using Voltron
Cells expressed Voltron and were imaged via wide-field epifluorescence. (A) Top: image of the field of view. The cells are labeled at the centroid of their footprints. Bottom: extracted single-cell traces. Insets shown in (C) are marked in red and black. (B) Background components from SGPMD-NMF. The two components that explained the most variance in the movie are included, with each component’s spatial profile above the corresponding temporal trace. (C) Inset of eight single-cell traces over a window of approximately 3 s. (D) Average over pixels in cell 6 in the denoised movie (mean ROI), SGPMD-NMF reconstructed signal movie (SGPMD-NMF), reconstructed background movie (background), and residual movie (residual). (E) Scatterplot of the relative variance of each cell background versus signal. Anticorrelation between relative variance of background and signal results because together, background and signal account for >99% of the total variance. If background and signal were uncorrelated, they would fall along the line x + y = 1. Deviations below the line x + y = 1 indicate positive correlation between signal and background. (F) Top: SD image of the reconstructed sum of background and residual. Magenta masks indicate 14 manually selected bright spots, or missed cells. Bottom: mean ROI (on denoised movie) of the 14 missed cells. These traces showed little or no spiking activity. (G) Skewness of temporally high-pass-filtered mean ROI traces (on denoised movie) of the 14 missed cells and 59 detected cells. Skewness provides a measure of spiking activity relative to baseline noise. Error bars show mean ± SEM. The missed cells displayed substantially less spiking activity compared with the detected cells.

References

    1. Abdelfattah AS, Kawashima T, Singh A, Novak O, Liu H, Shuai Y, Huang YC, Campagnola L, Seeman SC, Yu J, et al. (2019). Bright and photostable chemigenetic indicators for extended in vivo voltage imaging. Science 365, 699–704. - PubMed
    1. Adam Y, Kim JJ, Lou S, Zhao Y, Xie ME, Brinks D, Wu H, Mostajo-Radji MA, Kheifets S, Parot V, et al. (2019). Voltage imaging and optogenetics reveal behaviour-dependent changes in hippocampal dynamics. Nature 569, 413–417. - PMC - PubMed
    1. Ahrens MB, Orger MB, Robson DN, Li JM, and Keller PJ (2013). Whole-brain functional imaging at cellular resolution using light-sheet microscopy. Nat. Methods 10, 413–420. - PubMed
    1. Bando Y, Grimm C, Cornejo VH, and Yuste R (2019). Genetic voltage indicators. BMC Biol. 17, 71. - PMC - PubMed
    1. Böhm UL, Xie ME, and Cohen AE (2021). Voltage imaging in zebrafish spinal cord with zArchon1. figshare. 10.6084/m9.figshare.14153339.v1. - DOI

Publication types

LinkOut - more resources