. 2021 Apr 6;35(1):108948.
doi: 10.1016/j.celrep.2021.108948.

Fascin inhibitor increases intratumoral dendritic cell activation and anti-cancer immunity

Affiliations

Fascin inhibitor increases intratumoral dendritic cell activation and anti-cancer immunity

Yufeng Wang et al. Cell Rep. .

Abstract

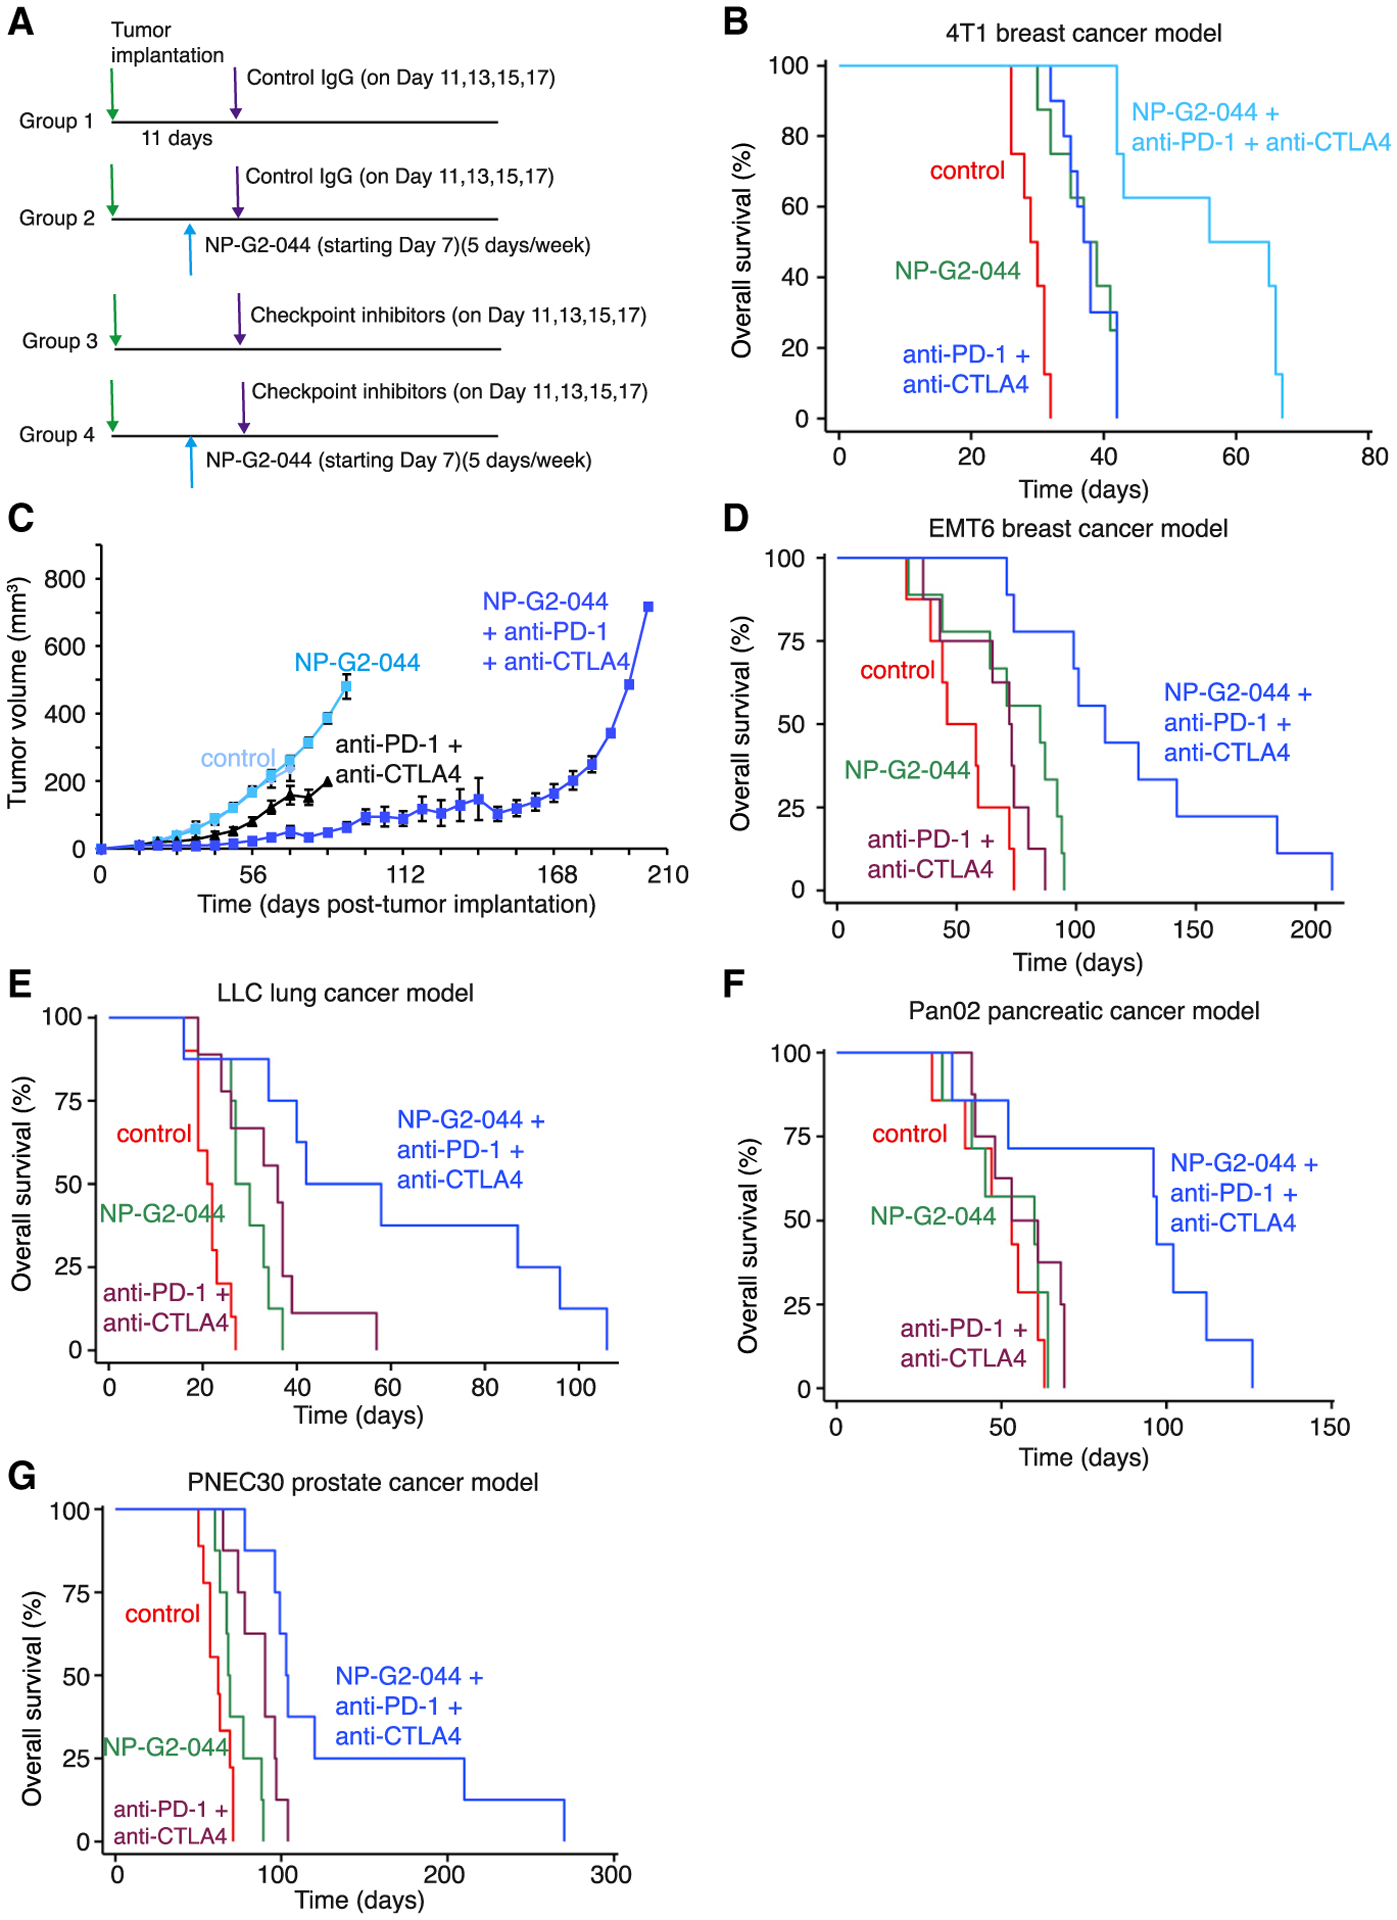
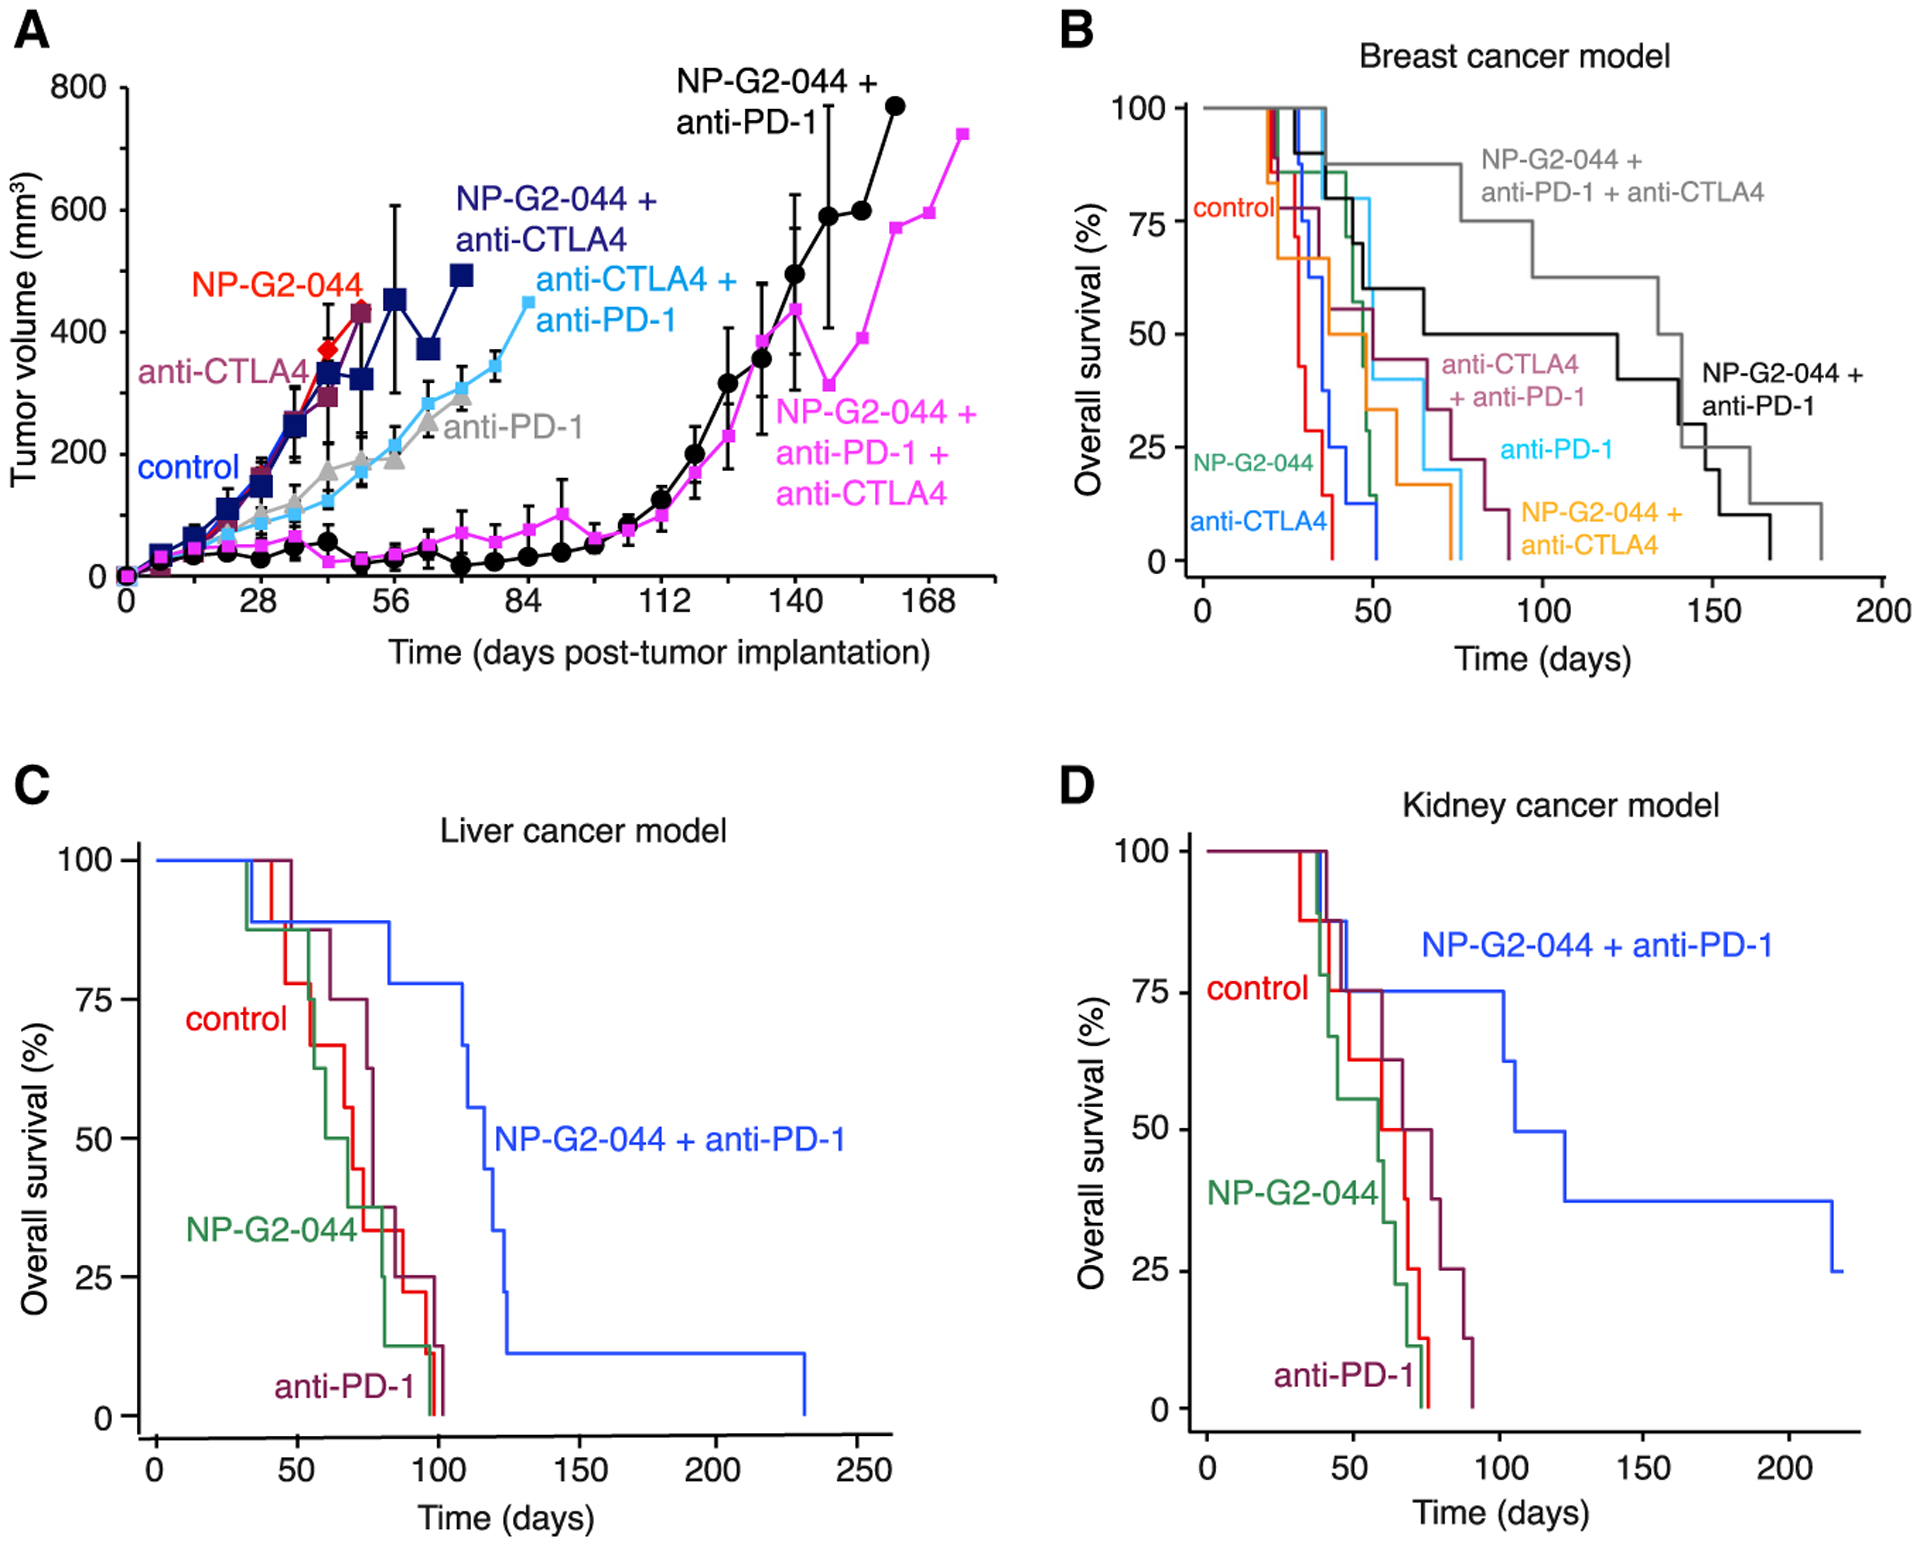
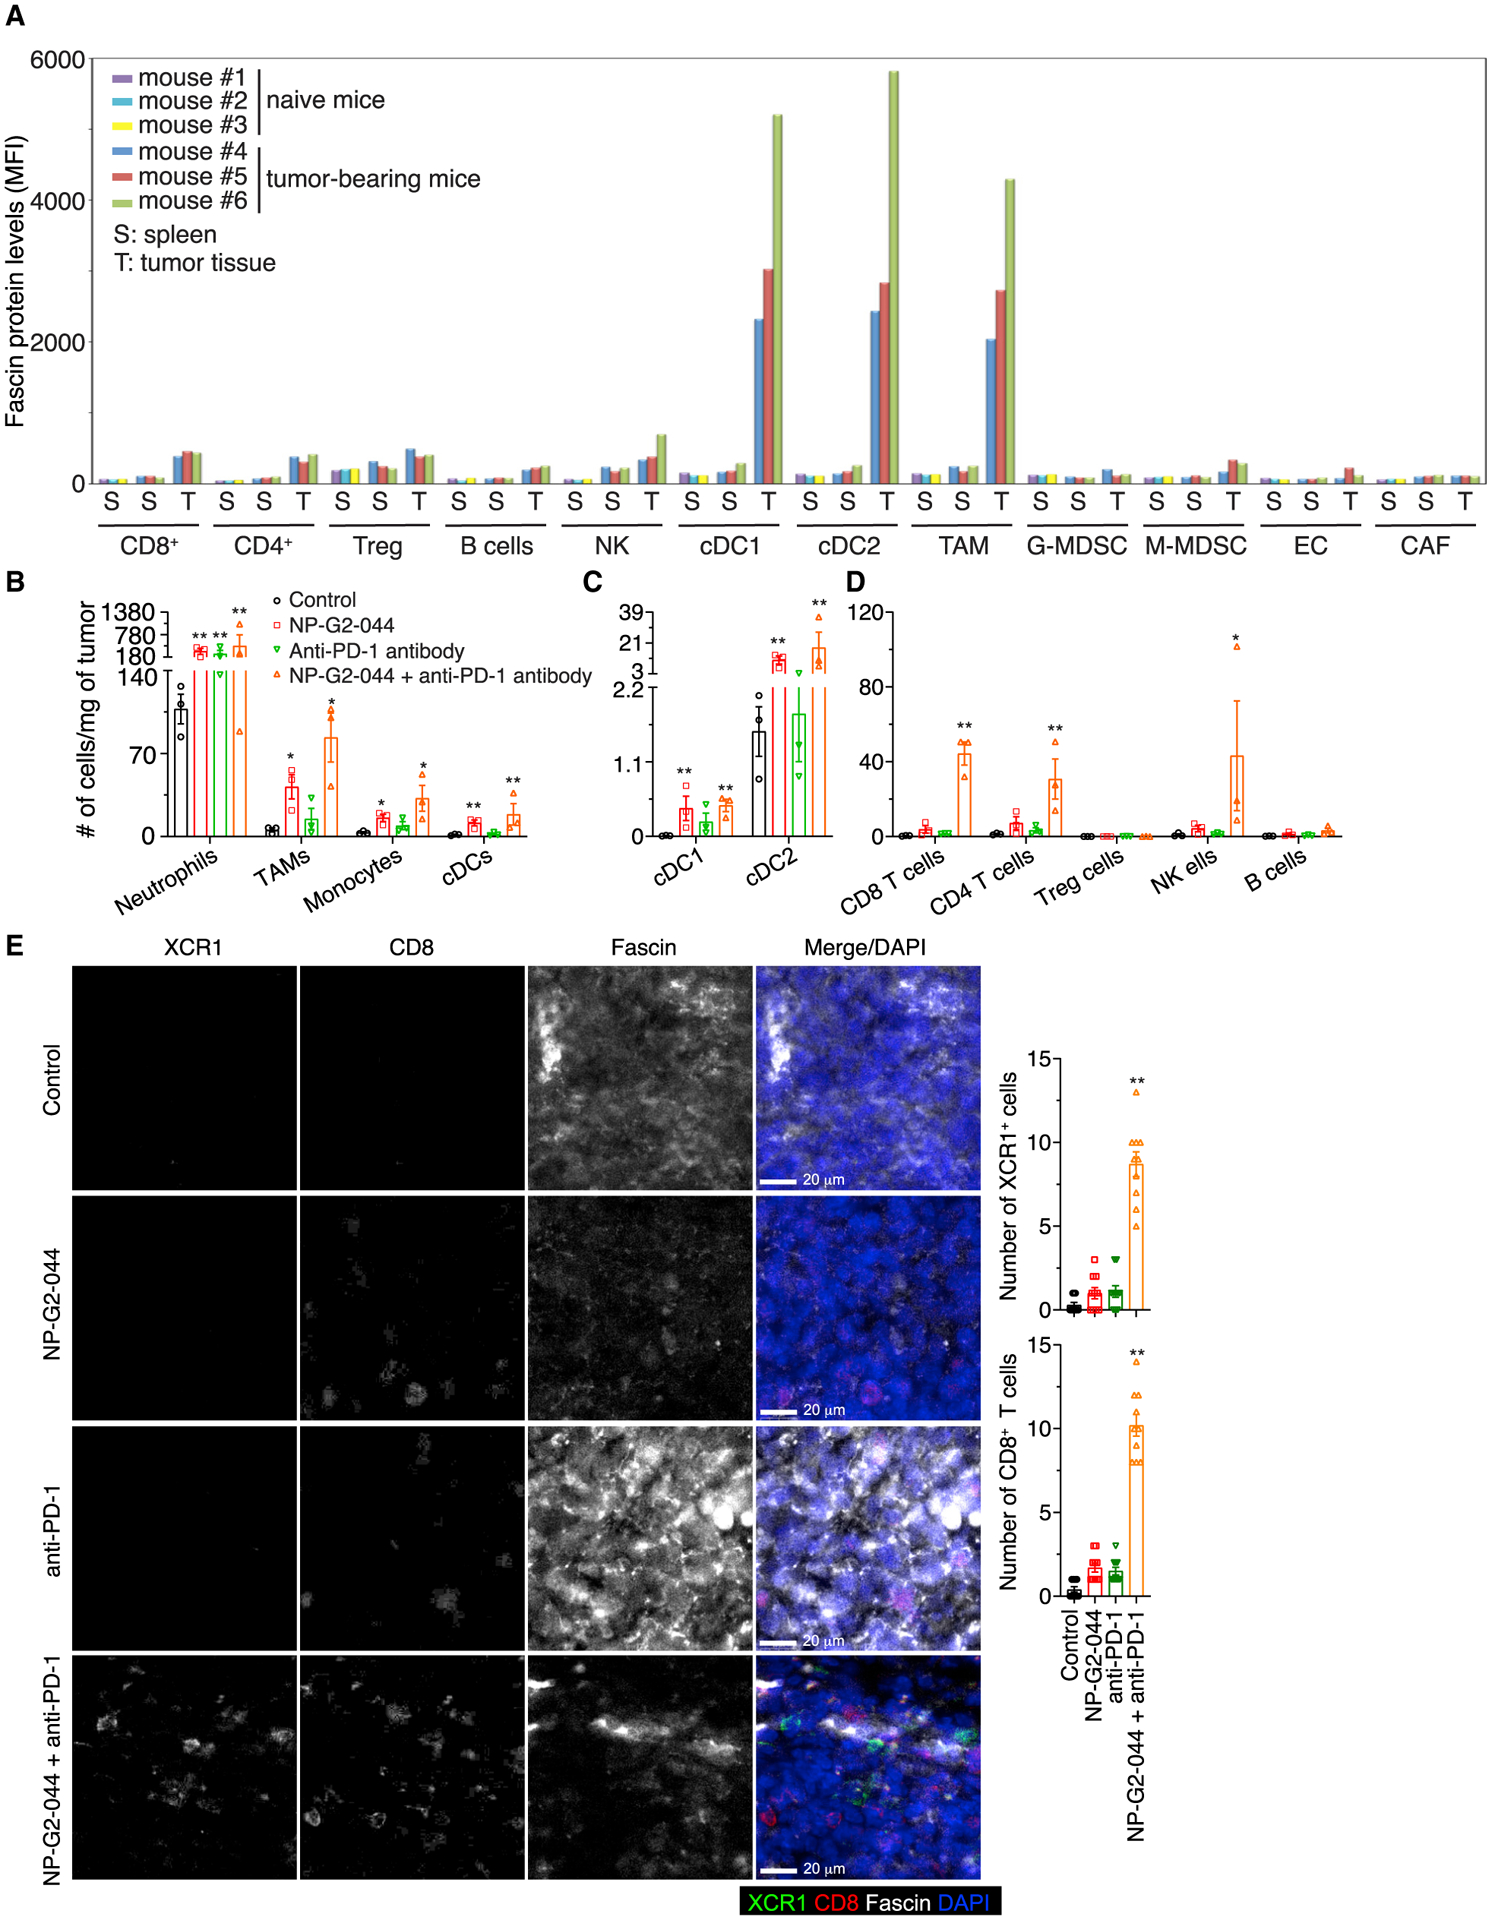
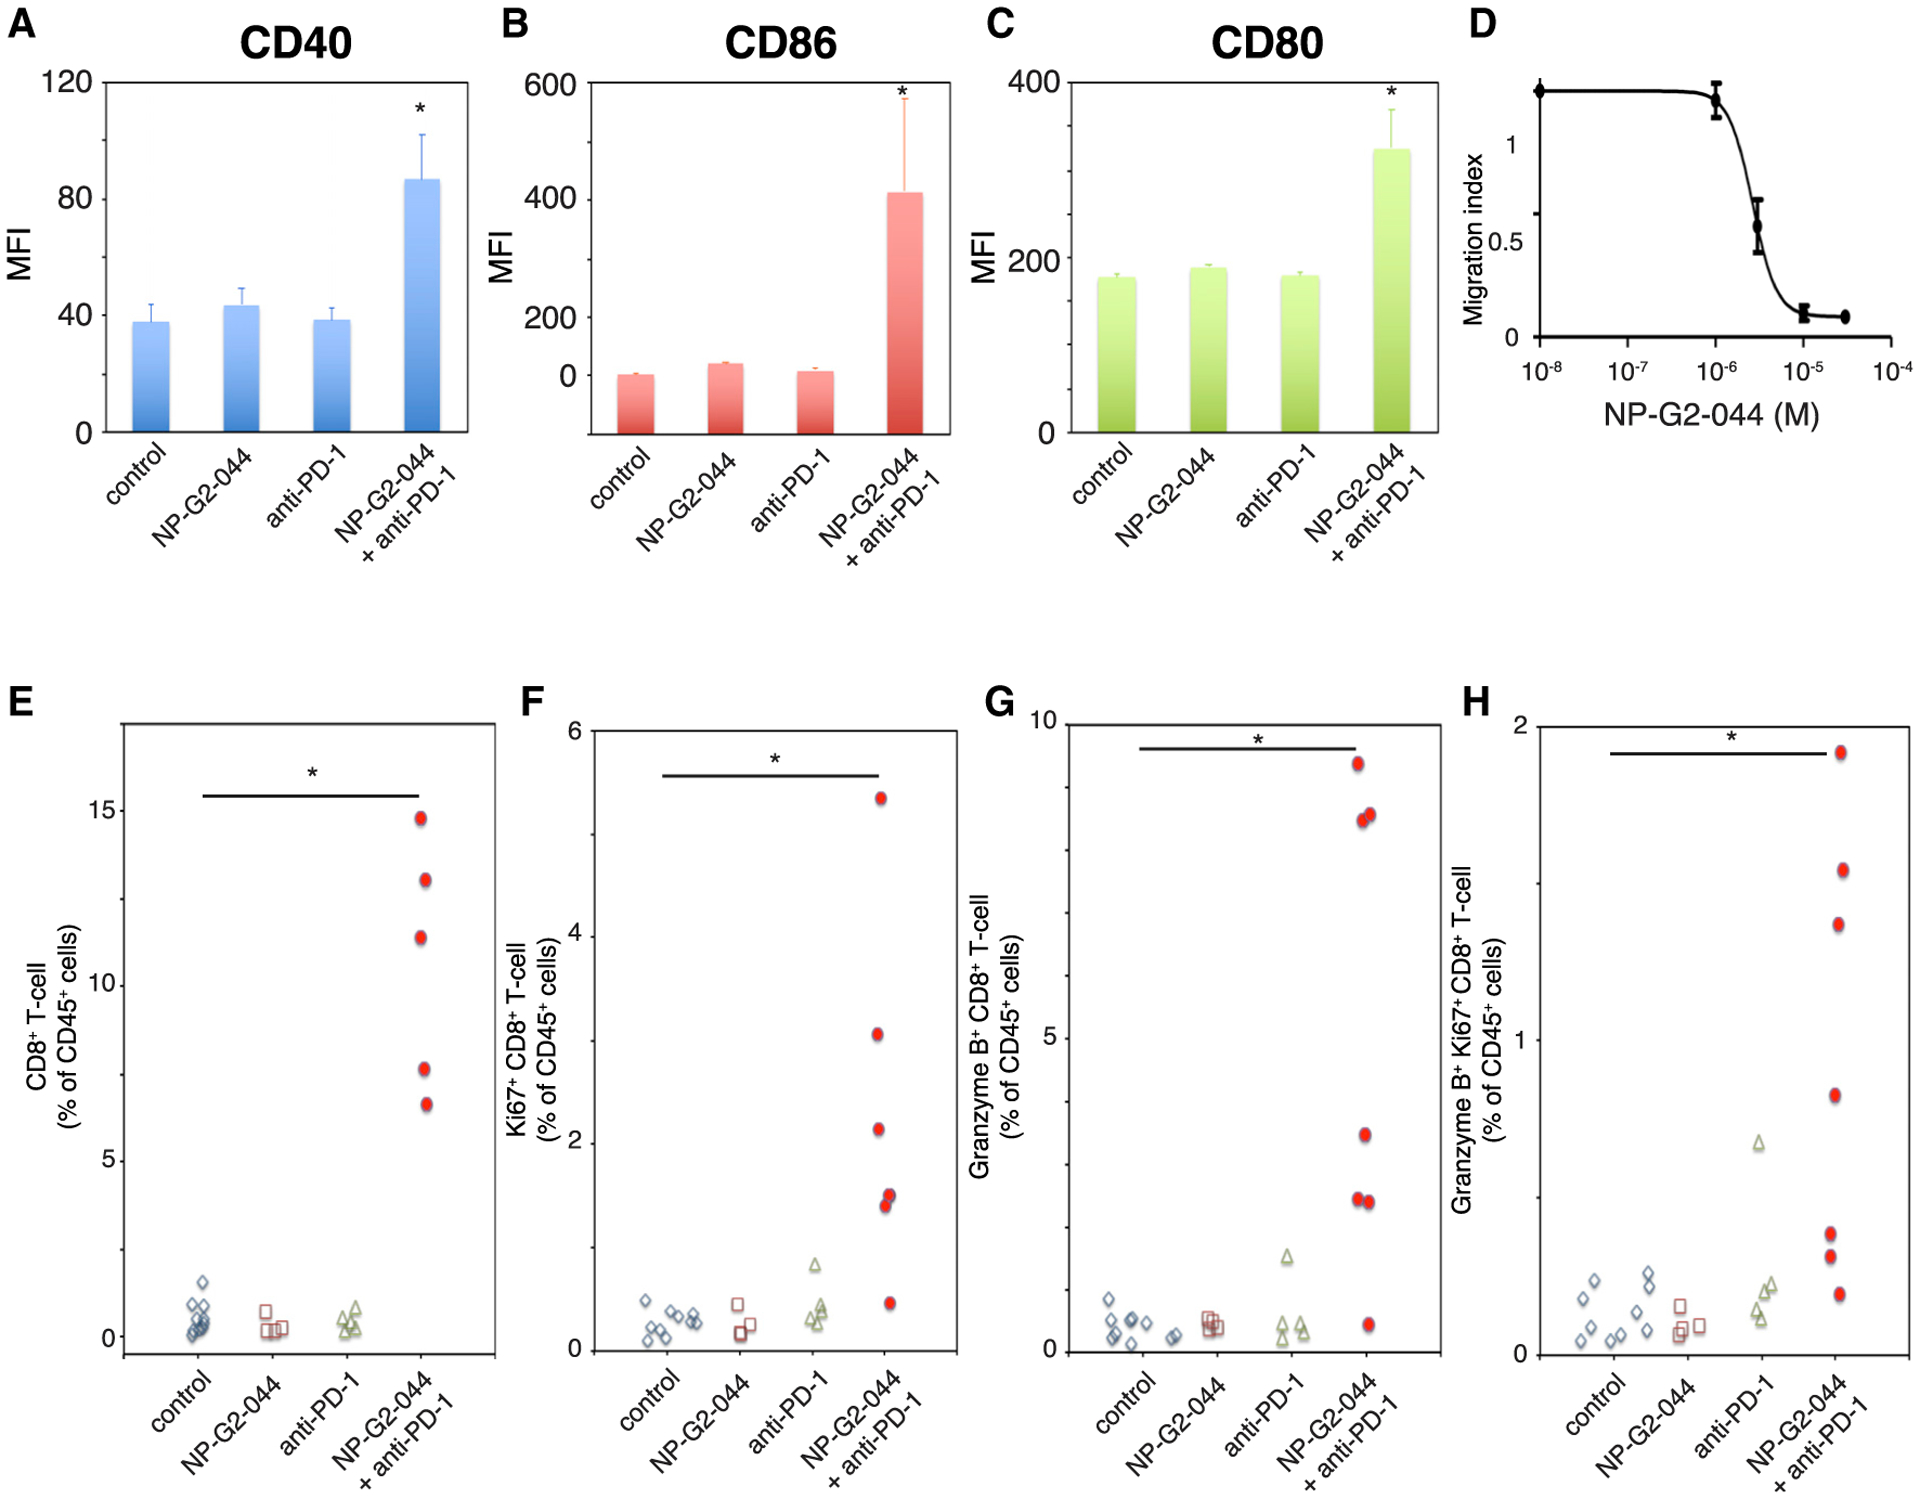
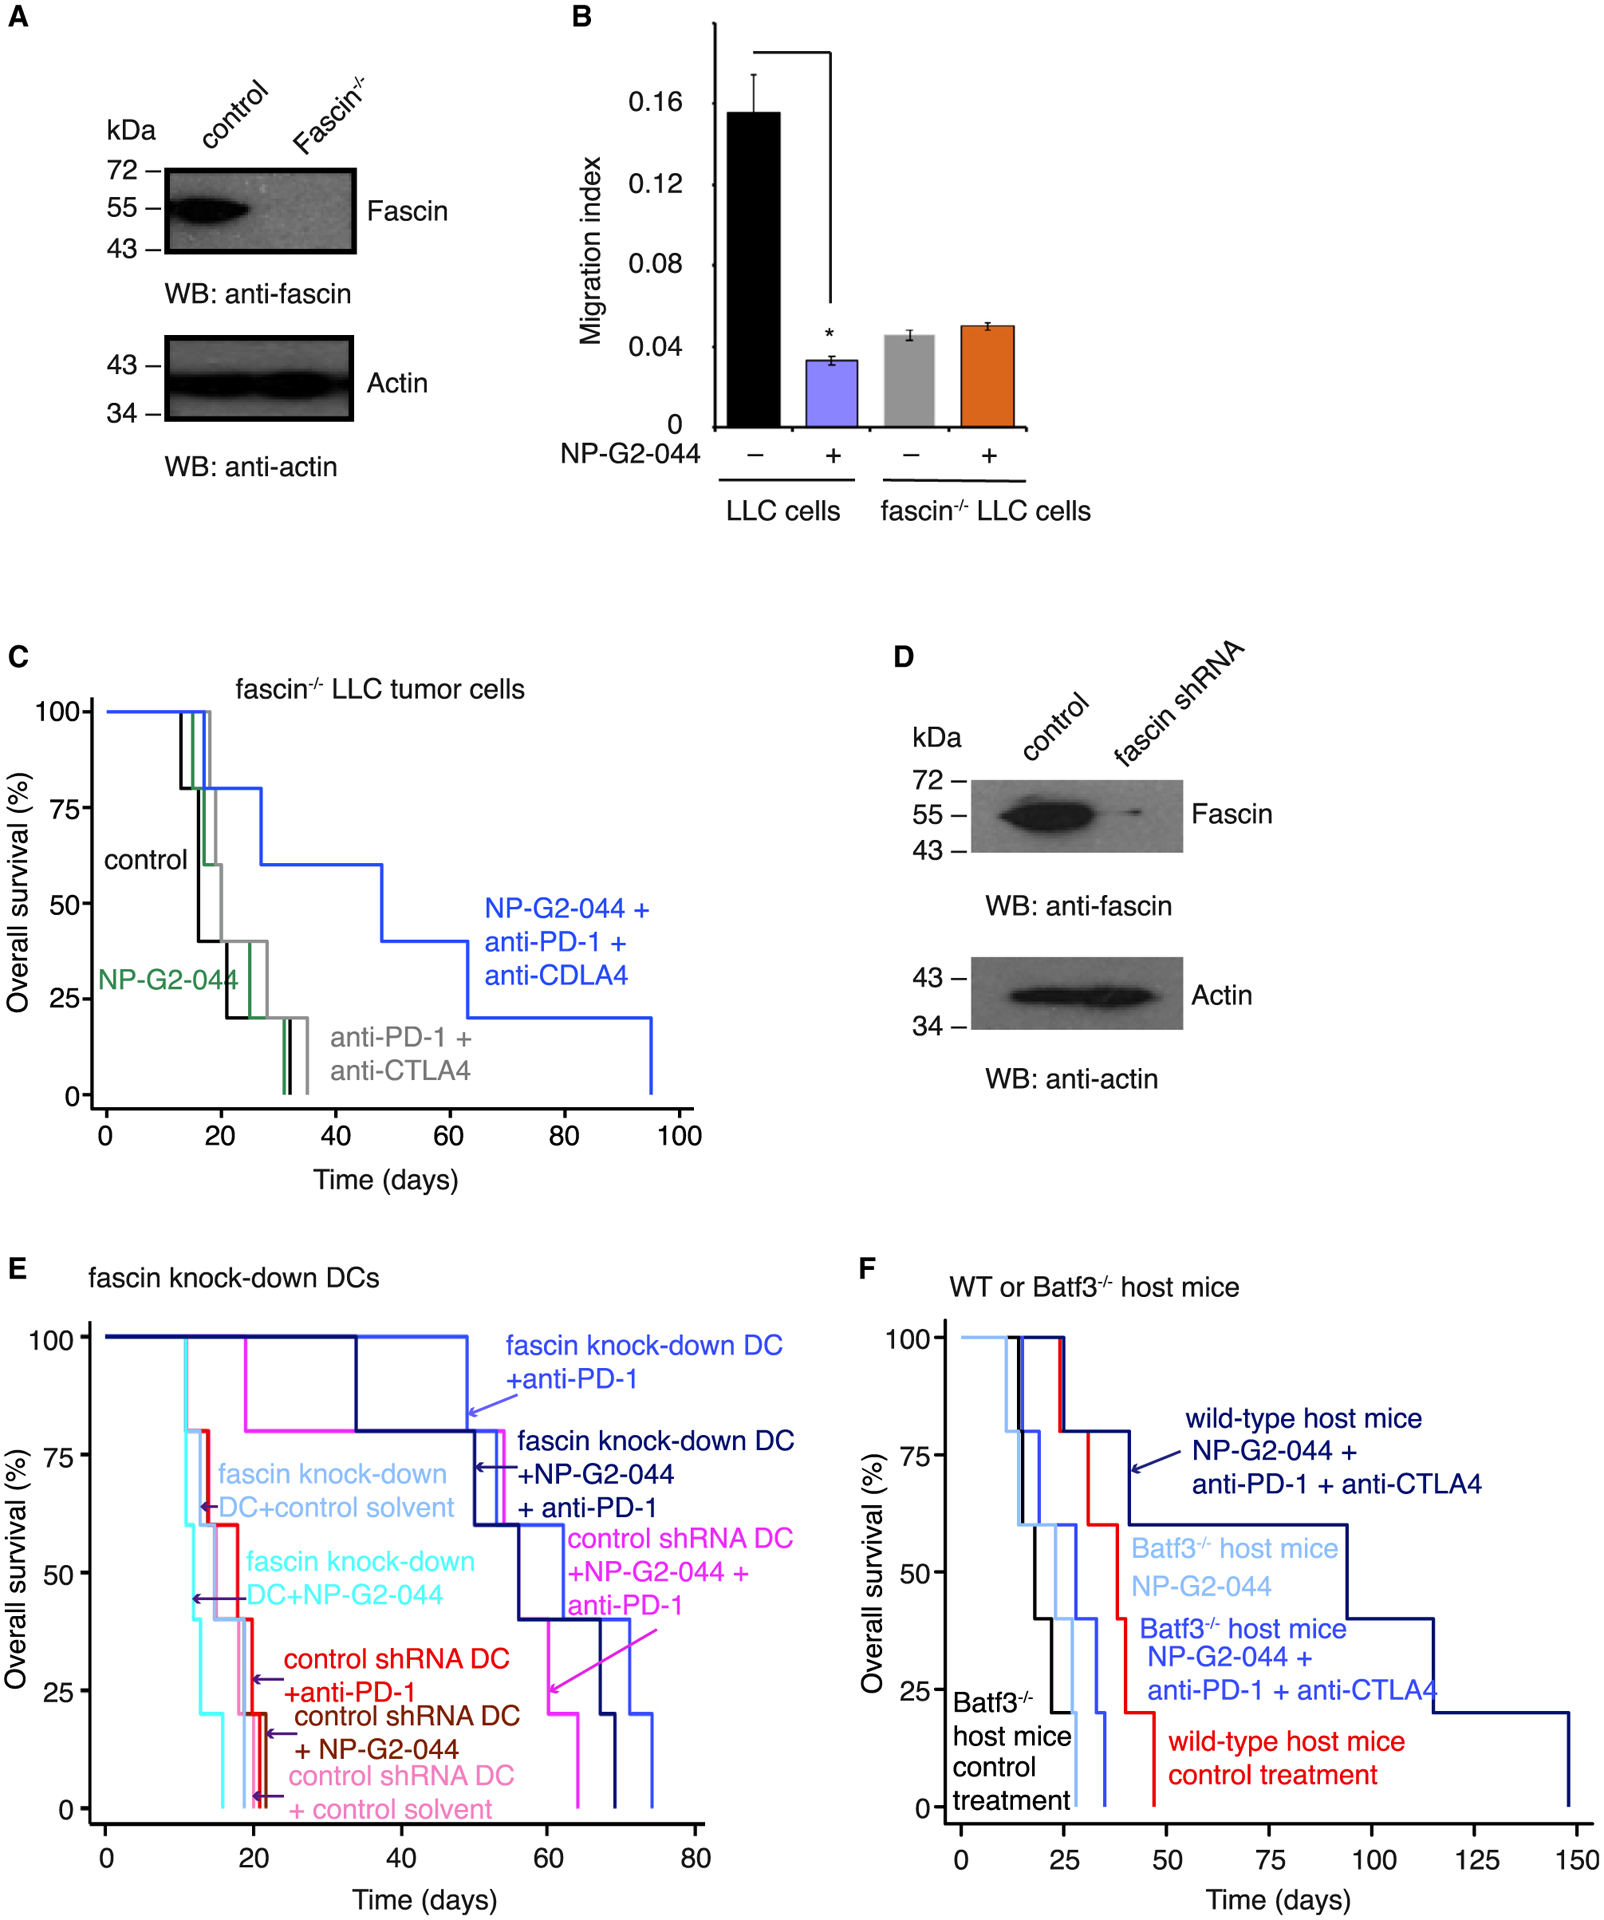
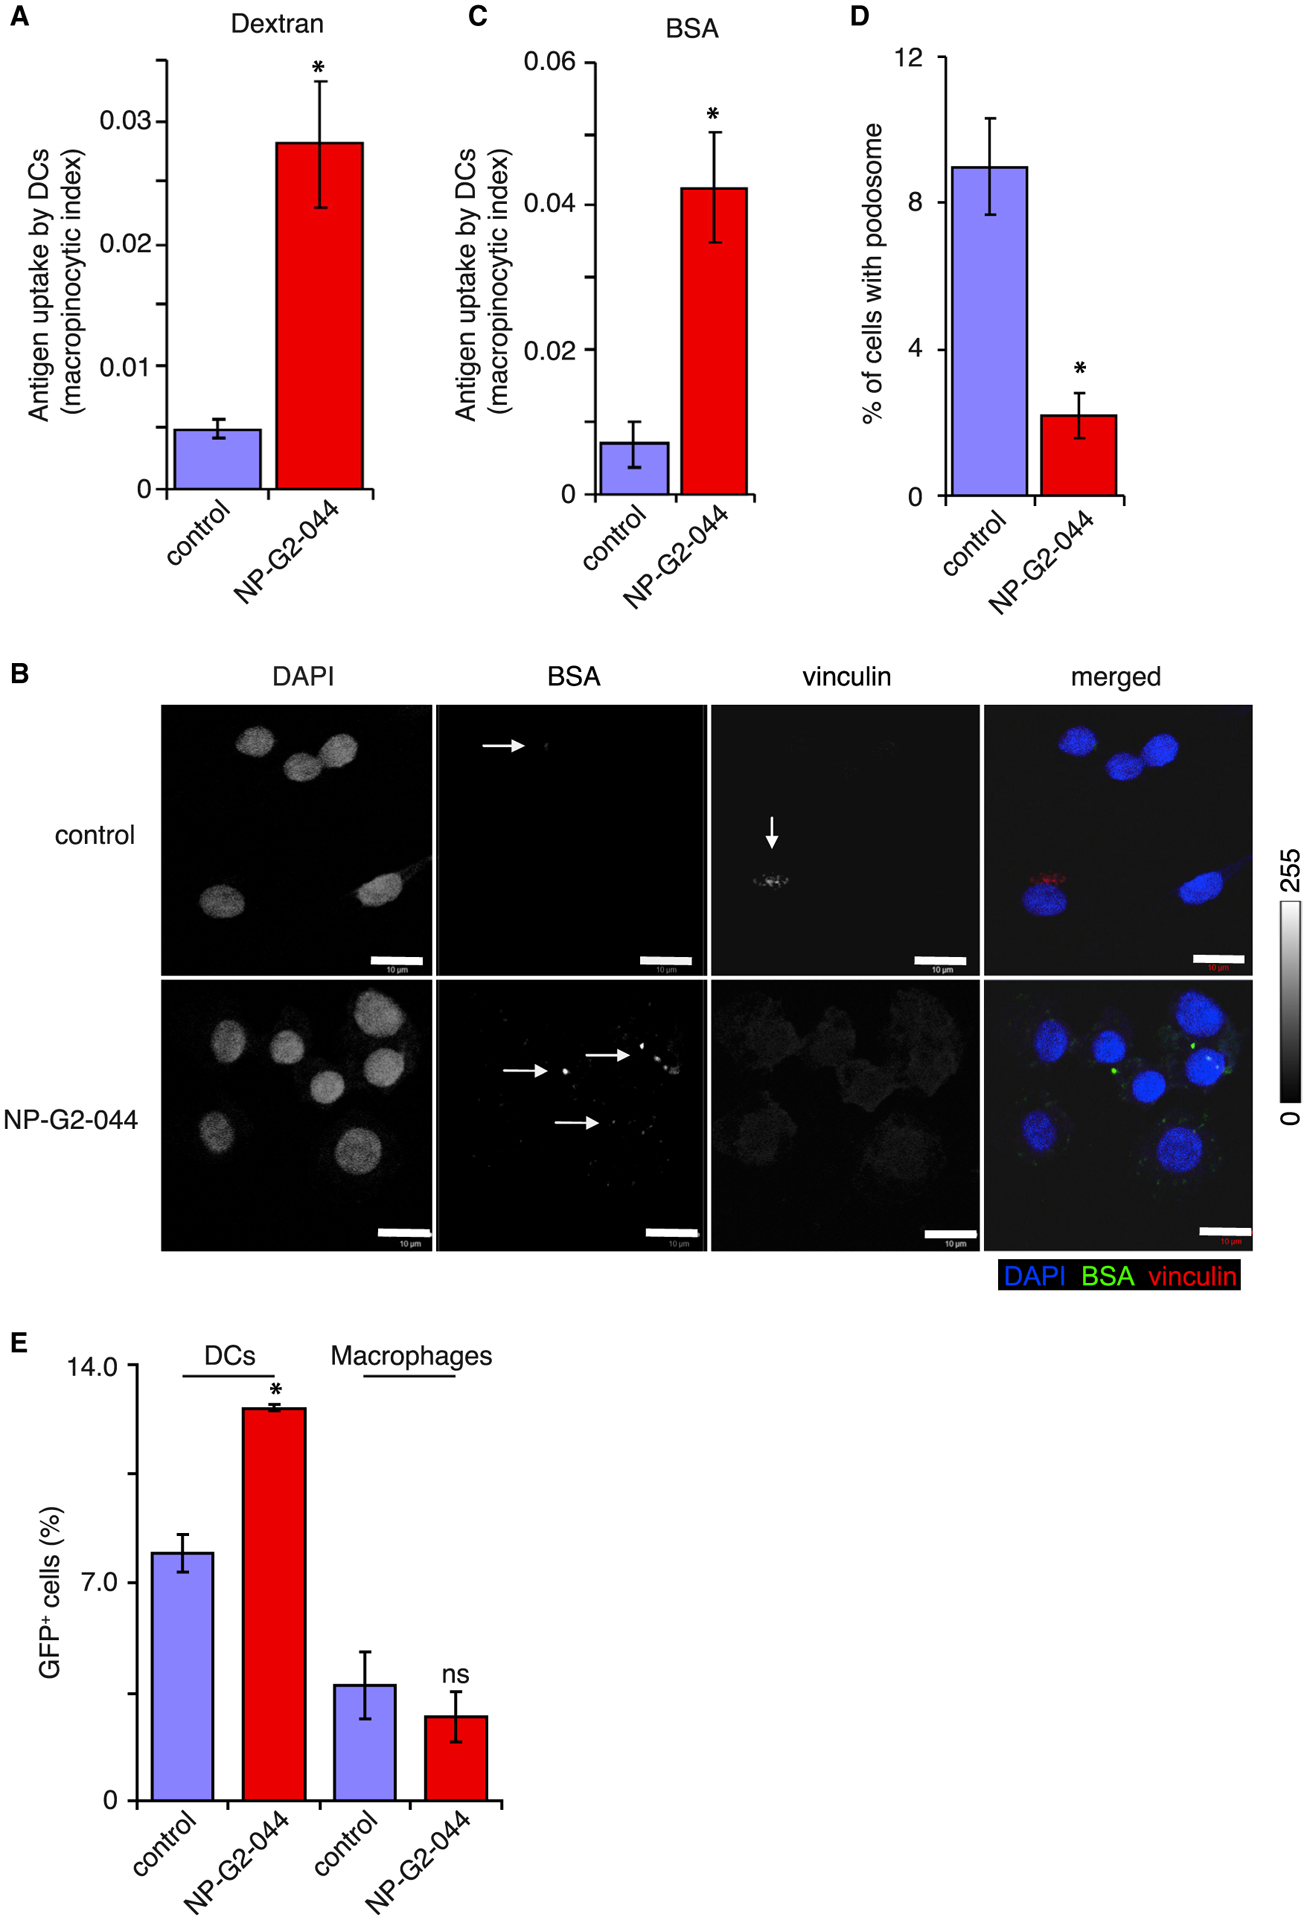
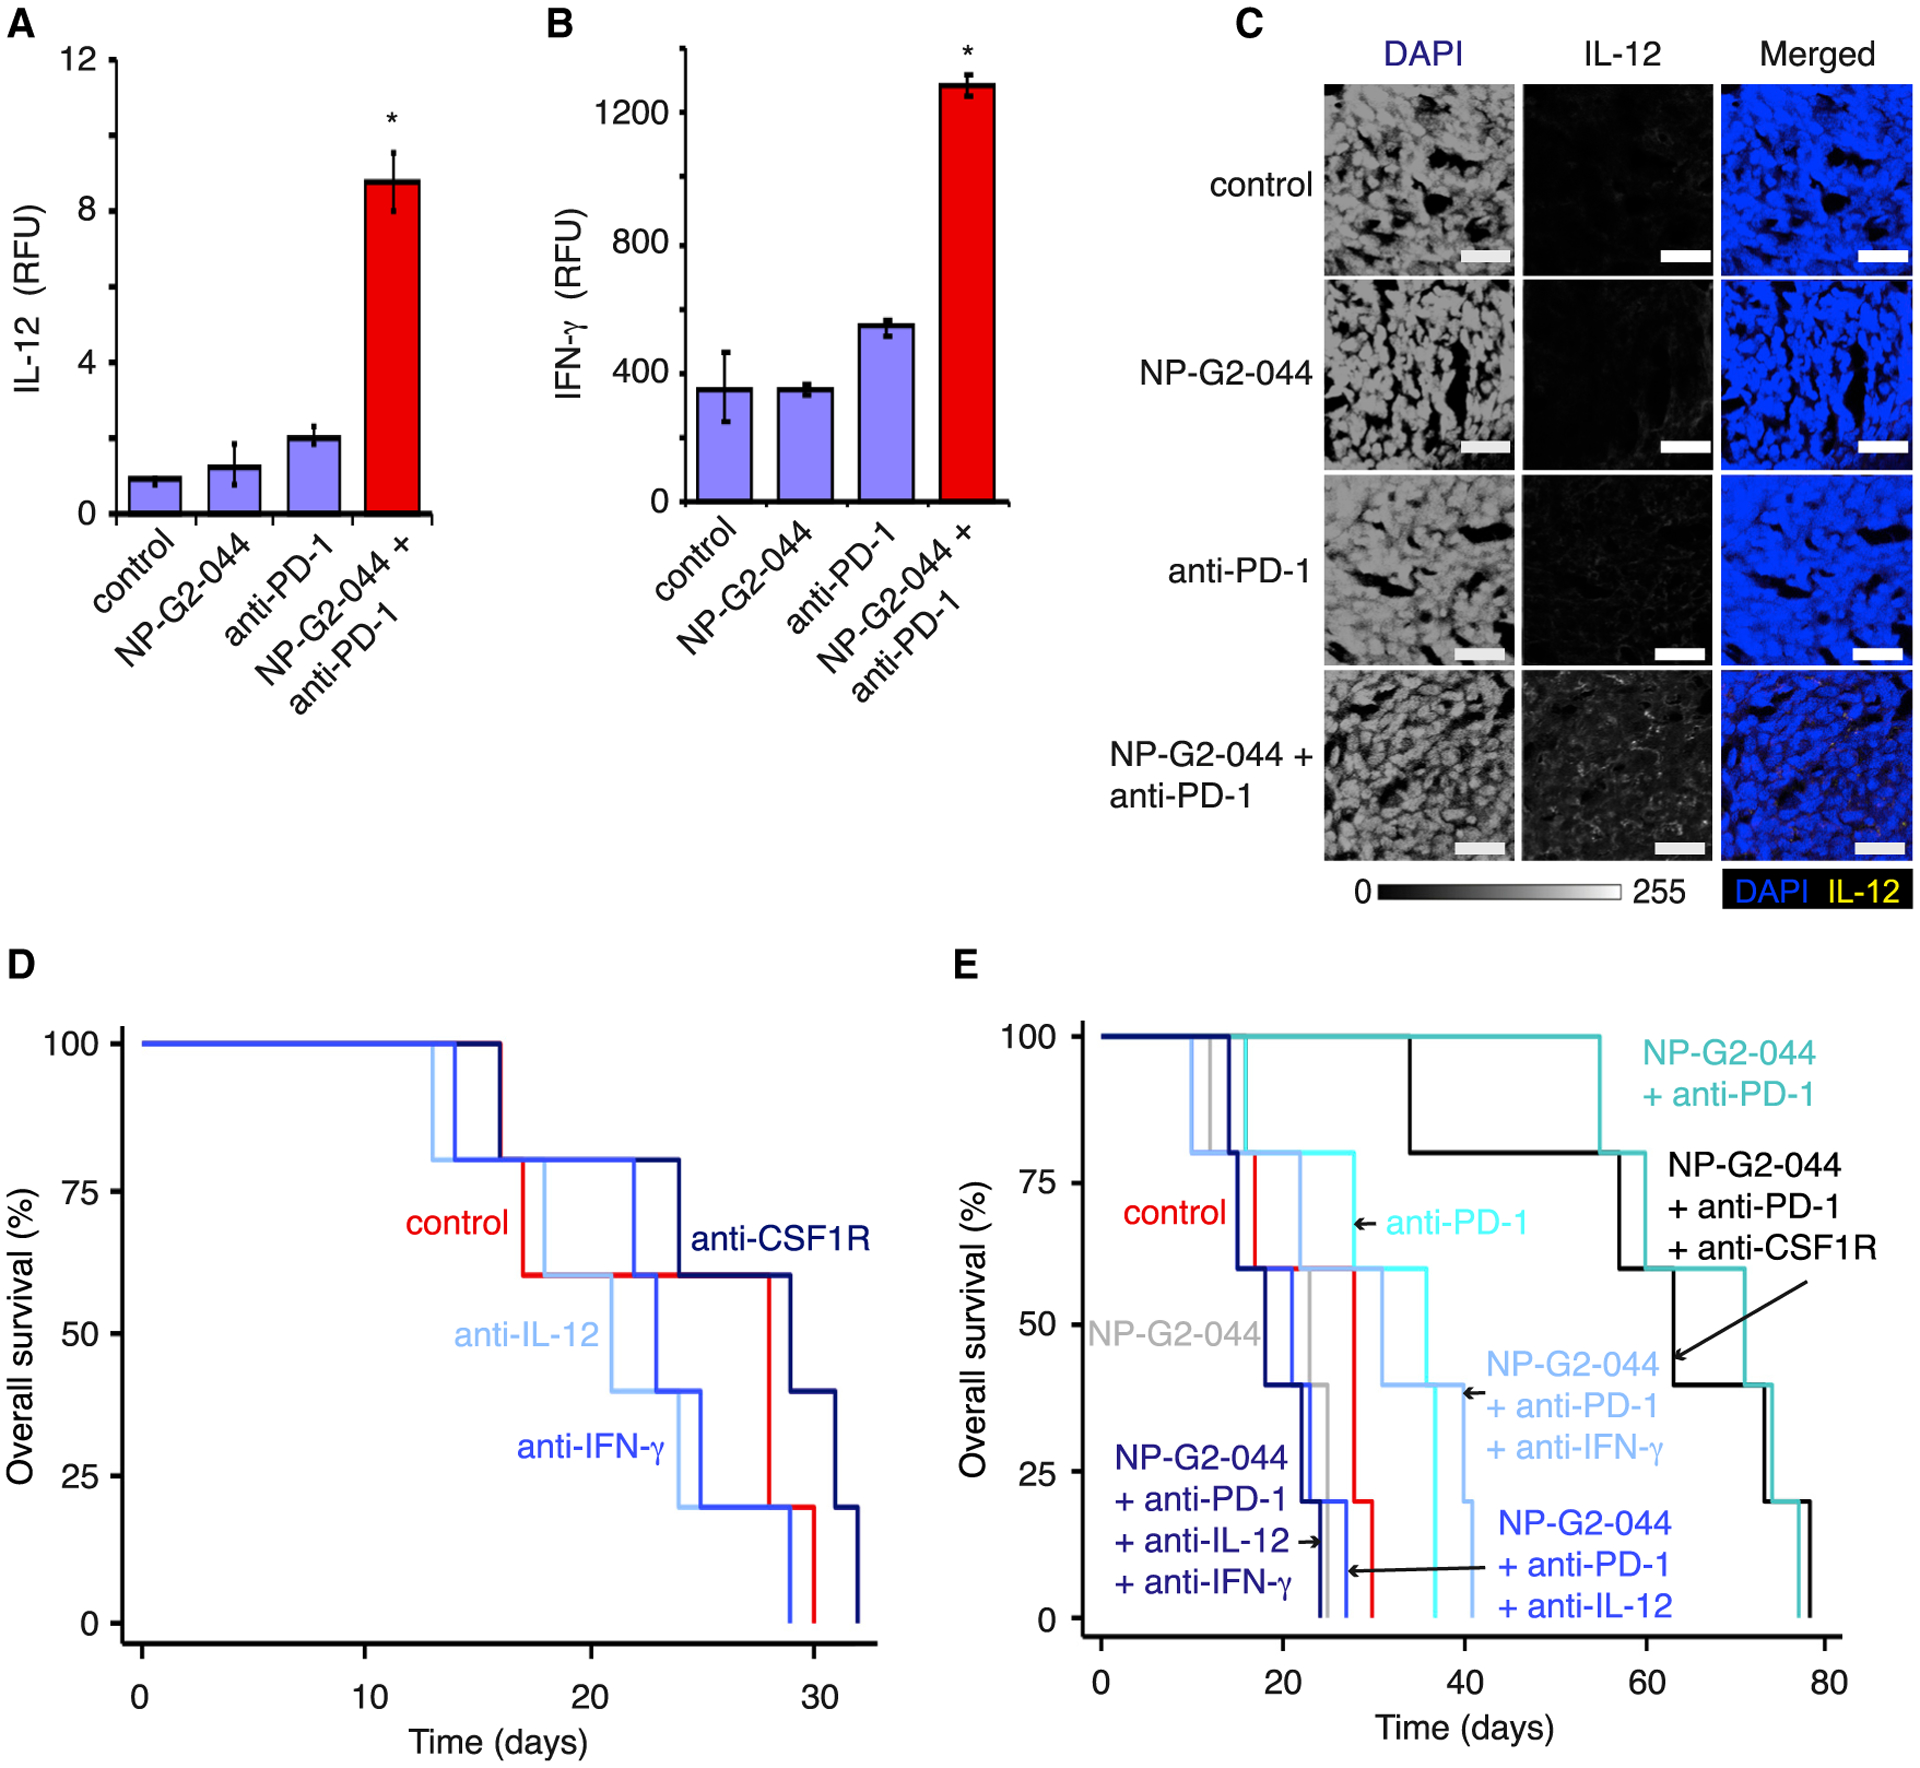
Fascin protein is the main actin-bundling protein in filopodia and invadopodia, which are critical for tumor cell migration, invasion, and metastasis. Small-molecule fascin inhibitors block tumor invasion and metastasis and increase the overall survival of tumor-bearing mice. Here, we report a finding that fascin blockade additionally reinvigorates anti-tumor immune response in syngeneic mouse models of various cancers. Fascin protein levels are increased in conventional dendritic cells (cDCs) in the tumor microenvironment. Mechanistically, fascin inhibitor NP-G2-044 increases the number of intratumoral-activated cDCs and enhances the antigen uptake by cDCs. Furthermore, together with PD-1 blocking antibody, NP-G2-044 markedly increases the number of activated CD8+ T cells in the otherwise anti-PD-1 refractory tumors. Reduction of fascin levels in cDCs, but not fascin gene knockout in tumor cells, mimics the anti-tumor immune effect of NP-G2-044. These data demonstrate that fascin inhibitor NP-G2-044 simultaneously limits tumor metastasis and reinvigorates anti-tumor immune responses.

Keywords: Fascin; IL-12; anti-PD-1; antigen uptake; cancer immunotherapy; dendritic cells; fascin inhibitors; immune checkpoint inhibitor; interferon gamma; tertiary lymphoid structure.


Conflict of interest statement

Declaration of interests Novita Pharmaceuticals supported part of the work through a Sponsored Research Agreement. X.-Y.H. and J.J.Z. are co-founders and have equity in Novita Pharmaceuticals.

Figures

Figure 1.
Figure 1.. Fascin inhibitors together with immune checkpoint inhibitors synergistically increase the overall survival of tumor-bearing mice
(A and B) Combination treatments of fascin inhibitors with anti-PD-1 and anti-CTLA-4 antibodies synergistically increase the overall survival of mice bearing 4T1 mouse triple-negative breast tumor cells. (A) Scheme of treatments. (B) Overall survival data for the four groups of mice with different treatments (n = 8 or 10). (C and D) Combination treatments of fascin inhibitors with anti-PD-1 and anti-CTLA-4 antibodies synergistically increase the overall survival of mice bearing EMT6 mouse triple-negative breast tumor cells. (C) Growth of primary tumors. Data are presented as mean ± SEM (n = 8 or 9). (D) Overall survival data for the four groups of mice with different treatments (n = 8 or 9). (E) Combination treatments of fascin inhibitors with anti-PD-1 and anti-CTLA-4 antibodies synergistically increase the overall survival of mice bearing LLC mouse lung cancer cells (n = 8–10). (F) Fascin inhibitors with anti-PD-1 and anti-CTLA-4 antibodies synergistically increase the overall survival of mice bearing Pan02 mouse pancreatic cancer cells (n = 7 or 8). (G) NP-G2–044 with anti-PD-1 and anti-CTLA-4 antibodies increase the overall survival of mice bearing PNEC30 mouse prostate cancer cells (n = 8 or 9).
Figure 2.
Figure 2.. NP-G2–044 and anti-PD-1 antibody synergistically increase the overall survival of tumor-bearing mice
(A and B) The synergistic effect is due to the combination of fascin inhibitors and anti-PD-1 antibody. (A) 4T1 primary tumor growth from the eight groups of mice with different treatments. All mice were monitored till death. Data are presented as mean ± SEM (n = 6–10). (B) Overall survival of the eight groups of mice with different treatments (n = 6–10). (C) Overall survival data of mouse models of Hepa1–6 liver cancer (n = 8 or 9). (D) Overall survival data of mouse models of Renca kidney cancer (n = 8 or 9).
Figure 3.
Figure 3.. Accumulation of intratumoral DCs after NP-G2–044 treatment
(A) Elevated expression of fascin protein in intratumoral DCs. Expression of fascin protein in different types of cells from the spleen (S) of naive mice (the first three columns), the S of the 4T1 tumor-bearing mice (the middle three columns), and the tumor tissues (T) of the tumor-bearing mice (the last three columns). Tumor tissues were dissected on day 20. (B–D) Immune cell composition within the tumor microenvironment. Tumor tissues from four groups of 4T1 tumor-bearing mice (control, NP-G2–044 treated, anti-PD-1 antibody treated, and treatment with NP-G2–044 + anti-PD-1 antibody) were analyzed by FACS for different types of immune cells. Tumor tissues were dissected on day 25. (E) Immunofluorescence imaging analysis of the tumor tissues from four groups of 4T1 tumor-bearing mice (control, NP-G2–044 treated, anti-PD-1 antibody treated, and treatment with NP-G2–044 + anti-PD-1 antibody). Anti-XCR1 antibody (for cDC1 cells), anti-CD8 antibody (for CD8+ T cells), anti-fascin antibody (for tumor cells), and DAPI were used. Right: quantification of XCR1+ or CD8+ cells per imaging field (data presented as mean ± SEM; each with 10 fields). Tumor tissues were dissected on day 25. n = 3 mice. Scale bars, 20 μm. *p < 0.05; **p < 0.005. One-way analysis of variance (ANOVA) followed by the Dunnett’s test, compared with the control group.
Figure 4.
Figure 4.. Increases of intratumoral activated DCs and CD8+ T cells
(A–C) Numbers of DCs with activation markers CD40 (A), CD86 (B), or CD80 (C). These DCs were from spleen or 4T1 tumor tissues isolated from mice treated with fascin inhibitors and anti-PD-1 antibody or from control mice. Data are presented as mean ± SEM (n = 3). *p < 0.05 (Student’s t test). (D) Inhibition of DC migration by fascin inhibitors. Data are presented as mean ± SEM (n = 3). (E–H) Increase of intratumoral CD8+ T cells by the combination treatment of NP-G2–044 + anti-PD-1 antibody. Increases of the numbers of total CD8+ T cells (E), proliferating Ki67+ CD8+ T cells (F), activated Granzyme B+ CD8+ T cells (G), as well as proliferating and activated (Ki67+Granzyme B+) CD8+ T cells (H) are shown from 4T1 tumor tissues. Each filled circle represents one mouse. Tumor tissues were dissected on day 27. *p < 0.05 (Student’s t test).
Figure 5.
Figure 5.. Fascin in DCs, but not in tumor cells, is essential for the synergistic immune response
(A) Western blots show that fascin protein is absent in fascin gene knockout (by CRISPR) LLC cells. (B) Although NP-G2044 blocked the migration of wild-type LLC cells, it had no effect on the migration of LLC cells with fascin gene knockout. Data are presented as mean ± SEM (n = 3). *p < 0.05 (Student’s t test). (C) Overall survival data of four different groups of mice after administering fascin−/− LLC tumor cells into the lungs (n = 5). (D) Western blot shows fascin protein levels were reduced in fascin shRNA-treated DC cells compared with control shRNAs-treated DCs. (E) Overall survival of mice with DCs that expressed fascin shRNAs or control shRNAs. After LLC tumor cell implantation, the mice were treated with control solvent, NP-G2–044, anti-PD-1 antibody, or with the combination therapy of NP-G2–044 + anti-PD-1 antibody (n = 5). (F) Overall survival study of Batf3−/− mice treated with NP-G2–044 or NP-G2–044 + ICIs after LLC tumor cell implantation. As a control, wild-type mice were implanted with LLC tumor cells and treated with control IgG or with NP-G2–044 + ICIs (n = 5).
Figure 6.
Figure 6.. NP-G2–044 increases the antigen uptake by DCs
(A–D) NP-G2–044 increased the antigen uptake by DCs. Fluorescently labeled dextran (A) or BSA (B and C) was added to cultured cDC1 cells. The uptake of dextran or BSA was quantified. In (A), 106 cells in the control group and 68 cells in NP-G2–044-treated group were quantified. In (C), 88 cells from the control group and 32 cells from NP-G2–044-treated group were quantified. *p < 0.05 (Student’s t test). (B and D) NP-G2–044 inhibited podosome formation in DCs. (B) Immunofluorescent staining of podosomes by anti-vinculin antibody was colored red. Fluorescently labeled BSA (green) was added to cultured cDC1 cells. Fluorescently labeled BSA was marked by arrows. Scale bars, 10 μm. (D) A total of 728 cells in the control group and 713 cells in NP-G2–044-treated group were quantified. The percentage of cells with podosomes is shown. *p < 0.05 (Student’s t test). (E) GFP-labeled 4T1 mouse breast tumor cells were implanted into the mammary fat pad. GFP+ DCs or macrophages within tumor tissues were quantified. *p < 0.05 (Student’s t test). ns, not significant. n = 3. Data are shown as mean ± SEM.
Figure 7.
Figure 7.. IL-12 and IFN-γ are necessary for the synergistic anti-tumor effect of NP-G2–044 + anti-PD-1 antibody
(A and B) Relative fluorescence units (RFUs) of IL-12 (A) and INF-γ (B) were quantified in tumor tissues from the four groups of mice. Data are presented as mean ± SEM. *p < 0.05 (110 regions of interest [ROIs]) (Student’s t test). (C) Immunofluorescence imaging analysis of the tumor tissues from four groups of LLC tumor-bearing mice (control, NP-G2–044 treated, anti-PD-1 antibody treated, and treatment with NP-G2–044 + anti-PD-1 antibody). Anti-IL-12 antibody and DAPI were used. Tumor tissues were dissected on day 23. Scale bars, 20 μm. (D and E) Neutralizing IL-12 and IFN-γ, but not CSF1R, abolished the anti-tumor effect of NP-G2–044 + anti-PD-1 antibody. Data shown in (D) and (E) are from the same experiment. The data from some groups are shown in (D) to avoid the overcrowding in (E). The data for the control group in (D) and (E) are the same. The only two groups that show statistical significance (log-rank test, p < 0.05) from the control group are the NP-G2–044 + anti-PD-1 treatment group and the NP-G2–044 + anti-PD-1 + anti-CSF1R treatment group. Five mice per group.

Similar articles

Cited by

References

    1. Abdi K, Singh NJ, and Matzinger P (2012). Lipopolysaccharide-activated dendritic cells: “exhausted” or alert and waiting? J. Immunol 188, 5981–5989. - PMC - PubMed
    1. Barry M, and Bleackley RC (2002). Cytotoxic T lymphocytes: all roads lead to death. Nat. Rev. Immunol 2, 401–409. - PubMed
    1. Bros M, Ross XL, Pautz A, Reske-Kunz AB, and Ross R (2003). The human fascin gene promoter is highly active in mature dendritic cells due to a stage-specific enhancer. J. Immunol 171, 1825–1834. - PubMed
    1. Bryan J, and Kane RE (1978). Separation and interaction of the major components of sea urchin actin gel. J. Mol. Biol 125, 207–224. - PubMed
    1. Cabrita R, Lauss M, Sanna A, Donia M, Skaarup Larsen M, Mitra S, Johansson I, Phung B, Harbst K, Vallon-Christersson J, et al. (2020). Tertiary lymphoid structures improve immunotherapy and survival in melanoma. Nature 577, 561–565. - PubMed

Publication types

MeSH terms