. 2021 Jun;594(7861):88-93.
doi: 10.1038/s41586-021-03491-6. Epub 2021 Apr 7.

Drugs that inhibit TMEM16 proteins block SARS-CoV-2 spike-induced syncytia

Affiliations

Drugs that inhibit TMEM16 proteins block SARS-CoV-2 spike-induced syncytia

Luca Braga et al. Nature. 2021 Jun.

Abstract

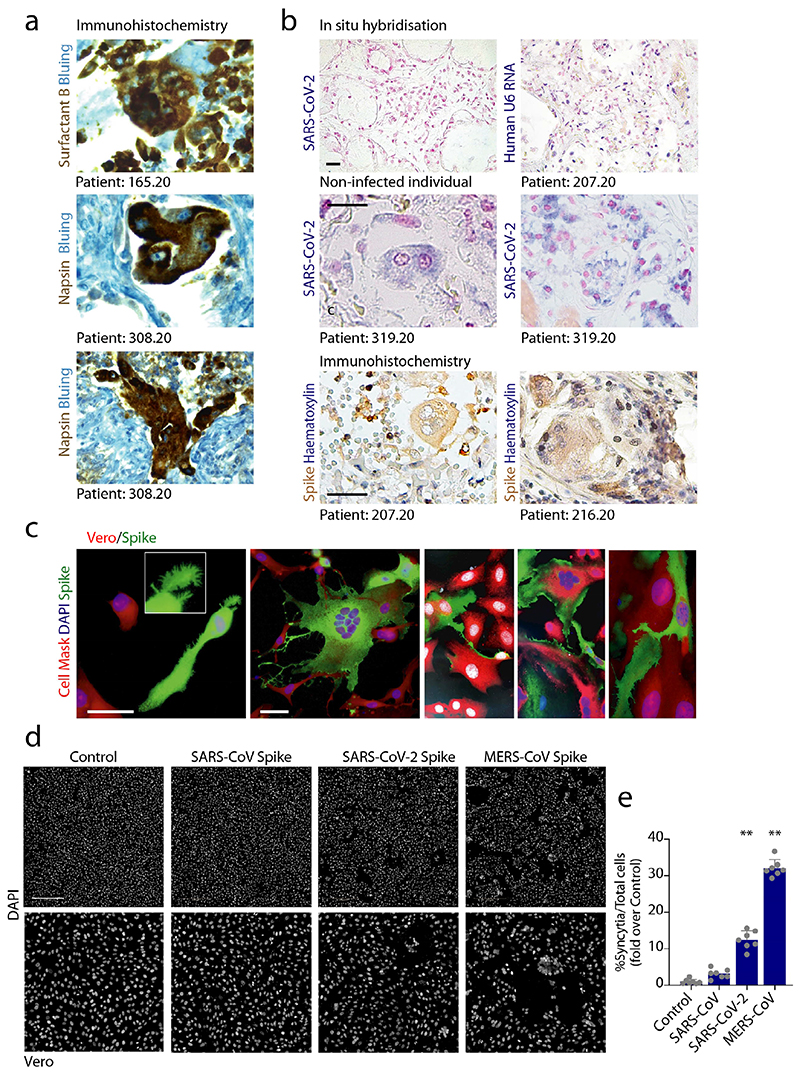
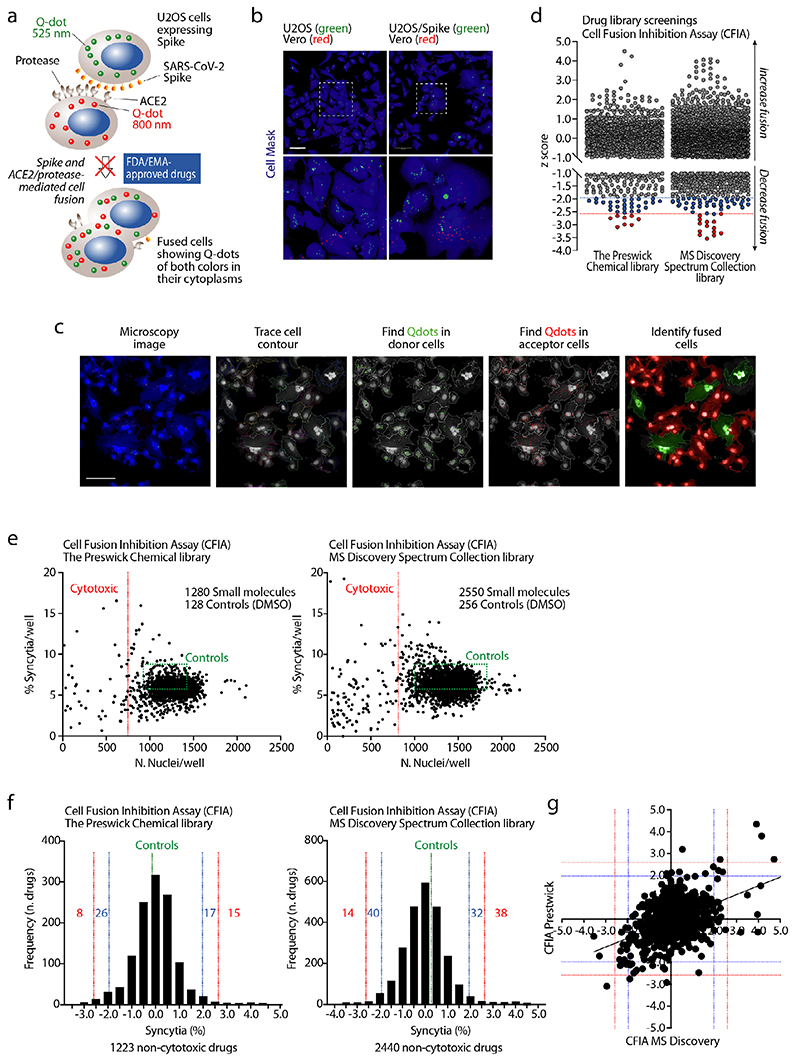
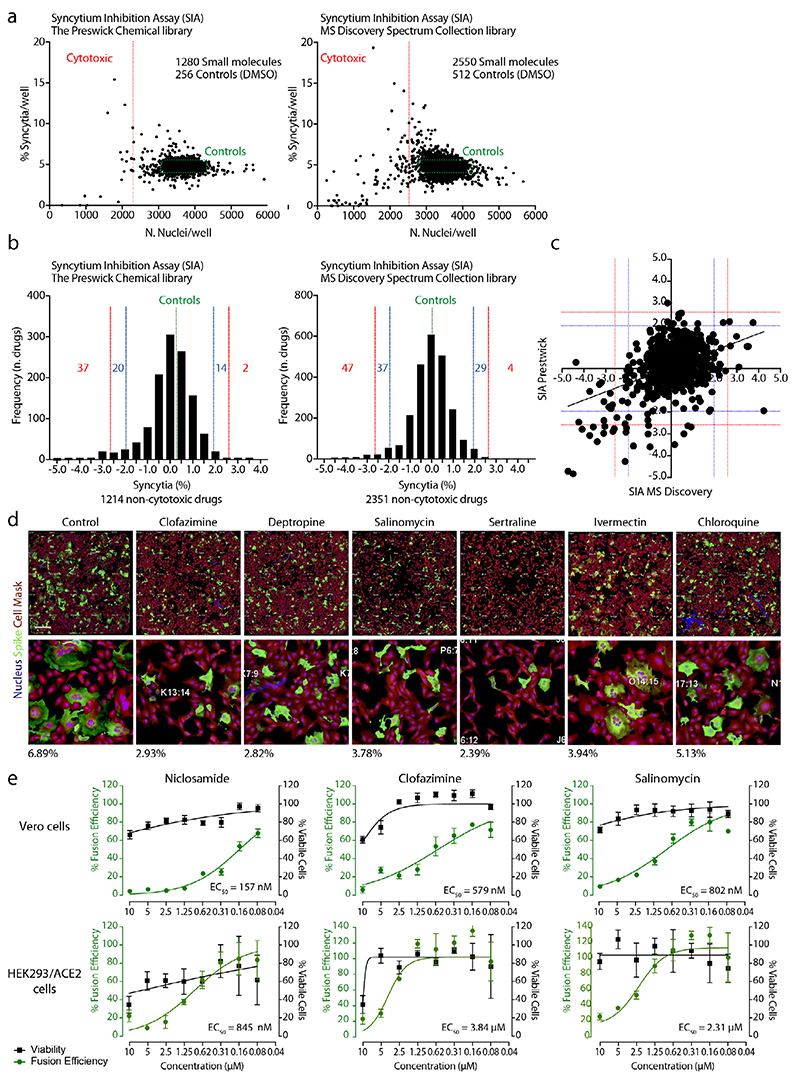
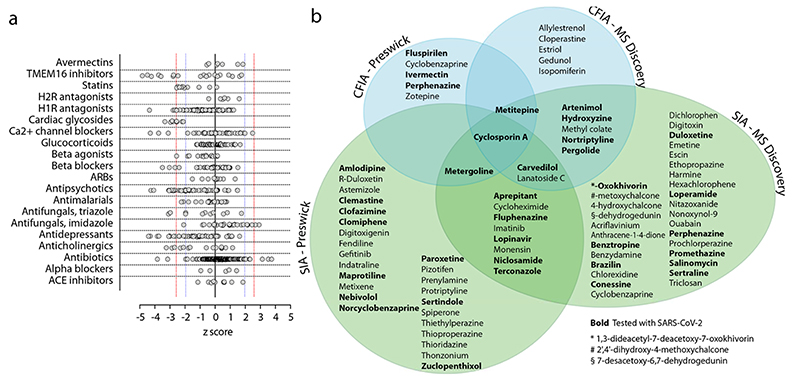
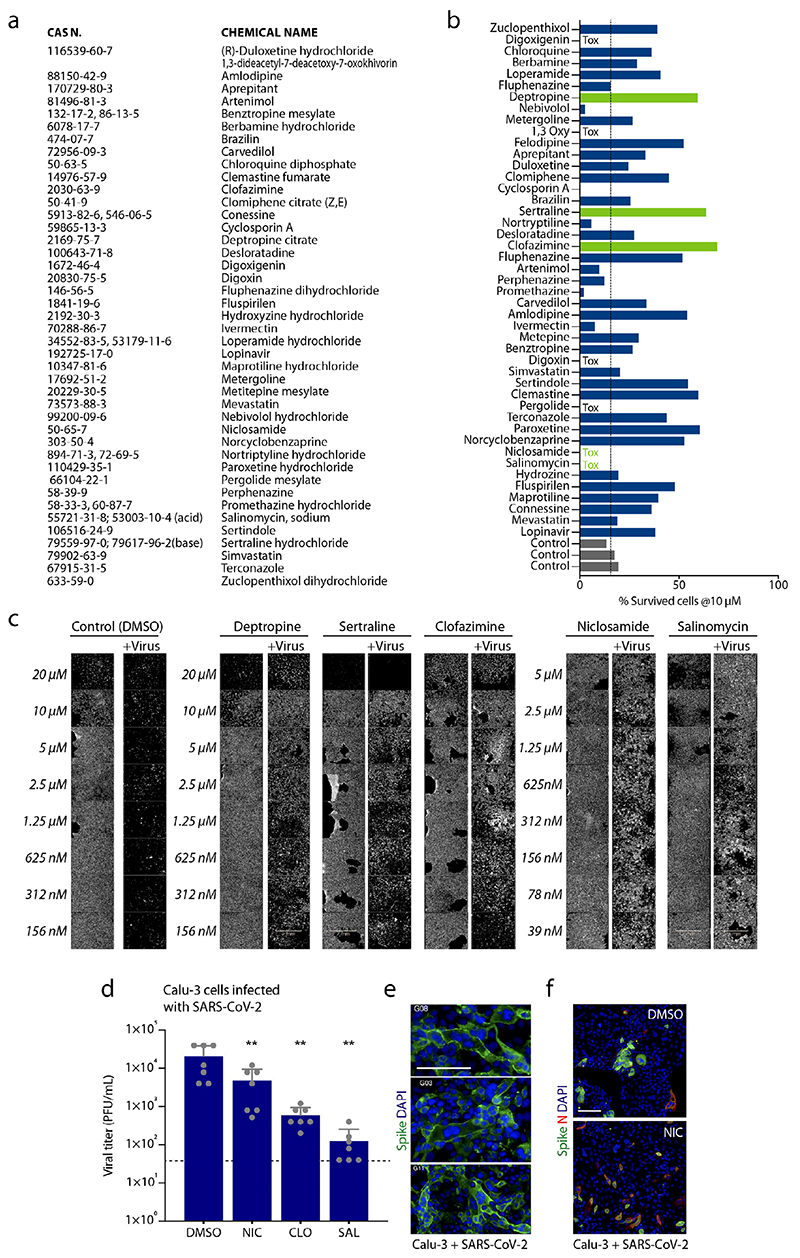
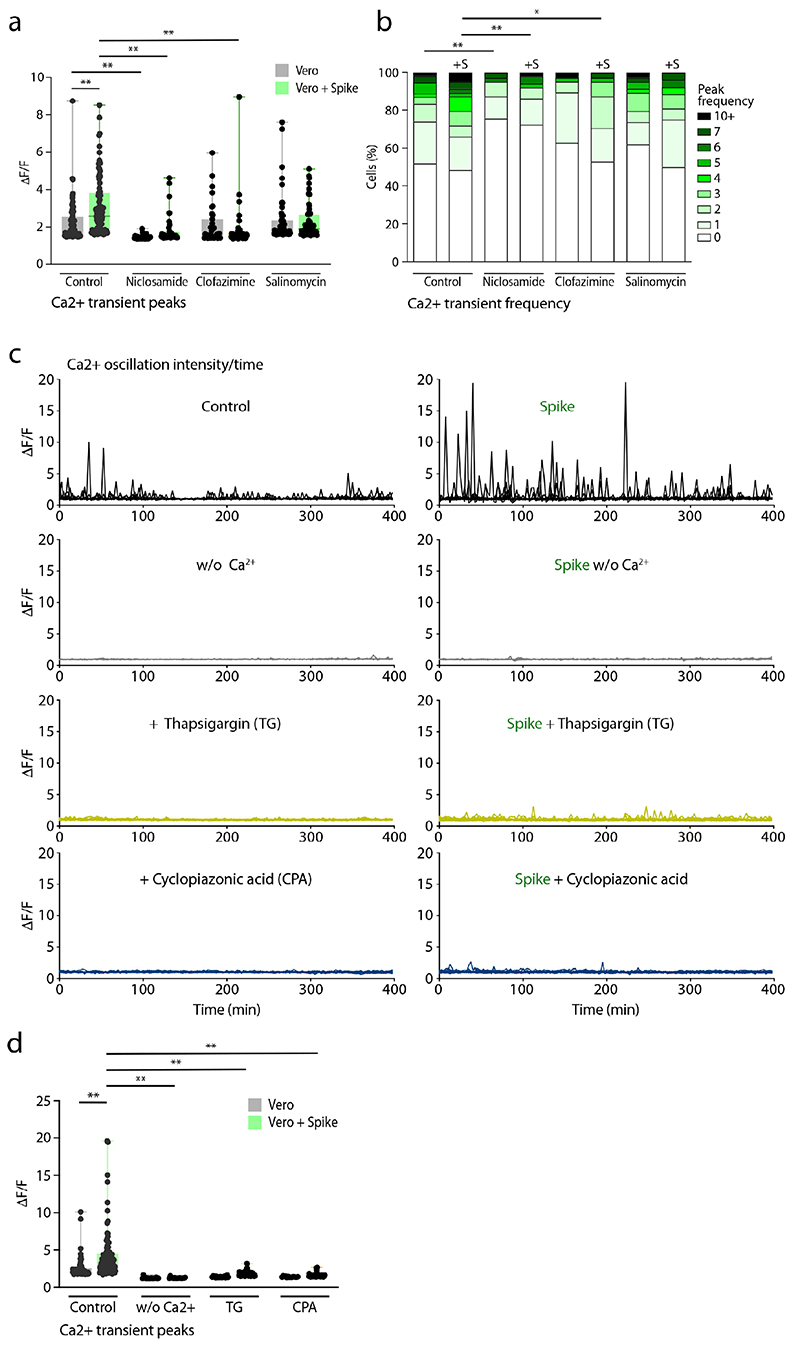
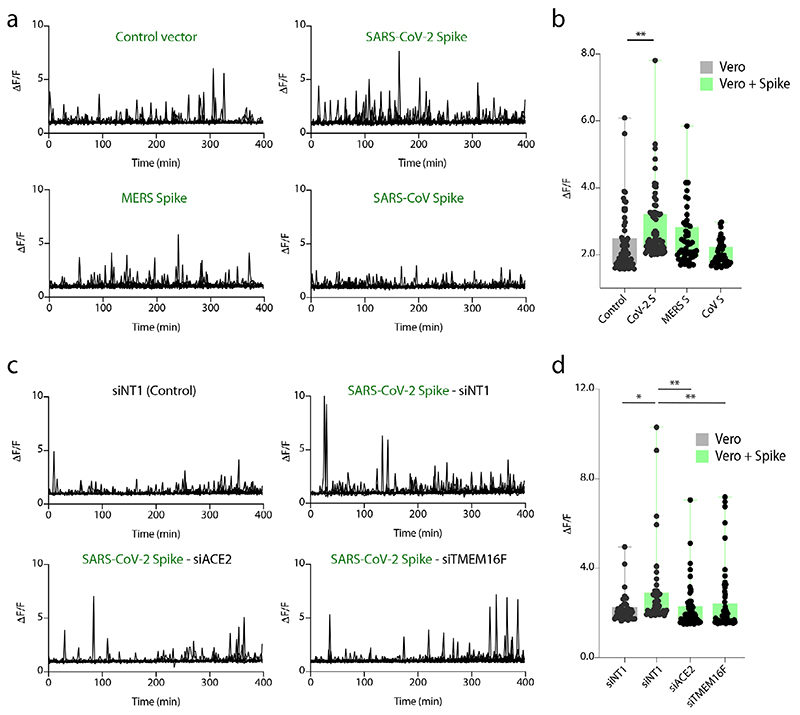
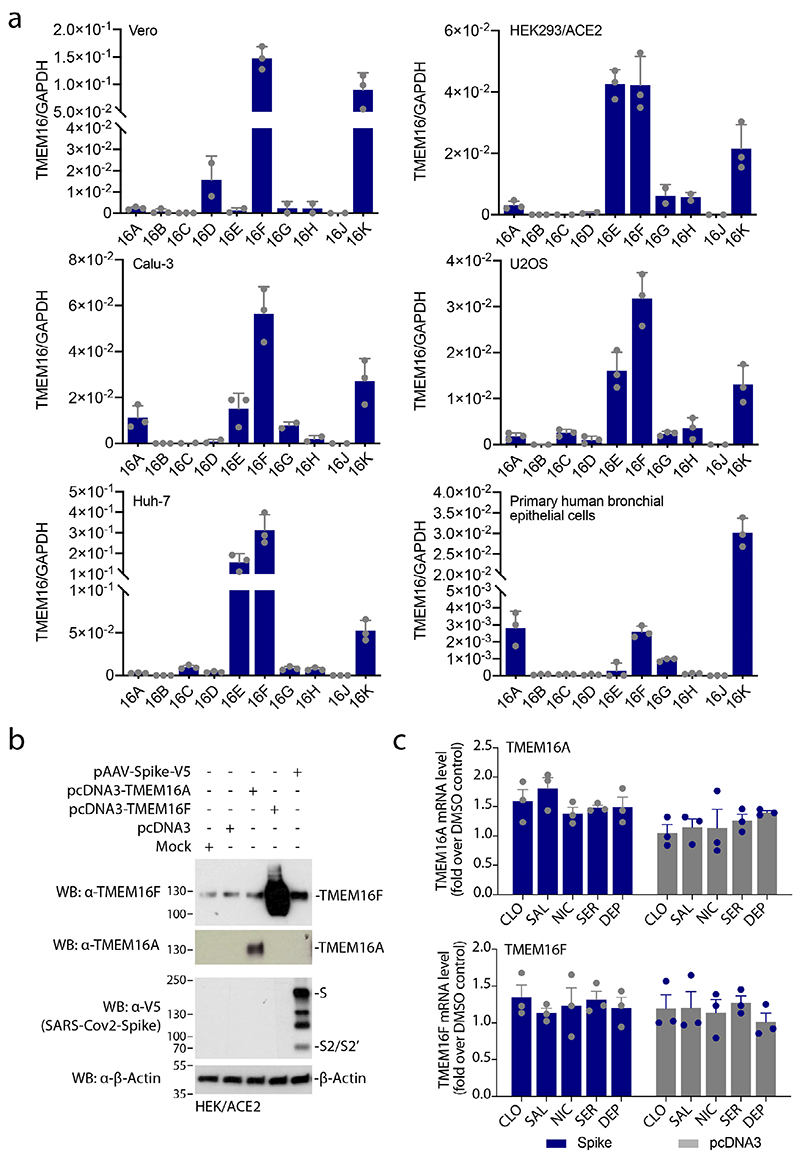
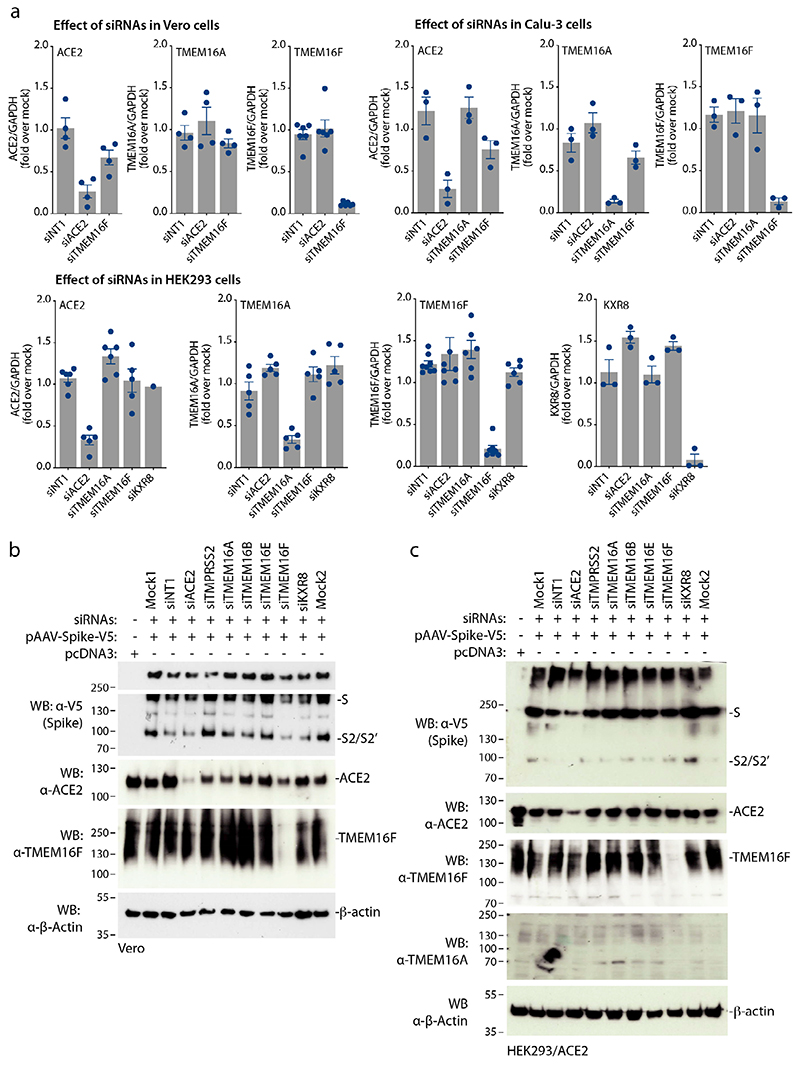
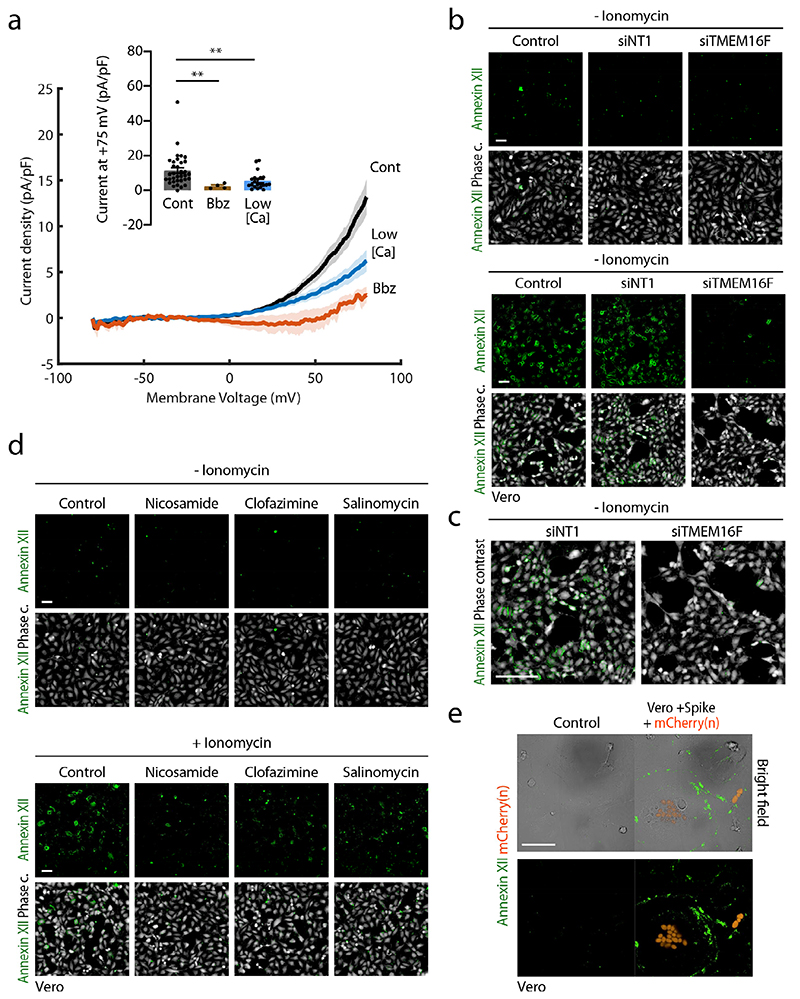
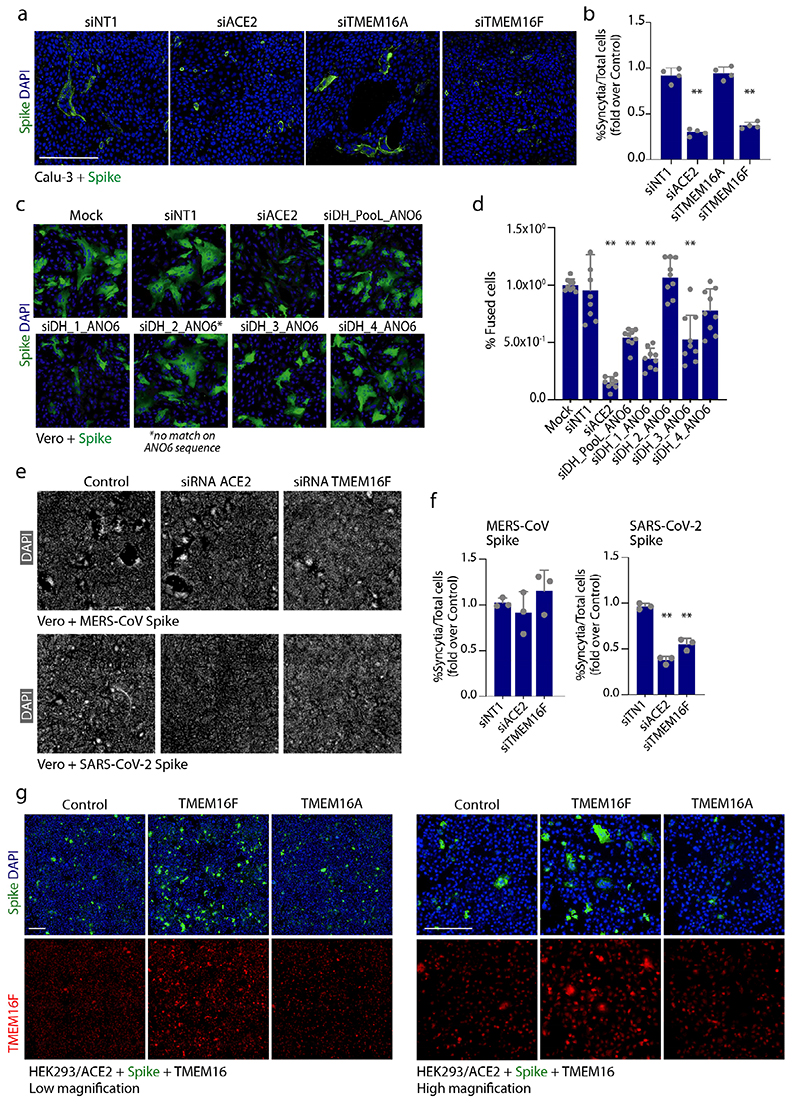
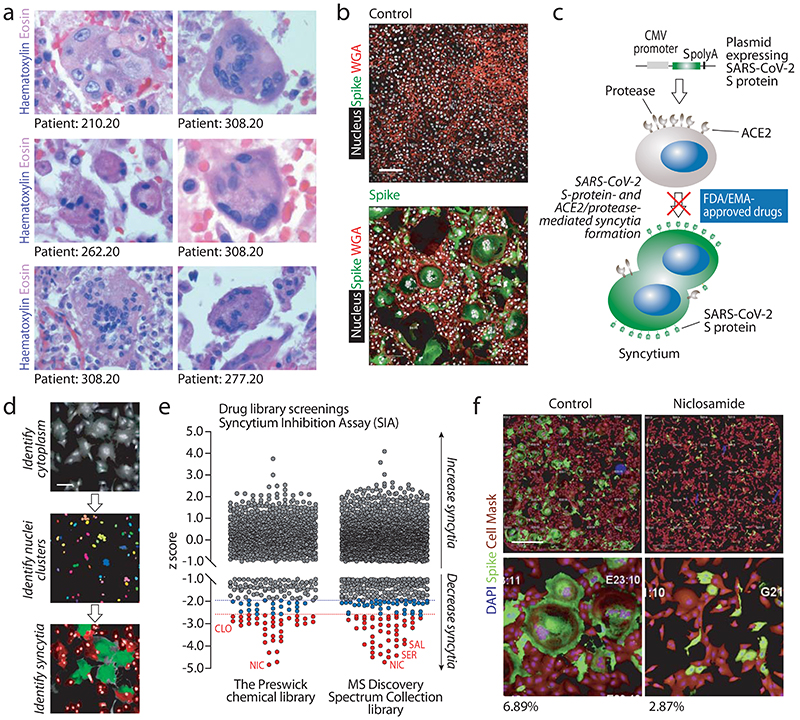
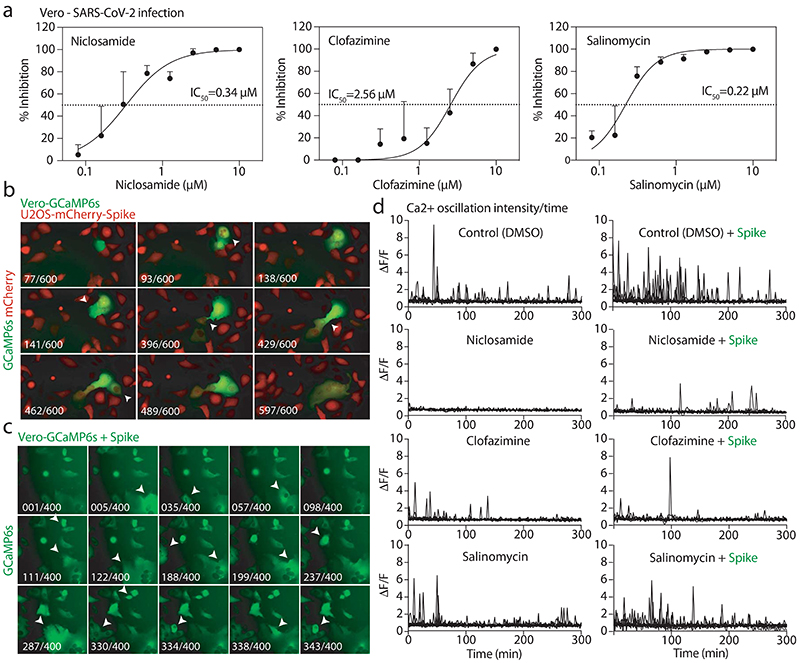
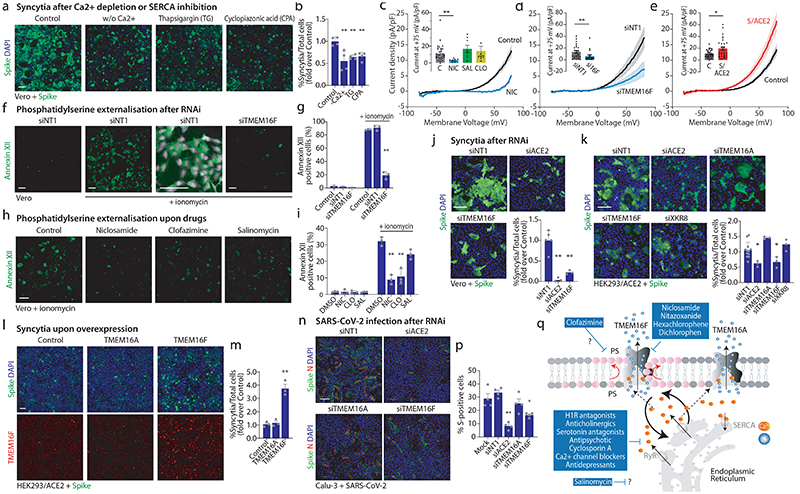
COVID-19 is a disease with unique characteristics that include lung thrombosis1, frequent diarrhoea2, abnormal activation of the inflammatory response3 and rapid deterioration of lung function consistent with alveolar oedema4. The pathological substrate for these findings remains unknown. Here we show that the lungs of patients with COVID-19 contain infected pneumocytes with abnormal morphology and frequent multinucleation. The generation of these syncytia results from activation of the SARS-CoV-2 spike protein at the cell plasma membrane level. On the basis of these observations, we performed two high-content microscopy-based screenings with more than 3,000 approved drugs to search for inhibitors of spike-driven syncytia. We converged on the identification of 83 drugs that inhibited spike-mediated cell fusion, several of which belonged to defined pharmacological classes. We focused our attention on effective drugs that also protected against virus replication and associated cytopathicity. One of the most effective molecules was the antihelminthic drug niclosamide, which markedly blunted calcium oscillations and membrane conductance in spike-expressing cells by suppressing the activity of TMEM16F (also known as anoctamin 6), a calcium-activated ion channel and scramblase that is responsible for exposure of phosphatidylserine on the cell surface. These findings suggest a potential mechanism for COVID-19 disease pathogenesis and support the repurposing of niclosamide for therapy.


Conflict of interest statement

Competing Interest

King’s College London has filed a patent application on the methods used to detect SARS-CoV-2 Spike protein-induced syncytia as described in this manuscript.

Figures

Extended Data Figure 1
Extended Data Figure 1. Syncytia induced by coronavirus Spike proteins
a, Syncytial pneumocytes in the lungs of COVID-19 patients. Immunohistochemistry using the indicated antibodies, ×40. Further information on the patients’ cohort and is in ref.. b, In situ hybridization using two LNA-modified RNA probes for the SARS-CoV-2 genome (upper four panels) and immunohistochemistry with an anti-Spike antibody. Lung samples from individuals who died in 2018 for other causes served as negative controls for this analysis, while a positive control was hybridization with a probe for the ubiquitous U6 RNA, as per our previous experience , which showed nuclear localization in all cells. Scale bar: 50 μm. Further information on the in situ hybridization technique is in ref.. c, Cytological alterations induced by Spike protein. Vero cells were transfected with a Spike–expressing plasmid and cultured for 12 hr; Spike protein was then visualised by IF and cell body stained using HCS CellMask DeepRed. Spike-positive cells show marked morphological alterations, including presence of numerous filopodia (inset in the leftmost panel) and membrane protrusions contacting the plasma membrane of neighbouring cells. Scale bar: 50 μM. d and e, Syncytia induced by other coronavirus Spike proteins. Vero cells were transfected to express the Spike protein of MERS-CoV, SARS-CoV or SARS-CoV-2. After 24 hr, cells were immuno-stained for nuclei (white). Representative images are in d, and quantifications in e. Data are mean±SEM; n=4). **P<0.01, one-way ANOVA with Bonferroni correction.
Extended Data Figure 2
Extended Data Figure 2. Cell Fusion Inhibition Assay (CFIA)
a, Scheme of Cell Fusion Inhibition Assay (CFIA). The assay is based on the co-culture, for 12 hr, of Vero cells with U2OS cells transiently transfected to express Spike. To permit quantitative assessment of cell fusion by HC microscopy, the Spike “donor” U2OS cells are loaded with quantum dots (Q-dots) emitting at 525 nm (green) while the “acceptor” Vero cells with Q-dots emitting at 800 nm (red). Screenings were performed in 384-well plates by co-plating Q-dot loaded “donor” and “acceptor” cells, followed by drug treatment at 10 μM standard concentration. After 24 hr, cells were fixed and processed by HC microscopy. Multiple control wells with 1% DMSO and no drugs were included in each plate. b, Fluorescent images of co-cultured U2OS (Green Q-dots) and Vero (Red Q-dots) cells. Cells are stained with HCS CellMask Blue; fused cells (heterokaryons) are identified as cells having more than two nuclei and containing both green and red Q-dots in their cytoplasm. Thus, the CFIA assay scores for the effect of drugs on the fusion of heterologous cells and detects inhibitors that block fusion of as few as two cells. The assay has >5-fold dynamic range. Scale bar: 100 μm c, CFIA image high content analysis pipeline. Images were analysed using the Harmony software (PerkinElmer). The cytoplasmic area, stained by the HCS Cell Mask Blue, was defined using the “Find Cytoplasm” analysis module (Harmony) and the number of either green or red spots was counted using the “Find Spots” analysis module (Harmony). All the cells that scored a nuclear area greater than 5 times the average area of a single nucleus and were simultaneously positive for at least two red and two green dots were considered as fused (highlighted in green). Data were expressed as a percentage of fused cells. d, Cumulative results of CFIA screening of FDA/EMA approved drug libraries. We screened two FDA/EMA-approved drug libraries, The Spectrum Collection, MS Discovery System, Inc. and the Prestwick Chemical Library, Prestwick Chemical; 2545 and 1280 individual small molecules respectively. The graph shows the cumulative results of the two screenings. The percentage of syncytia normalized on total cells is plotted as z score. Compounds with a z-score ≤-2.58 (red dotted line, 0.005%tail of the distribution) are shown in red, those between ≤-1.96 (0.025% tail, blue dotted line) and -2.58 are in blue. In the Prestwick collection, 34 drugs inhibited S-mediated fusion with a z score <-1.96, of which 8 with a z score of <-2.58. In the MS Discovery Spectrum collection, 54 drugs performed ataz score <1.96 of which 14 with a z score of <-2.58. All untreated controls for both libraries had a z score in the ± 0.40 range. e, Analytic evaluation of CFIA results. A correlation chart between the percentage of syncytia/well and the total number of cells/well is shown for the two screened drug libraries. Drugs showing a total number of cells at ≥2 standard deviations lower than the average of all drugs (red dotted line) considered toxic and not included in the subsequent analysis. Distribution of control wells (1% DMSO) is shown by a green box. f, Distribution frequency of the % of syncytia plotted as the number of drugs vs. the z score of the % of syncytia/well; toxic cells were excluded as in panel e. Blue dotted lines are at z scores ±1.96 and red dotted lines at z scores ±2.56. The numbers of drugs are shown. g, Correlation chart for the common drugs between the two libraries. Data are plotted as the z score of the % of syncytia/well. Blue and red lines are as above.
Extended Data Figure 3
Extended Data Figure 3. Results of SIA
a, Analysis of CFIA results. Correlation chart between the percentage of syncytia /well and the total number of cells/well. Data are presented as in Extended Data Fig. 2e. b, Distribution frequency of the screening results. Data are shown as in Extended Data Fig. 2f. c, Correlation chart for the common drugs between the two libraries. Data are shown as in Extended Data Fig. 2g. d, Representative immunofluorescence images for Spike protein (green), cell body (red, using HCS CellMask DeepRed) and nuclei (blue, Hoechst) of cells treated with the indicated drugs increasing syncytia formation compared to control, DMSO-treated cells. The number of syncytia is shown at the bottom of each image pair as percentages of total nuclei. Scale bar: 500 μm. Representative images in one of six wells. e, Dose-response effect on syncytia formation of Niclosamide, Clofazimine and Salinomycin. The graphs show the effect of different doses of the three drugs on syncytia formed by Vero and HEK/ACE2 cells in response to Spike expression. Cells were transfected with pEC117-Spike-V5 and, 12 hr later, treated with the indicated drug concentrations for additional 24 hr. Syncytia were quantified by HC microscopy and are expressed as percentage of cell nuclei (n=6 wells/dose; data are mean±SD). Cell viability was assessed by HC counts of the number of nuclei in each well.
Extended Data Figure 4
Extended Data Figure 4. Analysis of screening results.
a, Effect of individual drugs in the SIA screening grouped according to therapeutic classes. Data are z-scores from the screening of both libraries (drugs present in both libraries are duplicated). The dotted lines are at z-scores ±2.58 (red) and ±1.96 (blue). Antipsychotics, antidepressants and H1 histamine receptor antagonists exerted negative effects on syncytia formation. Another inhibitory drug class included cardiac glycosides, as Digitoxin, Ouabain, Lanatoside C and Digitoxigenin were all in the 0.025% tail of the distribution when used at 10 μM. On the contrary, antifungal drugs of the imidazole class had a trend to increase the frequency of syncytia. b, Venn diagram showing the drugs with z-scores <-2.58 from the results of the CFIA and SIA screenings using the two drug libraries, as indicated. Drugs in bold are those further tested on SARS-CoV-2 infection. CFIA and SIA are intrinsically different, as the former tests for plasma membrane fusion events between single, heterologous cells while the latter scores for the formation of larger syncytia.
Extended Data Figure 5
Extended Data Figure 5. Cell protective ability of drugs against SARS-CoV-2.
a, List of drugs (CAS # and chemical name) shortlisted from the syncytia assays and tested with infectious SARS-CoV-2. b, Effect of drugs on cell viability. Vero E6 cells were preincubated with a selection of drugs at 10 μM for 2 hr before 100 TCID50 of IC19 was added. After 5 days, cells were fixed in 4% PFA. Cells survival was quantified by densitometry as the total cell area/well (average of 2 replicates). Drugs labelled with Tox showed a cytotoxic effect at the used concentration independent of viral infection. Drugs in green were further tested for dose-dependent response. c, Dose-dependent cell protection of selected drugs against SARS-CoV-2 infection. Cells were preincubated with drugs or a negative DMSO control at different concentrations for 2 hr before 100 TCID50 of IC19 was added. After 3 days, cells were fixed in 4% PFA and cell survival was quantified by HC microscopy as the total cell area/well using DPC (Digital Phase Contrast) imaging (n=3). The image shows one of the replicates. Niclosamide and Salinomycin protected against virus-induced cell lysis across a wide range of concentrations from 5 μM down to 39 nM for Niclosamide and Salinomycin, while Clofazimine showed a dose dependent cytoprotective effect above 1 μM. For Sertraline and Deptropine, the cytoprotective effect was only above 2.5 μM and close to the drug-alone cytotoxic effects (which were assessed separately; not shown). d, Inhibition of SARS-CoV-2 viral replication by selected drugs in Calu-3 respiratory cells. Cells were preincubated with drugs (Niclosamide 2.5 μM, Clofazimine 5 μM and Salinomycin 2.5 μM) for 2 hr and then infected with SARS-CoV-2. After 1 hr, cells were washed with PBS and then cultured in fresh drug-containing medium for a further 48 hr. Virus production in the culture supernatants was quantified by plaque assay using Vero E6 cells. The graphs show virus production in the culture supernatants quantified by plaque assay using Vero E6 cells (mean±SEM; n=7). **P<0.01, one-way ANOVA with Bonferroni post-hoc correction. e, Representative images of syncytial Calu-3 cells positive for SARS-CoV-2 infection. Cells were immunostained for S-protein (green), and nuclei (blue). f, Inhibition of syncytia by Niclosamide after SARS-CoV-2 infection. Calu-3 cells were preincubated with Niclosamide 2.5 μM and then infected with SARS-CoV-2 in the presence of the drug. After 1 hr, cells were washed with PBS and then cultured in fresh drugcontaining medium. After 48 hr, cells were immunostained for Spike (green), Nucleocapsid (red) and nuclei (blue). Scale bar: 200 μm
Extended Data Figure 6
Extended Data Figure 6. Effect of drugs on Ca2+ oscillations
a, Amplitude of calcium transient peaks per group of 4 GCaMP-positive cells in average in at least twelve 180 μm ROI per condition. Vero cells co-transfected with GCaMP6s and either an empty vector (grey bars) or with Spike (green bars) and treated with the specified drugs. Data are expressed as ΔF/F; box: 25th-75th percentiles and median, whiskers: min-max values; **P<0.01, Kruskal-Wallis, two-sided, with Dunn’s correction for multiple comparisons. b, Distribution of transient frequencies of single cells in 400 min analysis. Data are expressed as percentage of cells. Results from at least 50 cells per condition are shown. *P<0.05, **P<0.01, Kruskal-Wallis, two-sided, with Dunn’s correction for multiple comparisons. c, Calcium transients over time in Vero cells co-transfected with GCaMP6s and either an empty vector (left panels) or with Spike (right panels) and the indicated treatment. Data are expressed as ΔF/F over time (min); every line is one of at least twelve 180 μm ROI per condition, representing a group of 4 GCaMP positive cells on average. d, Amplitude of calcium transient peaks per group of 4 GCaMP-positive cells on average in at least twelve 180 μm ROI per condition. Vero cells co-transfected with GCaMP6s and either an empty vector (grey bars) or with Spike (green bars) and treated as indicated. Data are expressed as ΔF/F; box: 25th-75th percentiles and median, whiskers: min-max values; **P<0.01, Kruskal-Wallis, two-sided, with Dunn’s correction for multiple comparisons.
Extended Data Figure 7
Extended Data Figure 7. Induction of Ca2+ oscillations by coronavirus Spike proteins and upon ACE2 and TMEM16F knockdown.
a and c, Calcium transients over time in Vero cells co-transfected with GCaMP6s and the indicated plasmids and siRNAs. Data are expressed as ΔF/F over time (min); every line is one of at least twelve 180 μm ROI per condition, representing a group of 4 GCaMP positive cells on average. b and d, Amplitude of calcium transient peaks per group of 4 GCaMP-positive cells in average in at least 12 180 μm ROI per condition. Data are expressed as ΔF/F; box: 25th-75th percentiles and median, whiskers: min-maxvalues; *P<0.05, **P<0.01, Kruskal-Wallis, two-sided, with Dunn’s correction for multiple comparisons.
Extended Data Figure 8
Extended Data Figure 8. Levels of expression of TMEM16Family members.
a, Expression profiles of the 10 known TMEM16 proteins in different cell types and primary human respiratory cells. RNA was prepared from the indicated cell lines and from primary bronchial human airway epithelial cells. Levels of mRNA quantified by real-time PCR are expressed relative to GAPDH mRNA. Data are mean±SEM of 3 independent experiments. b, Western blot showing the levels of TMEM16F and TMEM16A in basal conditions and upon overexpression, and after transfection of V5-tagged SARS-CoV-2 Spike. Beta-actin was used as a loading control. Representative blot of three independent repetitions. c, Expression of TMEM16A (upper panel) and TMEM16F (lower panel) in the presence of the top 5 selected drugs. RNA was prepared from the HEK293/ACE2 cells transfected either with Spike or control plasmids in the presence of the indicated drugs for 24 hr. The mRNA levels of TMEM16A and TMEM16F were quantified by real-time PCR and are expressed as fold over control condition (DMSO), after normalisation over the GAPDH housekeeping mRNA. Data are mean±SEM of 3 independent experiments.
Extended Data Figure 9
Extended Data Figure 9. Expression of TMEM16A,TMEM16F and ACE2 in different experimental conditions.
a, Levels of expression of the genes investigated in this study upon their individual knockdown in Vero, HEK293/ACE2 and Calu-3 cells. RNA was prepared from the different cell lines after transfection with the indicated siRNAs (siNT1-control non-targeting siRNA1) and mRNA levels were quantified by real-time PCR. Data are expressed as fold over mock-treated cells after normalized over the GAPDH housekeeping mRNA. Data are mean±SEM of 3 independent experiments. b, Western blotting analysis showing the levels of ACE2 and TMEM16F in the presence of Spike after silencing selected genes (ACE2, TMPRSS2, TMEM16A, TMEM16B, TMEM16E, TMEM16F and Xkr8). The amount of Spike, ACE2 and TMEM16F measured by immunoblotting is shown after cell treatment with the respective siRNAs. The levels of Spike, ACE2 and TMEM16F proteins were assessed by immunoblotting with anti-V5, anti-ACE2 and anti-TMEM16F antibodies respectively. Beta-actin was used as a loading control protein. Representative blot of three independent repetitions. c, Same as in panel b in HEK293/ACE2 cells. The blot with the anti-TMEM16A antibody did not detect any band of the expected mass (cf. also Extended Data Fig. 7b)
Extended Data Figure 10
Extended Data Figure 10. Current density and phosphatidylserine (PS) externalisation.
a, Results of whole-cell voltage-clamp recordings of HEK293 cells measuring current density in response to a voltage ramp. Currents were measured using a 500 ms voltage ramp from - 80 to +80 mV in Control cells (Cont; black trace, n = 34; same as controls for Fig. 4c-e; recorded with 28 mM intracellular calcium), in cells treated with the benchmark TMEM16 channel antagonist benzbromarone (Bbz, 10 mM; brown trace, n=3) or recorded with a low intracellular calcium concentration (Low [Ca], 0.5 mM; blue trace, n = 21) (n=4). The inset shows the current density measured at +75 mV (**P<0.01, Kruskal-Wallis, two-sided, with Dunn’s post hoc multiple comparisons). All values are displayed as mean±SEM. b and c, Inhibition of PS exposure after treatment TMEM16F siRNA and indicated drugs. Representative image of Vero cells reverse-transfected with the indicated siRNAs and stained for Annexin XII without (upper panels) or with (lower panel) ionomycin induction (10 μM). Annexin in green, phase contrast in grey, scale bar: 500 μm. Enlargement in c. Selected images and quantification in Figs. 4f and 4g. d, Representative image of Vero cells treated with 100 nM Niclosamide, 500 nM Clofazimine or 500 nM Salinomycin and stained for Annexin XII without (upper panels) or with (lower panel) ionomycin induction (5 μM). Annexin in green, phase contrast in grey, scale bar: 500 μm. Enlargement in b. Selected images and quantification in Figs. 5h and 5i. e, Annexin XII reactivity (PS externalisation) of syncytia expressing the Spike protein. Cells were transfected with the S-expressing plasmid and a plasmid expressing mCherry carrying a nuclear localisation signal (orange nuclei). Scale bar: 500 μm. Representative image of over 10 syncytia in at least 3 independent experiments.
Extended Data Figure 11
Extended Data Figure 11. TMEM16F is involved in SARS-CoV-2 Spike-induced syncytia formation
a and b, Inhibition of syncytia formation in Calu-3 cells by the downregulation of TMEM16F. Calu-3 cells were first silenced for each of the indicated genes or treated with siNTl (nontargeting siRNA1 as negative control) and then, after 24 hr, transfected to express the S-protein. After additional 24 hr, cells were immunostained for Spike (green) and nuclei (blue). Representative images are in a (scale bar: 500 μm), quantification in b. Data (mean±SD; n=3) are plotted as percentage of syncytia (cell area ≥ 20000 μm2) normalized on the total number of cells and expressed as fold over mock (lipid-only)-treated cells. *P<0.05, **P<0.01, one-way ANOVA with Dunnett post-hoc correction. c and d. Effect of individual siRNAs forming the Dharmacon siRNA Pool against TMEM16F (ANO6). The picture shows the efficiency of syncytia formation after transfection of Spike cDNA in Vero cells in which TMEM16F was downregulated using the 4-siRNA Pool (which was used in all the other experiments in this study) or the individual siRNAs forming this Pool (siDH_1-4). We found that the commercial siDH_2 siRNA does not match with the TMEM16F sequence. Data in panel d are mean±SD, plotted as percentage of syncytia (cell area ≥ 20000 μm2) normalized on the total number of cells and expressed as fold over mock (lipid-only)-treated cells. **P<0.01, one-way ANOVA with Dunnett post-hoc correction. e and f, Effect of selected siRNAs on MERS-CoV and SARS-CoV-2-induced syncytia formation. Vero cells were first silenced for each of the indicated genes (ACE2 and TMEM16F) or treated with siNT1 (non-targeting siRNA1 as negative control) and then, after 24 hr, transfected to express the either MERS or SARS-CoV Spike protein. After additional 24 hr, cells were immunostained for nuclei (white). Representative images are in in the panels on the left side, quantification in the bar chart on the right side. Data (mean±SEM; n=3) are plotted as percentage of syncytia normalized on the total number of cells and expressed as fold over mock (lipid-only)-treated cells. *P<0.05, **P<0.01, one-way ANOVA with Bonferroni post-hoc correction. g, TMEM16F overexpression induces S-mediated syncytia formation. HEK293/ACE2 cells were co-transfected with human TMEM16A or TMEM16F together with a Spike-expressing plasmid. After additional 24 hr, cells were immunostained for Spike (green), TMEM16F (red) and nuclei (blue). Selected images and quantification in Figs. 5I and 5m. Scale bar: 200 μm.
Figure 1
Figure 1. Drugs inhibiting SARS-CoV-2 Spike-induced syncytia.
a, Post-mortem histological analysis of lungs of COVID-19 patients showing multinucleated syncytia, ×40. Further information is in ref.. b, Formation of syncytia after 24 hr Spike expression in Vero cells (nuclei in white, cell contours in red using wheat germ agglutinin (WGA), Spike in green. Scale bar: 200 μm. c, Syncytia Inhibition Assay (SIA). d, Image analysis workflow; syncytia were defined as cells showing a cluster of nuclei with an area ≥5 times larger than the average of the area of non-fused cells. Scale bar: 500 μm e, Results of SIA screening. The percentage of syncytia normalized on total cells is plotted as z score. Compounds with a z-score ≤-2.58 (red dotted line, 0.005% tail) are shown in red, those between ≤-l.96 (0.025% tail, blue dotted line) and -2.58 in blue. Four drugs that were further studied with viral infection are indicated (NIC: Niclosamide; SAL: Salinomycin; CLO: clofazimine; SER: sertraline). f, Effect of Niclosamide on syncytia. Spike-positive syncytia are in green, nuclei in blue, cell body in red using HCS CellMask DeepRed. The percentage of nuclei within in syncytia over total nuclei is shown at the bottom. Scale bar: 500 μm. Numbers on some of the images indicate the screening well. Representative image of 25/well, screening performed in duplicate.
Figure 2
Figure 2. Effects of drugs on SARS-CoV-2 replication and intracellular calcium oscillations.
a, Inhibition of SARS-CoV-2 replication. Vero E6 cells were treated with the indicated drug concentrations for 2 hr, followed by the addition of SARS-CoV-2 (MOI 0.05). Data are mean±SD; n=3. After 1 hr, cells were washed and cultured in drug-containing medium for 48 hr. Virus production in the culture supernatants was quantified by plaque assay using Vero E6 cells. b, Representative frames (from of a total of 600) from a 12-hr time lapse movie of a coculture of Vero cells expressing the GCaMP6s Ca2+ sensor and U2OS cells transfected with Spike and mCherry. Arrows indicate Ca2+ oscillations in GCaMP6s-ACE2 expressing cells when fusing to Spike-expressing cells. The movie is in Supplementary Information Video 4. c, Ca2+ oscillations during syncytia formation. Representative frames (from of a total of 400) from a 12-hr time lapse movie of Spike-expressing Vero cells. Arrows point at cells progressively fusing to a syncytium and showing intense Ca2+ spikes. The movie is in Supplementary Information Video 5, upper left panel (DMSO control). d, GCaMP intensity over time. Vero cells were co-transfected with GCaMP6s and either a control or a Spike-expressing vector and treated with the indicated drugs. Data are expressed as ΔF/F over time (min); every line is one of at least twelve 180 μm2 ROI per condition, representing a group of 4 GCaMP-positive cells on average. Representative movies are in Supplementary Information Video 5.
Figure 3
Figure 3. Calcium oscillations, chloride channel activityand requirement of TMEM16F protein for Spike-mediated cell-cell fusion
a and b, Effect of Ca2+ depletion or treatment with thapsigargin (TG) or cyclopiazonic acid (CPA) on syncytia (cell area≥20,000 μm2). Scale bar: 500 μm. Mean±SD; n=4. **P<0.01, one-wayANOVAwith Bonferroni post-hoc. c-e, Niclosamide-sensitive current is boosted by Spike/ACE2 and inhibited by TMEM16F knockdown. Currents were measured using a voltage ramp in HEK293 cells. In c, currents from control cells (black trace) were blocked by 2 μM Niclosamide (NIC; blue). Inset shows current density at +75 mV for control cells (C, n=34 cells) and cells treated with Niclosamide (NIC, n=7), Salinomycin (SAL, n=8) and Clofazimine (CLO, n=9). **P<0.01, Kruskal-Wallis, two-sided, with Dunn’s post hoc. In d, cells transfected with control siRNA (siNTl; black, n=24) or TMEM16F siRNA (blue, n=17). Inset shows current density at +75 mV. **P<0.01, Mann Whitney, two-sided. In e, cells transfected with EGFP (black, n=34; same as in c) or EGFP/Spike/ACE2 (red, n=29). Inset shows current density at +75 mV. *P<0.05, Mann Whitney, two-sided. All value: mean±SEM. f and g, Annexin XII after TMEM16F knockdown (n=3). Scale bar: 500 μm. Statistics as in b. h and i, Annexin XII after treatment with Niclosamide 100 nM, Clofazimine or Salinomycin 500 nM (n=3). Scale bar: 500 μm. Statistics as in b. j and k, Inhibition of syncytia by siRNAs. Cells treated with the indicated siRNAs and, after 24 hr, transfected to express Spike (n=3). Scale bar: 200 μm. Mean±SD. *P<0.05, **P<0.01, one-way ANOVA with Dunnett post-hoc. I and m, Overexpression of TMEM16F induces syncytia. HEK293/ACE2 cells were cotransfected with Spike and TMEM16A or TMEM16F (n=3). Statistics as in b. n and p, Inhibition of SARS-CoV-2 infection by siRNAs. Calu-3 cells were silenced for the indicated genes and, after 48 hr, infected with SARS-CoV-2 (MOI 0.5). One hr after infection, cells were washed and incubated with fresh medium. After 48 hr, cells were immunostained for Spike and Nucleocapsid. Scale bar: 500 μm. Mean±SEM; n=4. **P<0.01, one-way ANOVA with Dunnett post-hoc. q, Model showing the effect of drugs on syncytia and TMEM16F. Spike-expressing cells have increase Ca2+ (in orange) oscillations, leading to increased TMEM16F activity, which itself boosts Ca2+ levels. As a consequence, chloride (blue) secretion is increased, and PS (pink) is externalised. Drugs blocking TMEM16F or blunting Ca2+ release inhibit Spike-induced syncytia.

References

    1. Levi M, Thachil J, Iba T, Levy JH. Coagulation abnormalities and thrombosis in patients with COVID-19. Lancet Haematol. 2020;7:e438–e440. doi: 10.1016/S2352-3026(20)30145-9. - DOI - PMC - PubMed
    1. Goyal P, et al. Clinical Characteristics of Covid-19 in New York City. N Engl J Med. 2020;382:2372–2374. doi: 10.1056/NEJMc2010419. - DOI - PMC - PubMed
    1. Jose RJ, Manuel A. COVID-19 cytokine storm: the interplay between inflammation and coagulation. Lancet Respir Med. 2020 doi: 10.1016/S2213-2600(20)30216-2. - DOI - PMC - PubMed
    1. Edler C, et al. Dying with SARS-CoV-2 infection-an autopsy study of the first consecutive 80 cases in Hamburg, Germany. Int J Legal Med. 2020;134:1275–1284. doi: 10.1007/s00414-020-02317-w. - DOI - PMC - PubMed
    1. Hoffmann M, et al. SARS-CoV-2 Cell Entry Depends on ACE2 and TMPRSS2 and Is Blocked by a Clinically Proven Protease Inhibitor. Cell. 2020;181:271–280.:e278. doi: 10.1016/j.cell.2020.02.052. - DOI - PMC - PubMed

Publication types

MeSH terms