. 2021 Apr 7;9(1):62.
doi: 10.1186/s40478-021-01175-w.

Streamlined alpha-synuclein RT-QuIC assay for various biospecimens in Parkinson's disease and dementia with Lewy bodies

Affiliations

Streamlined alpha-synuclein RT-QuIC assay for various biospecimens in Parkinson's disease and dementia with Lewy bodies

Connor Bargar et al. Acta Neuropathol Commun. .

Abstract

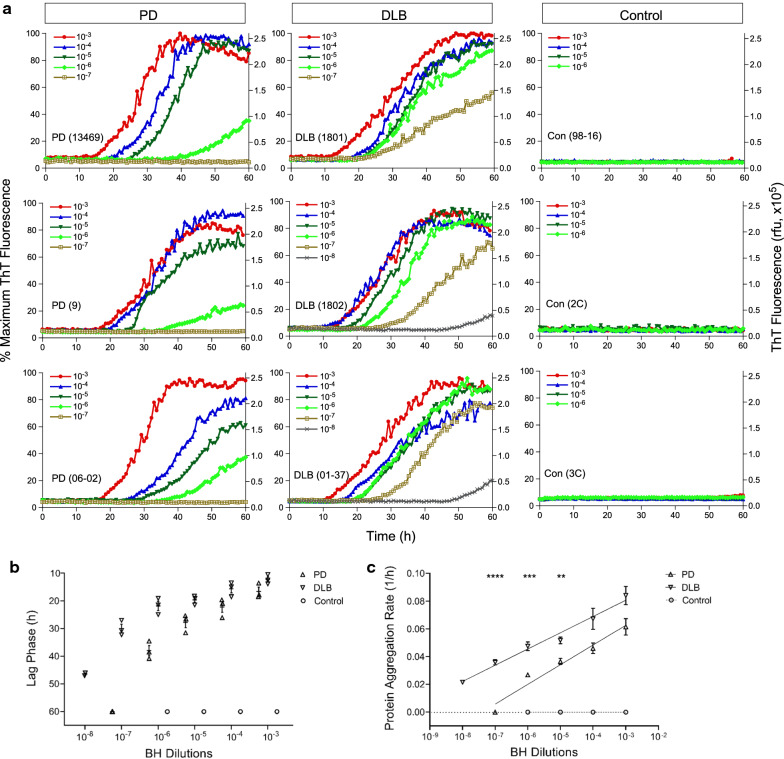
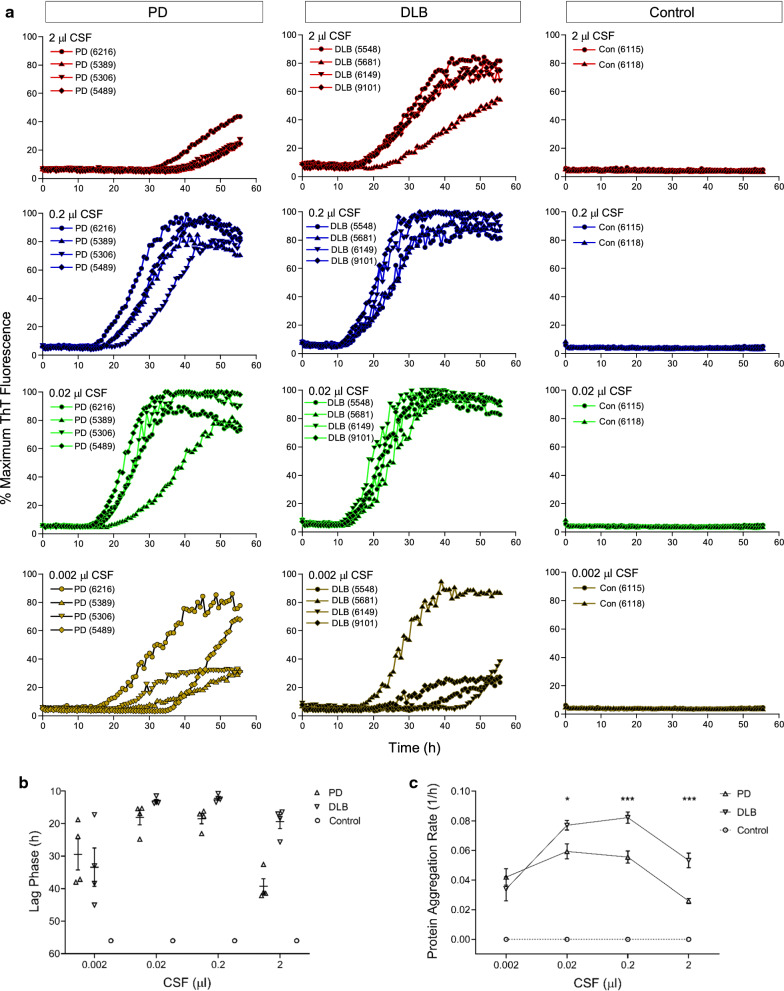
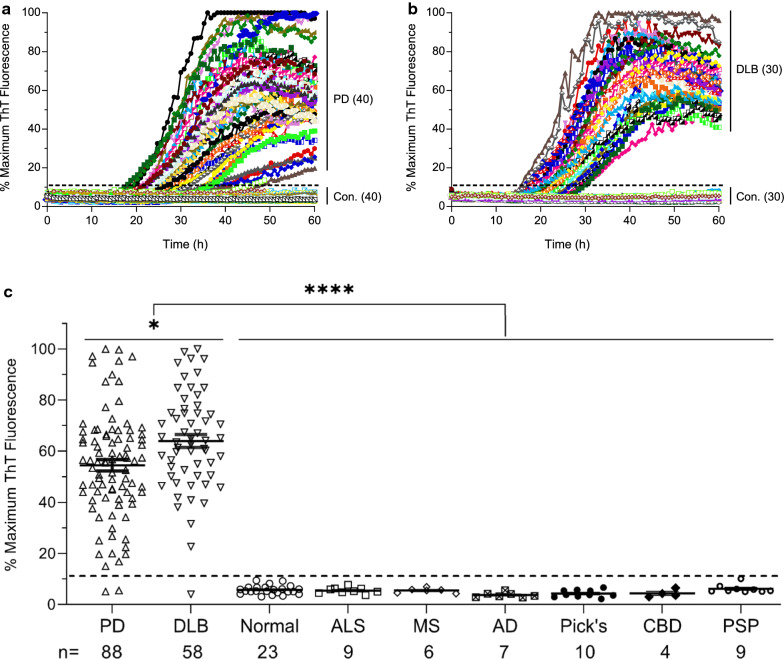
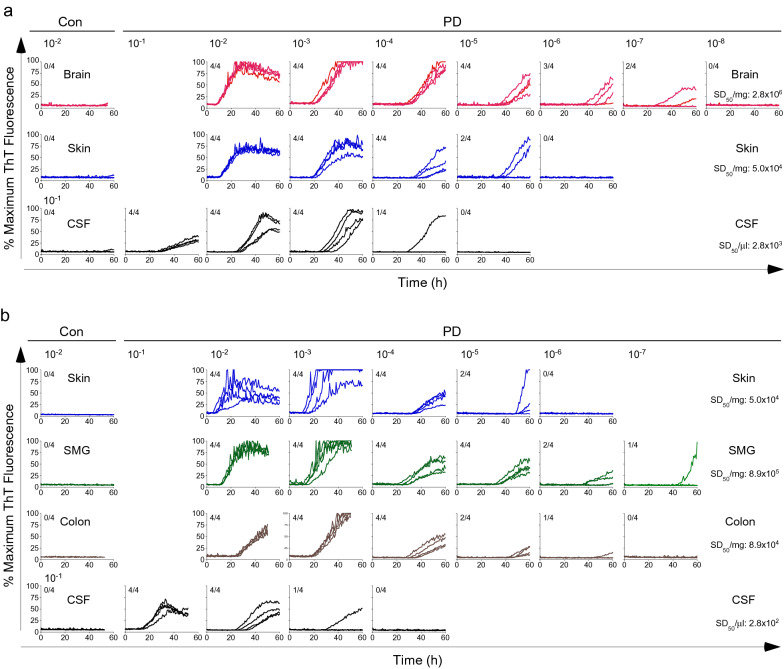
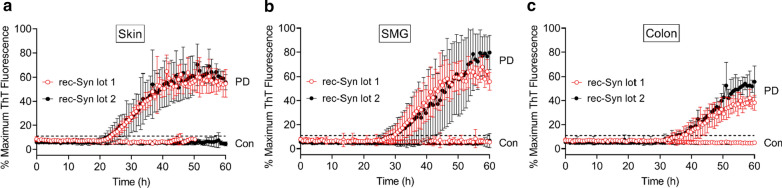
Definitive diagnosis of Parkinson's disease (PD) and dementia with Lewy bodies (DLB) relies on postmortem finding of disease-associated alpha-synuclein (αSynD) as misfolded protein aggregates in the central nervous system (CNS). The recent development of the real-time quaking induced conversion (RT-QuIC) assay for ultrasensitive detection of αSynD aggregates has revitalized the diagnostic values of clinically accessible biospecimens, including cerebrospinal fluid (CSF) and peripheral tissues. However, the current αSyn RT-QuIC assay platforms vary widely and are thus challenging to implement and standardize the measurements of αSynD across a wide range of biospecimens and in different laboratories. We have streamlined αSyn RT-QuIC assay based on a second generation assay platform that was assembled entirely with commercial reagents. The streamlined RT-QuIC method consisted of a simplified protocol requiring minimal hands-on time, and allowing for a uniform analysis of αSynD in different types of biospecimens from PD and DLB. Ultrasensitive and specific RT-QuIC detection of αSynD aggregates was achieved in million-fold diluted brain homogenates and in nanoliters of CSF from PD and DLB cases but not from controls. Comparative analysis revealed higher seeding activity of αSynD in DLB than PD in both brain homogenates and CSF. Our assay was further validated with CSF samples of 214 neuropathologically confirmed cases from tissue repositories (88 PD, 58 DLB, and 68 controls), yielding a sensitivity of 98% and a specificity of 100%. Finally, a single RT-QuIC assay protocol was employed uniformly to detect seeding activity of αSynD in PD samples across different types of tissues including the brain, skin, salivary gland, and colon. We anticipate that our streamlined protocol will enable interested laboratories to easily and rapidly implement the αSyn RT-QuIC assay for various clinical specimens from PD and DLB. The utilization of commercial products for all assay components will improve the robustness and standardization of the RT-QuIC assay for diagnostic applications across different sites. Due to ultralow sample consumption, the ultrasensitive RT-QuIC assay will facilitate efficient use and sharing of scarce resources of biospecimens. Our streamlined RT-QuIC assay is suitable to track the distribution of αSynD in CNS and peripheral tissues of affected patients. The ongoing evaluation of RT-QuIC assay of αSynD as a potential biomarker for PD and DLB in clinically accessible biospecimens has broad implications for understanding disease pathogenesis, improving early and differential diagnosis, and monitoring therapeutic efficacies in clinical trials.

Keywords: Alpha-synuclein; Biomarker; Biospecimens; Cerebrospinal fluid; Colon; Dementia with Lewy bodies; Parkinson’s disease; RT-QuIC; Salivary gland; Skin.


Conflict of interest statement

The authors declare that they have no competing interests.

Figures

Fig. 1
Fig. 1
αSyn RT-QuIC analysis of PD and DLB brain samples. a αSyn RT-QuIC spectra of BH from neuropathologically confirmed cases of PD (n = 3, left panels), DLB (n = 3, middle panels), and NS controls (n = 3, right panels). Case numbers were indicated in parentheses. Two µl of BH diluted to 10–3 through 10–8 (w/v) was used for seeding RT-QuIC reactions in quadruplicate. Average RT-QuIC reactivity was shown for individual BH dilutions of each of 3 cases tested in quadruplicate. Data were expressed as percentages of the maximum ThT fluorescence (left Y-axis), with corresponding relative fluorescence units (rfu, right Y-axis). b Lag phase of RT-QuIC reactions from individual dilutions of PD, DLB, and control samples. RT-QuIC spectra for individual dilutions of each case in a were used to obtain the time (h) required for the average fluorescence to excess the threshold of RT-QuIC reactions (11% or 30,000 rfu). For negative reactions that did not reach threshold during the assay, lag phase was assigned as 60 h. Shown were individual time points with error bars of means ± S.E. plotted against log-dilution series. c Protein aggregation rate (PAR) of RT-QuIC reactions from individual dilutions of PD, DLB, and control samples. Lag phase data (h) in b were converted to PAR (1/h). Shown were average rate values and error bars of S.E. Semi-log linear regression lines were applied to the PD (r2 = 0.91) and DLB (r2 = 0.88) groups. For negative reactions (assigned with a lag phase of 60 h), the rate was set at 0 (dotted line). **p < 0.01, ***p < 0.005, ****p < 0.001
Fig. 2
Fig. 2
Ultrasensitive αSyn RT-QuIC assay of CSF samples of PD and DLB. a αSyn RT-QuIC spectra of postmortem CSF from neuropathologically confirmed cases of PD (n = 4, left panels), DLB (n = 4, middle panels), and NS controls (n = 2, right panels). Case numbers were indicated in parentheses. RT-QuIC reactions were seeded with 2 µl of CSF either undiluted or serially diluted to 10–1 through 10–3 (v/v), equivalent to 2–0.002 µl of original CSF. Average RT-QuIC reactivity was shown for individual CSF titrations in 4 cases of PD, 4 cases of DLB, and 2 cases of NS controls tested in quadruplicate. Data were expressed as percentages of the maximum ThT fluorescence. b Lag phase of RT-QuIC reactions seeded with individual CSF levels in PD, DLB, and control samples. RT-QuIC spectra for individual CSF levels of each case in a were used to obtain the time required for the average fluorescence to excess the threshold of RT-QuIC reactions (11% or 30,000 rfu). Shown were individual time points with error bars of means ± S.E. plotted against CSF levels. c Protein aggregation rate of RT-QuIC reactions seeded with individual CSF levels in PD, DLB, and control samples. Lag phase data (h) in b were converted to protein aggregation rate (1/h). Shown were average rate values and error bars of S.E. For negative reactions, the rate was set at 0 (dotted line). *p < 0.05, ***p < 0.005
Fig. 3
Fig. 3
Analytical performance of αSyn RT-QuIC assay for a large collection of CSF samples from neuropathologically confirmed cases of PD, DLB, and NS controls. a RT-QuIC spectra of postmortem CSF samples from 40 cases of neuropathologically confirmed PD patients and 40 NS controls. b RT-QuIC spectra of postmortem CSF from 30 cases of DLB patients and 30 NS controls. c Scattered plot of RT-QuIC reactivity as percentages of maximum ThT fluorescence at the end of 60 h assay of 214 neuropathologically confirmed CSF cases, including those with PD (n = 88) and DLB (n = 58), as well as NS control cases (n = 68) including those neurologically normal (n = 23), and those with amyotrophic lateral sclerosis (ALS, n = 9), multiple sclerosis (MS, n = 6), Alzheimer’s disease (AD, n = 7), Pick’s disease (n = 10), corticobasal degeneration (CBD, n = 4), and progressive supranuclear palsy (PSP, n = 9). Horizontal bars were means ± S.E. of ThT fluorescence for each group of CSF cases. The dotted line represents the threshold (11%) defining the positive and negative cases. All RT-QuIC reactions were seeded with 200 nl of CSF (2 µl of tenfold-diluted CSF) in quadruplicate wells per sample. *p < 0.05 comparing PD with DLB, **** p < 0.0001 comparing the combined PD and DLB group with all of the NS controls
Fig. 4
Fig. 4
Comparative analyses of αSynD seeding activity in multiple biospecimens of PD by end-point dilution RT-QuIC assay. a RT-QuIC spectra of a neuropathologically confirmed case of PD and a NS control affected by AD (Con) using serially diluted homogenates of the brain and scalp skin, as well as CSF. b RT-QuIC spectra of a neuropathologically confirmed case of PD and a NS control without any neurological disease (Con) using serially diluted homogenates of scalp skin, SMG, and sigmoid colon, as well as CSF. The tenfold serially dilutions were indicated on the top of a and b, and 2 µl from the designated dilutions was used to titrate RT-QuIC reactivity to background levels within 50–60 h. Shown were ThT fluorescence traces from 4 replicate reactions at the designated dilutions. The fractions in the upper left corner of each graph indicated the ThT-positive/total replicate reactions. A threshold of 11% was used to define the positive and negative reactivity. SD50 values (per mg or µl) derived from Spearman-Kärber analyses of end-point dilution results for the PD cases were shown for each type of biospecimens on the right
Fig. 5
Fig. 5
Reliability of RT-QuIC assay for PD biospecimens using different batches of rec-Syn substrate. a RT-QuIC spectra of scalp skin homogenate from a case of neuropathologically confirmed PD or a NS control without any neurological disease using two different batches of rec-Syn substrate (lot 1 and lot 2). Individual traces were means ± SD of ThT fluorescence from the PD skin sample (PD) assayed with rec-Syn lot 1 and lot 2 (n = 6 for both lots) or the control skin sample (Con) assayed with rec-Syn lot 1 (n = 3) and lot 2 (n = 6). b RT-QuIC spectra of SMG homogenate from the same PD and control cases as in a using rec-Syn lot 1 and lot 2. Individual traces were means ± SD of ThT fluorescence from the PD SMG sample (PD) assayed with rec-Syn lot 1 (n = 6) and lot 2 (n = 4) or the control SMG sample (Con) assayed with rec-Syn lot 1 and lot 2 (n = 6 for both lots). c RT-QuIC spectra of sigmoid colon homogenate from the same PD and control cases as in a using rec-Syn lot 1 and lot 2. Individual traces were means ± SD of ThT fluorescence from the PD colon sample (PD) assayed with rec-Syn lot 1 and lot 2 (n = 4 for both lots) or the control colon sample (Con) assayed with rec-Syn lot 1 (n = 5) and lot 2 (n = 4). The dotted line represents the threshold of positivity (11%). The specific batches of rec-Syn substrate used were lot 1 (082517AS) and lot 2 (111317AS) from rPeptide. RT-QuIC assay of skin, SMG, and sigmoid colon specimens was performed using the same protocol as described in Methods, in which 2 µl of tissue homogenates diluted to 10–3 (w/v) was used to seed each reaction

Similar articles

Cited by

References

    1. Chen-Plotkin AS, Albin R, Alcalay R, Babcock D, Bajaj V, Bowman D et al (2018) Finding useful biomarkers for Parkinson's disease. Science Transl Med 10:eaam6003. - PMC - PubMed
    1. Braak H, Del Tredici K, Rub U, de Vos RA, Jansen Steur EN, Braak E. Staging of brain pathology related to sporadic Parkinson's disease. Neurobiol Aging. 2003;24:197–211. doi: 10.1016/S0197-4580(02)00065-9. - DOI - PubMed
    1. Outeiro TF, Koss DJ, Erskine D, Walker L, Kurzawa-Akanbi M, Burn D, et al. Dementia with Lewy bodies: an update and outlook. Mol Neurodegener. 2019;14:5. doi: 10.1186/s13024-019-0306-8. - DOI - PMC - PubMed
    1. Henderson MX, Trojanowski JQ, Lee VM. α-Synuclein pathology in Parkinson's disease and related α-synucleinopathies. Neurosci Lett. 2019;709:134316. doi: 10.1016/j.neulet.2019.134316. - DOI - PMC - PubMed
    1. Kalia LV. Diagnostic biomarkers for Parkinson's disease: focus on α-synuclein in cerebrospinal fluid. Parkinsonism Relat Disord. 2019;59:21–25. doi: 10.1016/j.parkreldis.2018.11.016. - DOI - PubMed

Publication types

Substances