

Intracellular action potential recordings from cardiomyocytes by ultrafast pulsed laser irradiation of fuzzy graphene microelectrodes
- PMID: 33827809
- PMCID: PMC8026128
- DOI: 10.1126/sciadv.abd5175
Intracellular action potential recordings from cardiomyocytes by ultrafast pulsed laser irradiation of fuzzy graphene microelectrodes
Abstract
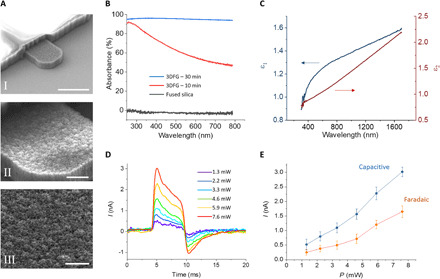
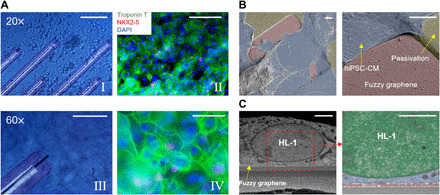
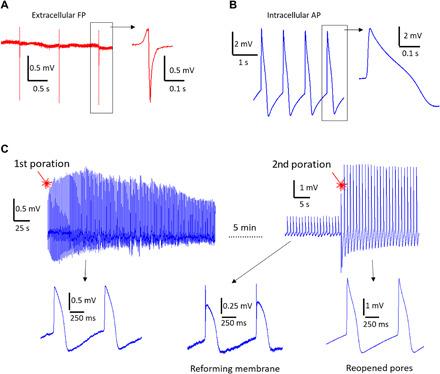
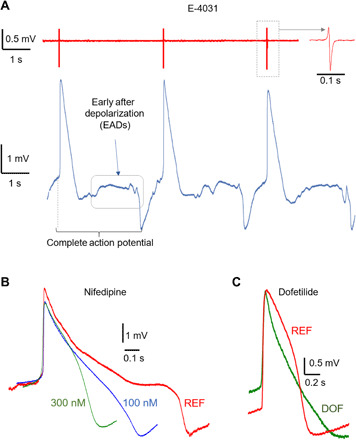
Graphene with its unique electrical properties is a promising candidate for carbon-based biosensors such as microelectrodes and field effect transistors. Recently, graphene biosensors were successfully used for extracellular recording of action potentials in electrogenic cells; however, intracellular recordings remain beyond their current capabilities because of the lack of an efficient cell poration method. Here, we present a microelectrode platform consisting of out-of-plane grown three-dimensional fuzzy graphene (3DFG) that enables recording of intracellular cardiac action potentials with high signal-to-noise ratio. We exploit the generation of hot carriers by ultrafast pulsed laser for porating the cell membrane and creating an intimate contact between the 3DFG electrodes and the intracellular domain. This approach enables us to detect the effects of drugs on the action potential shape of human-derived cardiomyocytes. The 3DFG electrodes combined with laser poration may be used for all-carbon intracellular microelectrode arrays to allow monitoring of the cellular electrophysiological state.
Copyright © 2021 The Authors, some rights reserved; exclusive licensee American Association for the Advancement of Science. No claim to original U.S. Government Works. Distributed under a Creative Commons Attribution NonCommercial License 4.0 (CC BY-NC).
Figures
References
-
- Müller J., Ballini M., Livi P., Chen Y., Radivojevic M., Shadmani A., Viswam V., Jones I. L., Fiscella M., Diggelmann R., Stettler A., Frey U., Bakkum D. J., Hierlemann A., High-resolution CMOS MEA platform to study neurons at subcellular, cellular, and network levels. Lab Chip 15, 2767–2780 (2015). - PMC - PubMed
-
- Abbott J., Ye T., Qin L., Jorgolli M., Gertner R. S., Ham D., Park H., CMOS nanoelectrode array for all-electrical intracellular electrophysiological imaging. Nat. Nanotechnol. 12, 460–466 (2017). - PubMed
-
- Zhao Y., You S. S., Zhang A., Lee J.-H., Huang J., Lieber C. M., Scalable ultrasmall three-dimensional nanowire transistor probes for intracellular recording. Nat. Nanotechnol. 14, 783–790 (2019). - PubMed
-
- Dipalo M., Amin H., Lovato L., Moia F., Caprettini V., Messina G. C., Tantussi F., Berdondini L., De Angelis F., Intracellular and extracellular recording of spontaneous action potentials in mammalian neurons and cardiac cells with 3D plasmonic nanoelectrodes. Nano Lett. 17, 3932–3939 (2017). - PMC - PubMed
-
- Rastogi S. K., Raghavan G., Yang G., Cohen-Karni T., Effect of graphene on nonneuronal and neuronal cell viability and stress. Nano Lett. 17, 3297–3301 (2017). - PubMed
Publication types
LinkOut - more resources
Full Text Sources
Other Literature Sources
