. 2021 Apr 7;6(58):eabg0833.
doi: 10.1126/sciimmunol.abg0833.

SARS-CoV-2 drives JAK1/2-dependent local complement hyperactivation

Affiliations

SARS-CoV-2 drives JAK1/2-dependent local complement hyperactivation

Bingyu Yan et al. Sci Immunol. .

Abstract

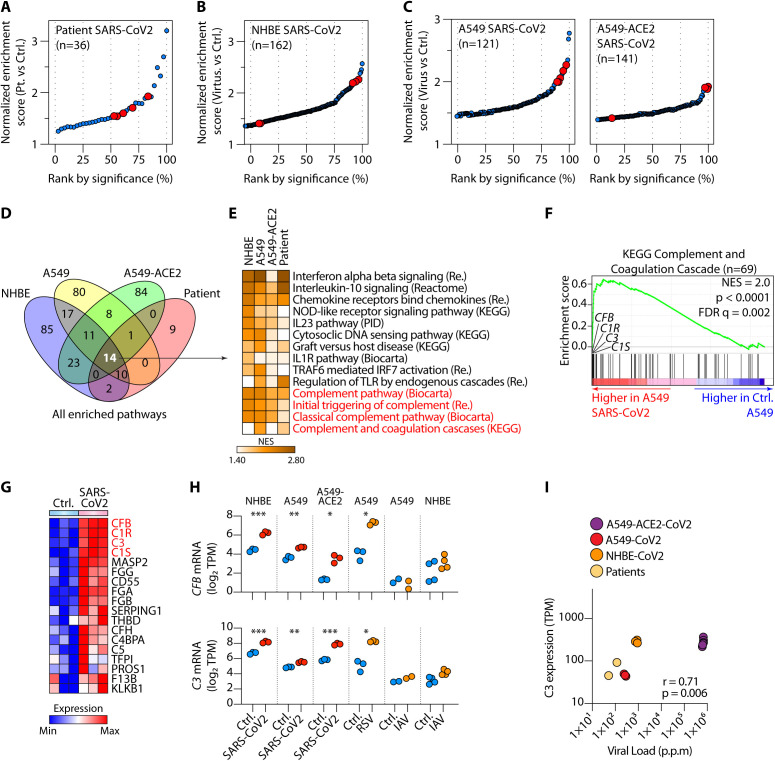
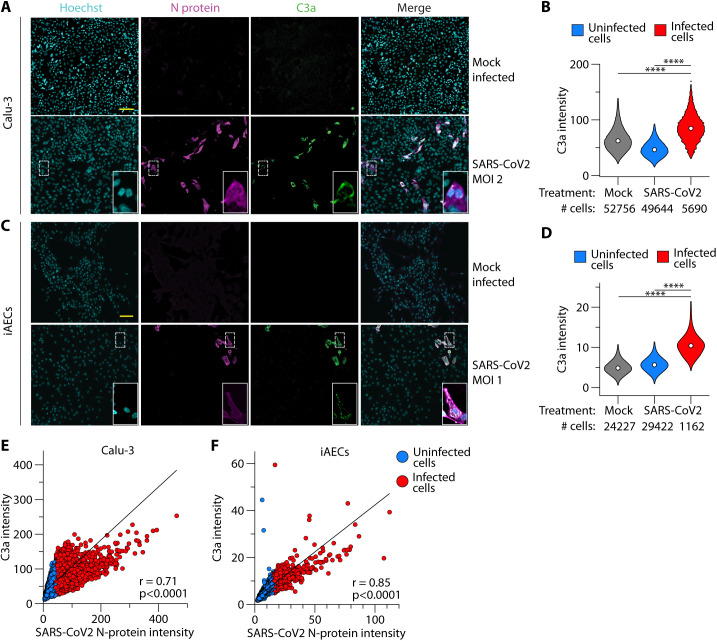
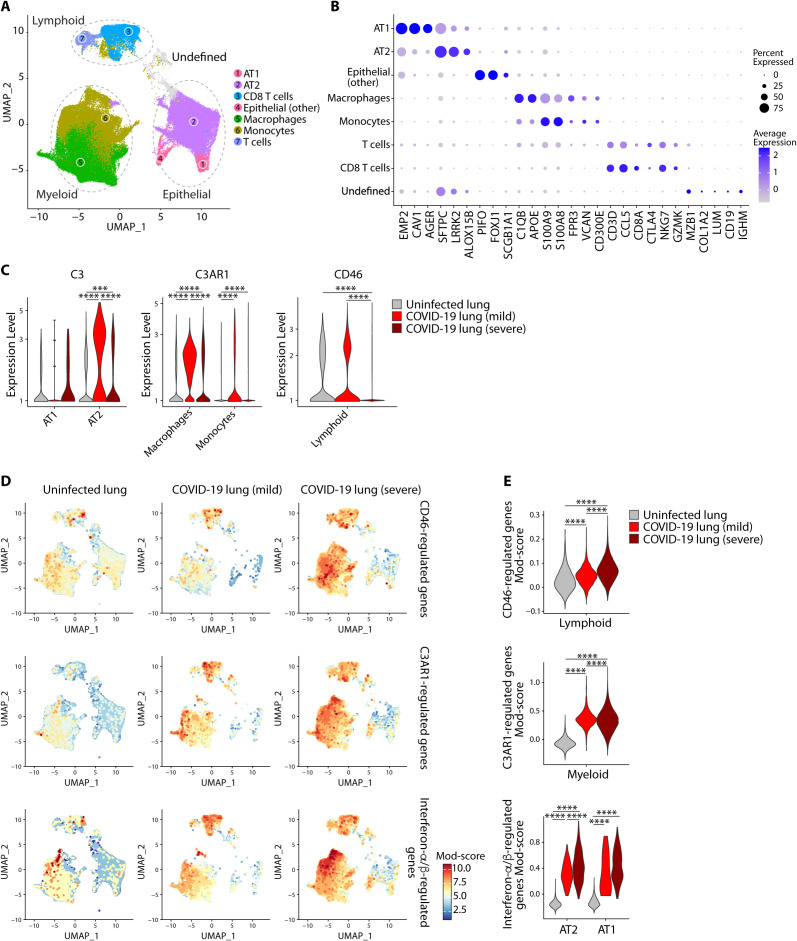
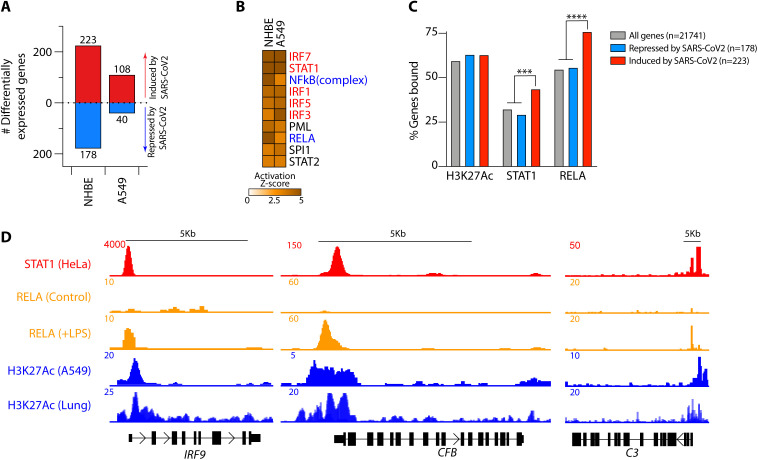
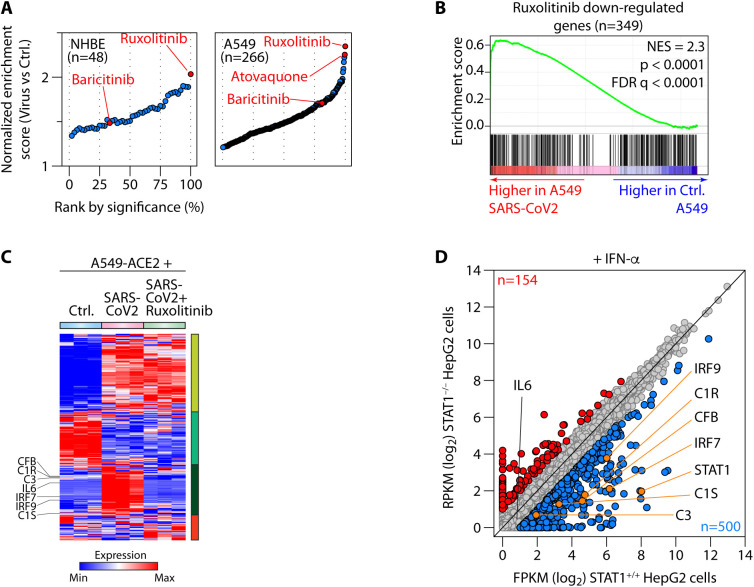
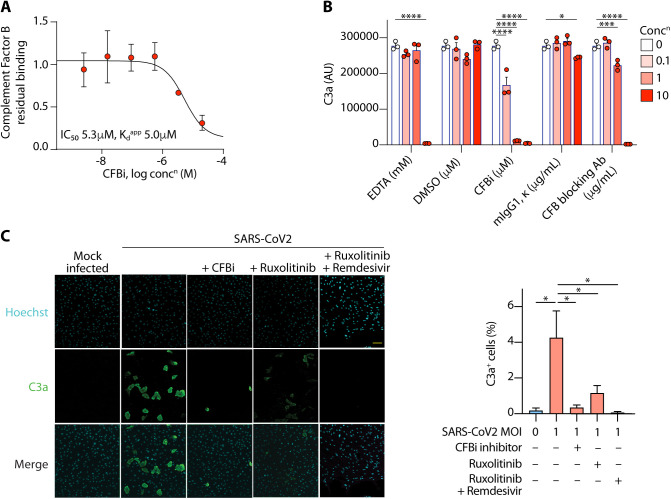
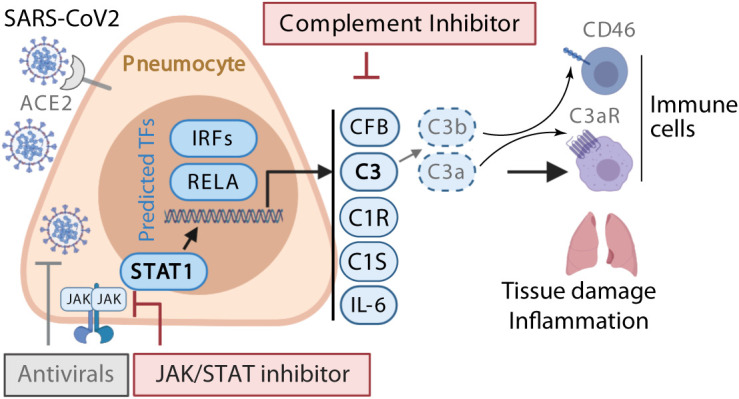
Patients with coronavirus disease 2019 (COVID-19) present a wide range of acute clinical manifestations affecting the lungs, liver, kidneys and gut. Angiotensin converting enzyme (ACE) 2, the best-characterized entry receptor for the disease-causing virus SARS-CoV-2, is highly expressed in the aforementioned tissues. However, the pathways that underlie the disease are still poorly understood. Here, we unexpectedly found that the complement system was one of the intracellular pathways most highly induced by SARS-CoV-2 infection in lung epithelial cells. Infection of respiratory epithelial cells with SARS-CoV-2 generated activated complement component C3a and could be blocked by a cell-permeable inhibitor of complement factor B (CFBi), indicating the presence of an inducible cell-intrinsic C3 convertase in respiratory epithelial cells. Within cells of the bronchoalveolar lavage of patients, distinct signatures of complement activation in myeloid, lymphoid and epithelial cells tracked with disease severity. Genes induced by SARS-CoV-2 and the drugs that could normalize these genes both implicated the interferon-JAK1/2-STAT1 signaling system and NF-κB as the main drivers of their expression. Ruxolitinib, a JAK1/2 inhibitor, normalized interferon signature genes and all complement gene transcripts induced by SARS-CoV-2 in lung epithelial cell lines, but did not affect NF-κB-regulated genes. Ruxolitinib, alone or in combination with the antiviral remdesivir, inhibited C3a protein produced by infected cells. Together, we postulate that combination therapy with JAK inhibitors and drugs that normalize NF-κB-signaling could potentially have clinical application for severe COVID-19.


Figures

Fig. 1
Fig. 1
SARS-CoV-2 infection activated complement transcription in lung epithelial cells. (A-B) Significantly enriched pathways by gene set enrichment analysis (GSEA) comparing transcriptomes of lung samples from SARS-CoV-2 infected patients (n=2) versus uninfected controls (A) and similar GSEA analyses on normal human bronchial epithelial (NHBE) cells infected in vitro, or not, with SARS-CoV-2 (n=3) (B). (C) GSEA of A549 cells transduced with ACE2 (A549-ACE2) or not (A549), comparing cells infected with SARS-CoV-2 versus control cells (n=3 or 4). Pathways in A-C were ranked by significance (false-discovery rate FDR q-values), with complement pathways highlighted in red. Only enriched pathways with FDR <0.25 are shown. (D-E) Comparison of all pathways significantly induced (FDR q-value < 0.25) by SARS-CoV-2 in patients (A), NHBE cells (B), A549 and A549-ACE2 cells (C), indicating 14 shared enriched pathways (D) and their normalized enrichment score (NES) displayed as a heatmap, with complement pathways highlighted in red (E). (F-G) Representative GSEA plot for one of the complement pathways in (E) and expression of the leading-edge genes from this pathway, with C3, C1R, C1S and CFB highlighted in red (G). (H) Expression of CFB (upper panel) and C3 (lower panel) mRNA in control (Ctrl.) versus SARS-CoV-2-infected cells. (I) Spearman correlation between C3 mRNA expression and SARS-CoV-2 viral load across virus bearing samples in Fig. 1A-H. p.p.m: parts per million mapped reads. Data have been sourced from GSE147507. *p <0.05, ** p <0.01, ***p < 0.001, by ANOVA.
Fig. 2
Fig. 2. SARS-CoV-2 infection generated C3a protein in lung epithelial cells.
(A-D) Confocal images (A and C) and quantification (B and D) from n=2 independent experiments showing expression of C3a and SARS-CoV-2 N-protein in SARS-CoV-2-treated or mock-infected Calu-3 cells (A and B) or induced pleuripotent stem cell-derived alveolar epithelial type 2 cells (iAEC2s) (C and D). Scale bars in A and C indicates 100m. Cell numbers are indicated below each violin and median values denoted by dots in B and D. (E-F) correlation between SARS-CoV-2 N-protein intensity and C3a intensity on a per cell basis in Calu-3 cells (E) and iAEC2s (F). Indicated are Pearson correlation coefficients and associated p-values. Infected and uninfected cells in (B-D) have been distinguished by red and blue fills, respectively. ****p<0.0001 by ANOVA.
Fig. 3
Fig. 3
SARS-CoV-2 infection invoked distinct complement signatures across lymphoid, myeloid and epithelial cells in patients. (A) UMAP showing 3 major cell types and 7 sub-cell types in uninfected subject lung biopsies (n=8) and COVID-19 bronchoalveolar lavage (BAL) specimens from patients with mild (n =3) and severe (n =3) COVID-19. (B) Expression of cell-defining features across all cell types. (C) Expression of C3, C3AR1 and CD46 in select cell types across uninfected, mild and severe COVID-19 samples (see also Figs. S4A-B for all cell types). (D-E) The UMAP projection (D) and module (Mod) score (54) (E) of CD46-regulated genes (top panel), C3aR1-regulated genes (middle panel) and interferon-/-regulated genes (see Table S2). In (E) selected cell types are shown. Single cell data are from GSE145926 and GSE122960. ****p<0.0001 by Wilcoxon test.
Fig. 4
Fig. 4. STAT1 and RELA bound to complement genes induced by SARS-CoV-2.
(A) Numbers of differentially expressed genes in normal primary human bronchial epithelial (NHBE) cells and A549 alveolar cell lines infected with SARS-CoV-2 in comparison with mock infection. (B) The top ten Ingenuity Pathway Analysis (IPA) predicted transcription factors (TFs) regulating the SARS-CoV-2-driven transcriptional response in normal human bronchial epithelial (NHBE) cells and human alveolar basal epithelial cell lines (A549). Highlighted in red are TFs transducing interferon-mediated and in blue NF-B-mediated gene transcription. (C) Histone 3 lysine 27 acetylation (H3K27Ac) and STAT1 and RELA ChIP-seq binding profiles across SARS-CoV-2-induced and repressed genes. (D) STAT1, RELA and H3K27Ac ChIP-seq tracks showing the IRF9, CFB and C3 gene loci. Data in A are from GSE147507 and in C-D have been sourced from ENCODE (H3K27Ac and STAT1) and from GSE132018 (RELA). RELA profiles in C are from LPS-treated cells. *** p<0.001; ****p<0.0001 by Fishers exact test.
Fig. 5
Fig. 5. The Janus kinase inhibitor (JAKi) ruxolitinib neutralized SARS-CoV-2 mediated complement transcription.
(A) Gene set enrichment analysis (GSEA) showing enrichment of genes normalized by pharmaceutical agents in the transcriptomes of control (Ctrl.) or SARS-CoV-2-infected NHBE (left) or A549 (right) cells. Drugs have been ranked by significance (false-discovery rate q-values), with ruxolitinib, baricitinib and atovaquone highlighted in red. (B) Representative GSEA plot showing enrichment (higher expression) of ruxolitinib down-regulated genes in SARS-CoV-2-treated cells. (C) Heatmap showing expression of genes induced/repressed by SARS-CoV-2 in A549 cells transduced with ACE2 (A549-ACE2) then infected with SARS-CoV-2 in the presence of ruxolitinib or vehicle. Genes are clustered according to their response to SARS-CoV-2 and ruxolitinib. (D) Scatter plot comparing the expression of all genes between STAT1 wild-type (STAT1+/+) and STAT1 knockout (STAT1/) HepG2 cells after interferon (IFN)- treatment. Differentially expressed genes (Fold change>2) are highlighted in blue (down-regulated in knockout) and red (up-regulated in knockout) and selected key complement and interferon pathway genes highlighted in orange. IL6 is also marked but not significantly expressed or changed. Transcriptomes are sourced from GSE147507 (A-C) (13) and GSE98372 (D) (25).
Fig. 6
Fig. 6. Pharmacological inhibition of key targets inhibited C3a output from SARS-CoV-2-infected respiratory epithelial cells.
(A) chemoproteomic profiling of CFBi identified complement factor as the only target. Shown is the dose-dependent reduction of bead-binding of complement factor B from protein extracts of cells. Shown are mean and s.d. from 3 independent experiments. (B) C3a ELISA in plasma treated with zymosan (an alternative complement pathway activator) in the presence of increasing concentrations of EDTA (a chelator of divalent cations, which stops convertase activity), a CFB blocking antibody or isotype control, the chemical CFBi or its carrier, DMSO. Bars show mean + sem; dots represent individual experiments. (C) confocal images (left) and quantifications (right) showing generation of C3a in mock- or SARS-CoV-2-infected iAEC2s treated with CFBi, ruxolitinib or a combination of ruxolitinib and remdesivir. Scale bar indicates 100m. Data are from n=2 independent experiments; 18191 + 660 (mean + sd) cells per condition. Bars indicate mean + sd (A) or sem (B-C). *p<0.05, ***p<0.001, ***p<0.0001 by ANOVA.
Fig. 7
Fig. 7
Schematic model of SARS-CoV-2-induction of complement in respiratory epithelial cells. SARS-CoV-2 infects respiratory epithelial cells and induces an interferon response. IFNs signal via the IFN receptor to activate STAT1 via JAK1/2. STAT1 co-operates with RELA to induce transcription of IL6 and complement genes including C3, CFB, C1R and C1S. CFB acts as an alternative pathway C3 convertase to cleave C3 intracellularly to C3a and C3b. C3a engages C3aR and C3b engages CD46 on leukocyte subsets in the lungs to drive inflammation. These events can be pharmacologically targeted with antivirals (e.g., remdesivir), JAK-STAT inhibitors (e.g., ruxolitinib) and/or cell permeable complement inhibitors, including CFBi.

Update of

Comment in

  • Complement control for COVID-19.
    Bosmann M. Bosmann M. Sci Immunol. 2021 May 25;6(59):eabj1014. doi: 10.1126/sciimmunol.abj1014. Sci Immunol. 2021. PMID: 34035117 Free PMC article.

Similar articles

Cited by

References

    1. Zhou F., Yu T., Du R., Fan G., Liu Y., Liu Z., Xiang J., Wang Y., Song B., Gu X., Guan L., Wei Y., Li H., Wu X., Xu J., Tu S., Zhang Y., Chen H., Cao B., Clinical course and risk factors for mortality of adult inpatients with COVID-19 in Wuhan, China: A retrospective cohort study. Lancet 395, 1054–1062. (2020). 10.1016/S0140-6736(20)30566-3 - DOI - PMC - PubMed
    1. Oronsky B., Larson C., Hammond T. C., Oronsky A., Kesari S., Lybeck M., Reid T. R., A Review of Persistent Post-COVID Syndrome (PPCS). Clin. Rev. Allergy Immunol. 1–9. (2021). - PMC - PubMed
    1. Mandal S., Barnett J., Brill S. E., Brown J. S., Denneny E. K., Hare S. S., Heightman M., Hillman T. E., Jacob J., Jarvis H. C., Lipman M. C. I., Naidu S. B., Nair A., Porter J. C., Tomlinson G. S., Hurst J. R., ARC Study Group , Long-COVID: A cross-sectional study of persisting symptoms, biomarker and imaging abnormalities following hospitalisation for COVID-19. Thorax 76, 396–398. (2021). 10.1136/thoraxjnl-2020-215818 - DOI - PMC - PubMed
    1. Noris M., Remuzzi G., Overview of complement activation and regulation. Semin. Nephrol. 33, 479–492. (2013). 10.1016/j.semnephrol.2013.08.001 - DOI - PMC - PubMed
    1. Cardone J., Le Friec G., Vantourout P., Roberts A., Fuchs A., Jackson I., Suddason T., Lord G., Atkinson J. P., Cope A., Hayday A., Kemper C., Complement regulator CD46 temporally regulates cytokine production by conventional and unconventional T cells. Nat. Immunol. 11, 862–871. (2010). 10.1038/ni.1917 - DOI - PMC - PubMed

Publication types