. 2021 Apr;9(4):e002231.
doi: 10.1136/jitc-2020-002231.

Intratumoral CD103+ CD8+ T cells predict response to PD-L1 blockade

Affiliations

Intratumoral CD103+ CD8+ T cells predict response to PD-L1 blockade

Romain Banchereau et al. J Immunother Cancer. 2021 Apr.

Abstract

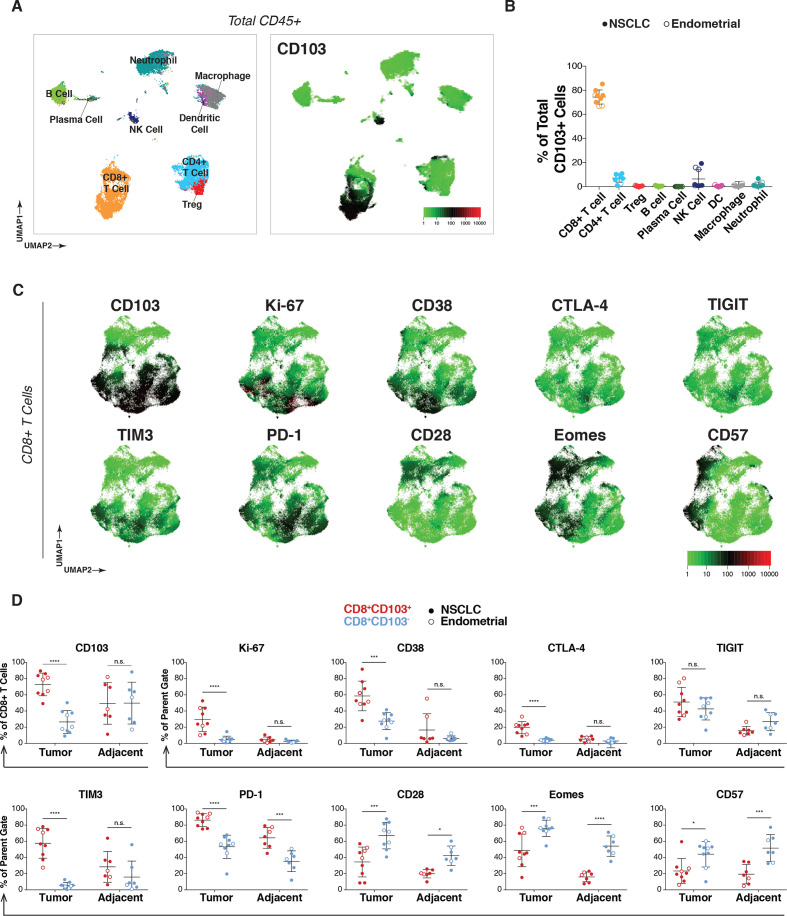
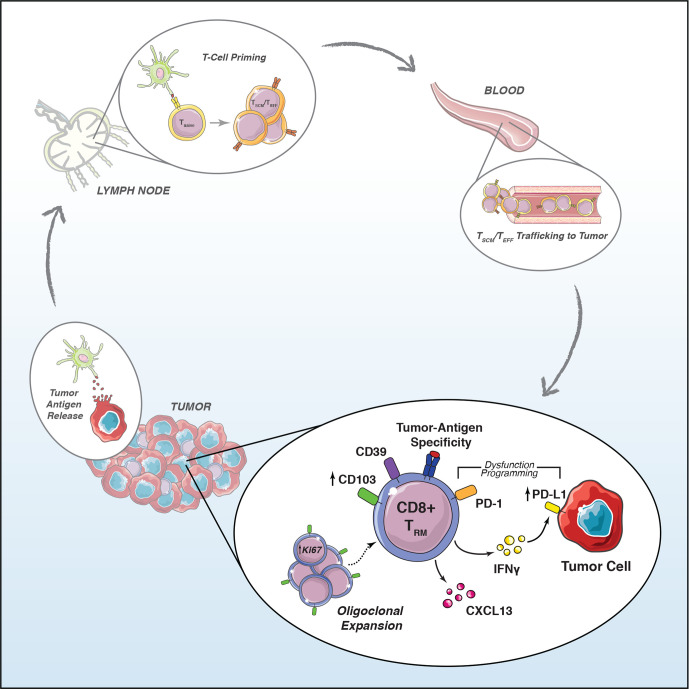
Background: CD8+ tissue-resident memory T (TRM) cells, marked by CD103 (ITGAE) expression, are thought to actively suppress cancer progression, leading to the hypothesis that their presence in tumors may predict response to immunotherapy.

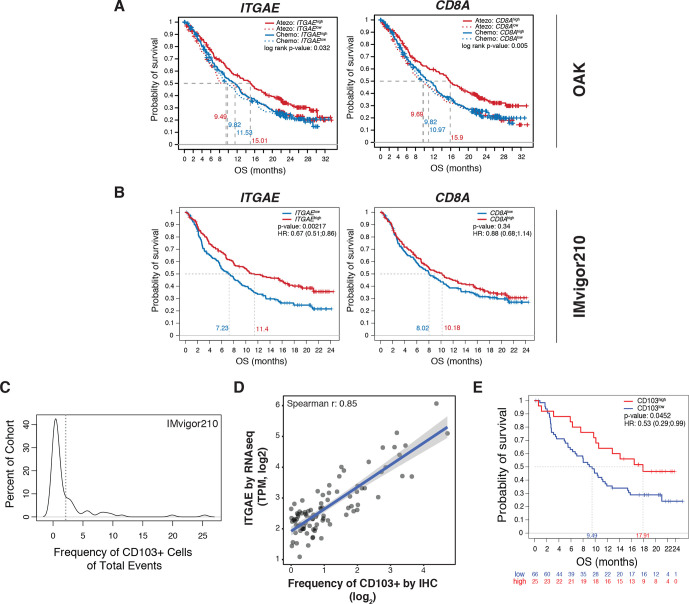
Methods: Here, we test this by combining high-dimensional single-cell modalities with bulk tumor transcriptomics from 1868 patients enrolled in lung and bladder cancer clinical trials of atezolizumab (anti-programmed cell death ligand 1 (PD-L1)).

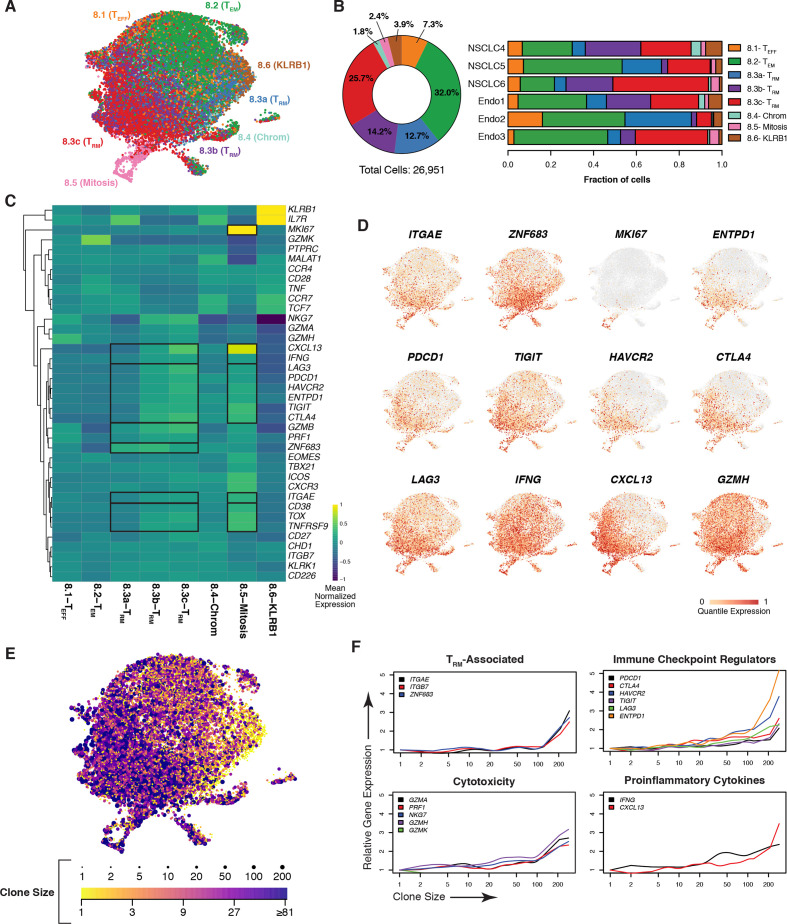
Results: ITGAE was identified as the most significantly upregulated gene in inflamed tumors. Tumor CD103+ CD8+ TRM cells exhibited a complex phenotype defined by the expression of checkpoint regulators, cytotoxic proteins, and increased clonal expansion.

Conclusions: Our analyses indeed demonstrate that the presence of CD103+ CD8+ TRM cells, quantified by tracking intratumoral CD103 expression, can predict treatment outcome, suggesting that patients who respond to PD-1/PD-L1 blockade are those who exhibit an ongoing antitumor T-cell response.

Keywords: CD8-positive T-lymphocytes; biomarkers; gene expression profiling; immunotherapy; lymphocytes; tumor; tumor-infiltrating.


Conflict of interest statement

Competing interests: All authors except Thomas Powles are current or former employees of Roche.

Figures

Figure 1
Figure 1
ITGAE/CD103 is upregulated in tumors exhibiting high CD8+ T-cell infiltration. (A) Volcano plot depicting differentially expressed genes between patients with inflamed versus excluded CD8+ T-cell infiltration phenotypes in tumors from the IMvigor210 clinical trial (mUC) (n=354). Colored dots indicate genes significantly (adjusted p value<0.05) upregulated (red, right) or downregulated (blue, left) greater than two-fold (log2FC≥1) in inflamed relative to excluded tumors. Select genes representative of cytotoxic T cells and IFN signaling are annotated. (B) Top 20 reactome pathways enriched in inflamed tumors relative to excluded tumors ranked by significance (−log10 (p-value) on x-axis). (C) Top 25 genes that correlate with ITGAE expression in a bulk RNAseq analysis of tumor samples from the IMvigor210 clinical trial. (D) Comparison of baseline ITGAE gene expression across patients categorized into desert, excluded, or inflamed subgroups based on CD8+ T-cell tumor infiltration patterns in three clinical trials: OAK (NSCLC, n=669), IMvigor210 (mUC, n=290), and IMvigor211 (mUC, n=778). Statistical analysis was conducted within each trial using the Kruskal-Wallis test with Dunn’s post hoc test adjusted with Benjamini-Hochberg correction for multiple comparisons. (E) Box plots depicting ITGAE gene expression in bulk RNAseq profiles of tumors from OAK (n=725), IMvigor210 (n=353), and IMvigor211 (n=792) clinical trials categorized by low (IC0), mid (IC1), or high (IC2/3) PD-L1 expression on immune cells (IC) as measured by IHC. (F) Representative tissue imaging of FFPE tumors obtained from a subset of IMvigor210 patients (n=91) stained with H&E for tissue architecture (left), as well as for CD8 (middle, brown) and CD103 (right, brown) by IHC. (G) Comparison of CD103 IHC between desert (n=26), excluded (n=45), and inflamed (n=20) tumor infiltration phenotypes. Statistical analysis was completed using a Kruskal-Wallis test with Dunn’s post hoc test adjusted with Benjamini-Hochberg correction for multiple comparisons. ****P<0.0001. FFPE, formalin-fixed paraffin-embedded; H&E, hematoxylin-and-eosin; IFN, interferon; IHC, immunohistochemistry; mUC, metastatic urothelial carcinoma; n.s., not significant; NSCLC, non-small cell lung cancer; PD-L1, programmed cell death ligand 1; RNAseq, RNA sequencing.
Figure 2
Figure 2
CD103+ cells in tumors are predominantly CD8+ TRM cells and are characterized by Ki-67 and immune checkpoint expression. (A) NSCLC patient tumors (n=6) analyzed by mass cytometry, with resulting data for total CD45+ cells (8000 downsampled cells per sample) aggregated and visualized by UMAP (left). Immune subset identities were determined by manual gating and projected onto the UMAP. Expression of CD103 across total CD45+ cells from NSCLC tumors overlaid onto the UMAP (right). (B) Frequency of the indicated immune subpopulations of total CD103+ cells for all nine tumors (n=6 NSCLC (solid dots), n=3 endometrial cancer (open dots)). (C) Expression pattern for markers of activation and dysfunction for NSCLC tumors in aggregate projected onto the UMAP of CD8+ T cells. (D) Comparison of expression frequency of indicated markers within CD8+ T cells between CD103+ (red) or CD103− (blue) subsets in either tumor (left) or adjacent tissue (right) across all tumor samples (n=9, solid dots for NSCLC, open dots for endometrial). Statistical analysis was conducted using two-way analysis of variance with Bonferroni correction for multiple comparisons. *P<0.05, **P<0.01, ***P<0.001, ****P<0.0001. n.s., not significant; NSCLC, non-small cell lung cancer; PD-1, programmed cell death 1; TRM, tissue-resident memory T; UMAP, uniform manifold approximation and projection.
Figure 3
Figure 3
Tumor CD8 +TRM cells are clonally expanded and express genes associated with cytotoxicity and dysfunction. (A) UMAP of CD8+ T cells from NSCLC (n=3) and endometrial (n=3) tumor samples with clusters colored by subset identity as analyzed by scRNAseq. (B) Frequency of each CD8+ T-cell cluster among all tumors assessed with samples in aggregate (left) or by individual (right). (C) Heatmap depicting relative expression of T cell-associated genes, with a dendogram indicating results of hierarchical unsupervised clustering (left), across CD8+ clusters. Genes are globally scaled with an expression range from −1 (dark blue) to 1 (yellow). (D) UMAP overlay of genes associated with the TRM phenotype, proliferation, dysfunction, as well as genes correlated with ITGAE in the bulk RNAseq and heatmap analyses. Individual cells are colored on a scale of gray (0) to red (1) according to the quantile of their expression. (E) Extent of clonal expansion, as determined by scTCRseq, for each cell overlaid onto the UMAP (A). The breadth of TCR clonality is represented by dot size and by color, ranging from a clone size of 1 (yellow) to greater than 81 (purple). (F) Expression of indicated genes (y-axes) as a function of the size of a given clonotype (with clone size rank ordered on the x-axis) for resident memory T-cell phenotype, checkpoint regulator, cytotoxicity, and proinflammatory cytokine genes. NSCLC, non-small cell lung cancer; RNAseq, RNA sequencing; scRNAseq, single-cell RNA sequencing; scTCRseq, single-cell TCR sequencing; TCR, T-cell receptor; TRM, tissue-resident memory T; UMAP, uniform manifold approximation and projection.
Figure 4
Figure 4
ITGAE/CD103 expression is predictive of response to PD-L1 blockade. (A) Kaplan-Meier curves depicting the OS probability of patients with locally advanced or metastatic NSCLC cancer treated with atezolizumab (red) or chemotherapy (blue) (OAK) categorized by high (solid line) or low (dotted line) transcriptional expression (median cut-off) of either ITGAE (left panel) or CD8A (right panel). P-values are displayed within each panel. (B) Kaplan-Meier curves demonstrating OS in patients with mUC from IMvigor210 categorized by high (red) or low (blue) transcriptional expression (median cut-off) of either ITGAE (left panel) or CD8A (right panel). HRs and p-values are shown for each gene. (C) Distribution of CD103+ cells in the tumor area across a subcohort (n=91) of IMvigor210 biopsies stained for CD103 by IHC. The dotted line indicates the 2% cut-off defining CD103high and CD103low patient groups. (D) Correlation of gene expression of ITGAE, as measured by bulk RNAseq analysis (TPM, y-axis), to quantification of CD103 protein by IHC (frequency of positive events out of total cells in tumor area, x-axis) for the subset of IMvigor210 patient samples analyzed. The Spearman R correlation value is displayed on the graph. (E) Kaplan-Meier curves comparing OS for patients defined as CD103high and CD103low in (C). Statistical significance was determined by Cox proportional hazard modeling. The HR and p-value are displayed within. HR, hazard ratio; IHC, immunohistochemistry; mUC, metastatic urothelial carcinoma; NSCLC, non-small cell lung cancer; OS, overall survival; PD-L1, programmed cell death ligand 1; RNAseq, RNA sequencing; TPM, transcripts per million.
Figure 5
Figure 5
Activated tumor antigen-specific CD103+ TRM cells generate biomarker signals of immunotherapy response. PD-1, programmed cell death 1; PD-L1, programmed cell death ligand 1; TEFF, effector T; TRM, tissue-resident memory T; TSCM, stem cell memory T.

References

    1. Pauken KE, Wherry EJ. Overcoming T cell exhaustion in infection and cancer. Trends Immunol 2015;36:265–76. 10.1016/j.it.2015.02.008 - DOI - PMC - PubMed
    1. Gong J, Chehrazi-Raffle A, Reddi S, et al. . Development of PD-1 and PD-L1 inhibitors as a form of cancer immunotherapy: a comprehensive review of registration trials and future considerations. J Immunother Cancer 2018;6:8. 10.1186/s40425-018-0316-z - DOI - PMC - PubMed
    1. van der Leun AM, Thommen DS, Schumacher TN. CD8+ T cell states in human cancer: insights from single-cell analysis. Nat Rev Cancer 2020;20:218–32. 10.1038/s41568-019-0235-4 - DOI - PMC - PubMed
    1. Verma V, Shrimali RK, Ahmad S, et al. . PD-1 blockade in subprimed CD8 cells induces dysfunctional PD-1+CD38hi cells and anti-PD-1 resistance. Nat Immunol 2019;20:1231–43. 10.1038/s41590-019-0441-y - DOI - PMC - PubMed
    1. Mazzaschi G, Madeddu D, Falco A, et al. . Low PD-1 expression in cytotoxic CD8+ tumor-infiltrating lymphocytes confers an immune-privileged tissue microenvironment in NSCLC with a prognostic and predictive value. Clin Cancer Res 2018;24:407–19. 10.1158/1078-0432.CCR-17-2156 - DOI - PubMed

MeSH terms