. 2021 Nov;76(11):1079-1088.
doi: 10.1136/thoraxjnl-2020-216037. Epub 2021 Apr 7.

Small airway determinants of airflow limitation in chronic obstructive pulmonary disease

Affiliations

Small airway determinants of airflow limitation in chronic obstructive pulmonary disease

Vasiliy V Polosukhin et al. Thorax. 2021 Nov.

Abstract

Background: Although a variety of pathological changes have been described in small airways of patients with COPD, the critical anatomic features determining airflow limitation remain incompletely characterised.

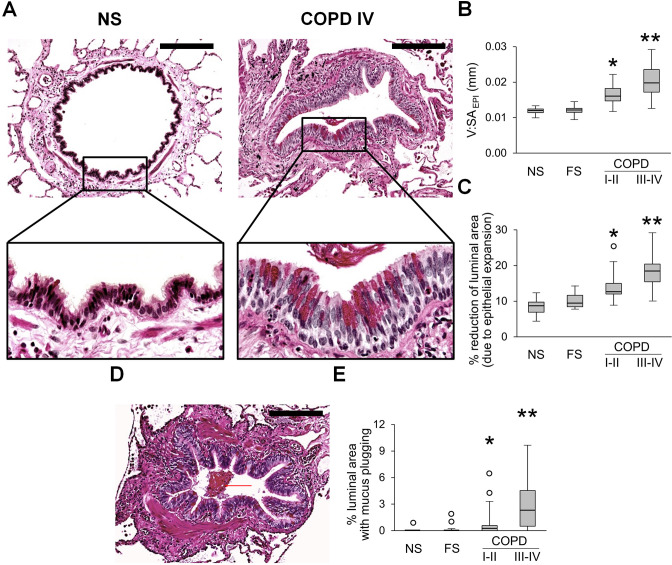
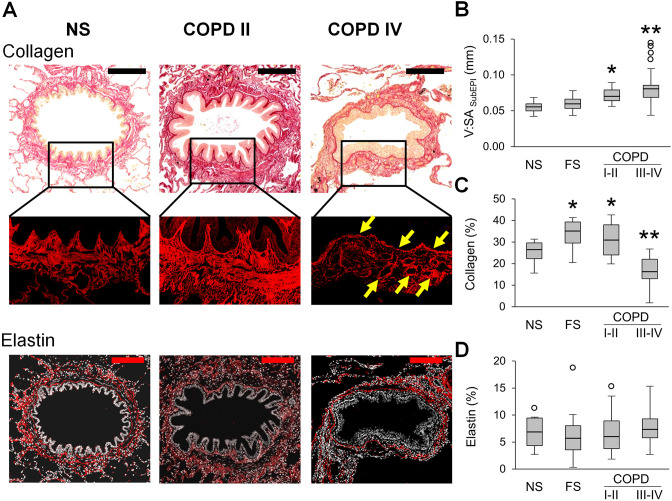
Methods: We examined lung tissue specimens from 18 non-smokers without chronic lung disease and 55 former smokers with COPD for pathological features of small airways that could contribute to airflow limitation. Morphometric evaluation was performed for epithelial and subepithelial tissue thickness, collagen and elastin content, luminal mucus and radial alveolar attachments. Immune/inflammatory cells were enumerated in airway walls. Quantitative emphysema scoring was performed on chest CT scans.

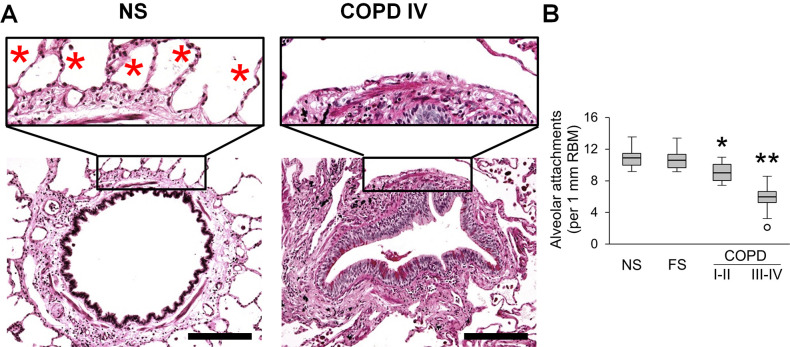
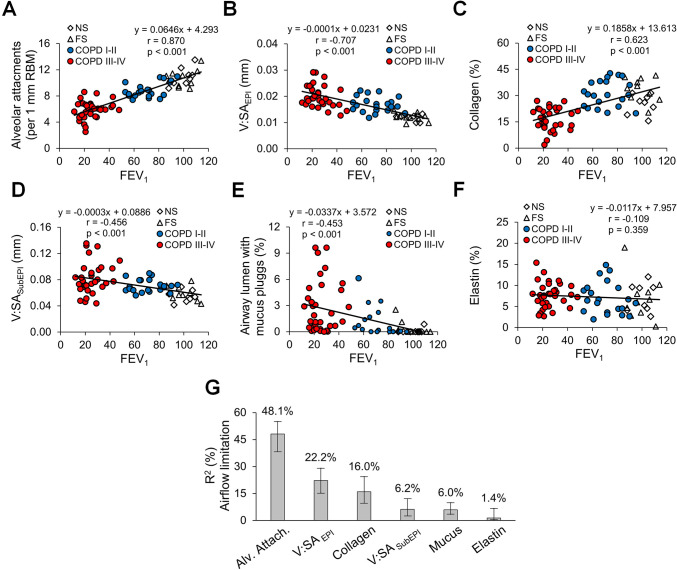
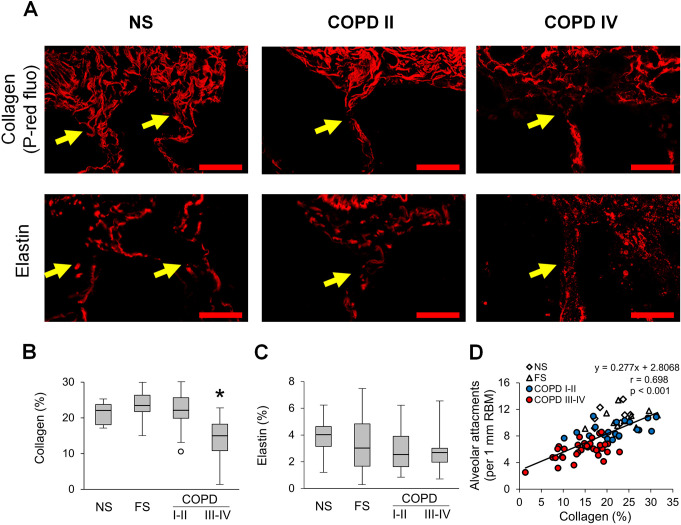
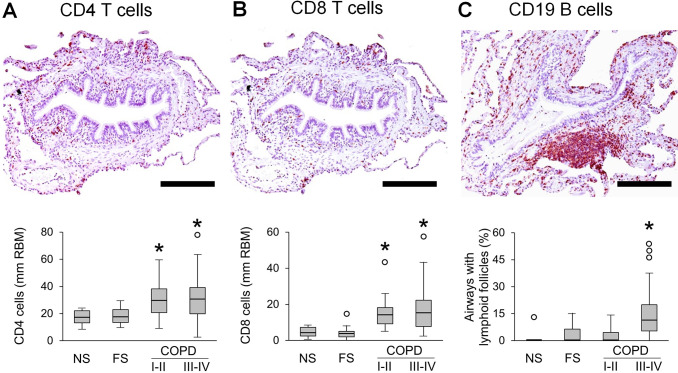
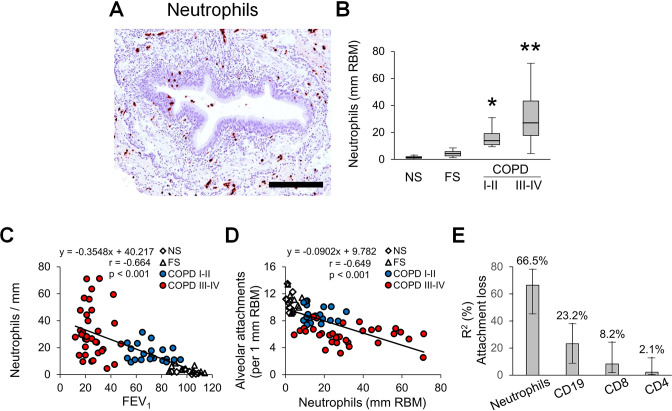
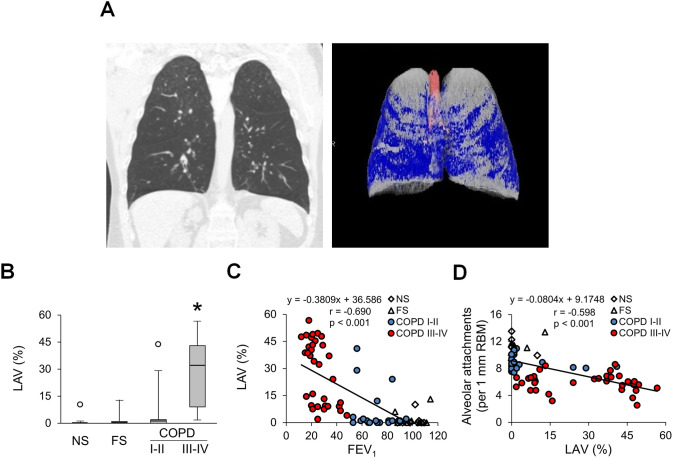
Results: Small airways from patients with COPD showed thickening of epithelial and subepithelial tissue, mucus plugging and reduced collagen density in the airway wall (in severe COPD). In patients with COPD, we also observed a striking loss of alveolar attachments, which are connective tissue septa that insert radially into the small airway adventitia. While each of these parameters correlated with reduced airflow (FEV1), multivariable regression analysis indicated that loss of alveolar attachments was the major determinant of airflow limitation related to small airways. Neutrophilic infiltration of airway walls and collagen degradation in airway adventitia correlated with loss of alveolar attachments. In addition, quantitative analysis of CT scans identified an association between the extent of emphysema and loss of alveolar attachments.

Conclusion: In COPD, loss of radial alveolar attachments in small airways is the pathological feature most closely related to airflow limitation. Destruction of alveolar attachments may be mediated by neutrophilic inflammation.

Keywords: COPD pathology; emphysema.


Conflict of interest statement

Competing interests: SR was an employee of AstraZeneca from 2015 to 2019 and continues to own shares that were received as part of his compensation. As part of that employment, he represented AstraZeneca on the Board of Directors of Dizal Pharma without additional compensation. In the last three years, he has consulted for Bergenbio, GlaxoSmithKline, NovoVentures and Verona. Between 1996 and 2007, his university received funding from tobacco companies that supported studies relating to harm reduction and to the impact of tobacco smoke on stem cells. As part of this work, he consulted with RJ Reynolds without personal fee on the topic of harm reduction, received funding from RJ Reynolds to evaluate the effect of a harm reduction product in normal smokers (1996) and in subjects with chronic bronchitis (1999) and to assess the effect of smoking cessation on lower respiratory tract inflammation (2000); he participated in a Philip Morris multicentre study to assess biomarkers of smoke exposure (2002); he received funding for a clinical trial from the Institute for Science and Health (2005), which receives support from the tobacco industry, to evaluate biomarkers in exhaled breath associated with smoking cessation and reduction. This study was supplemented with funding from Lorillard and RJ Reynolds to expand the spectrum of biomarkers assessed. He received a grant from the Philip Morris External Research Program (2005) to assess the impact of cigarette smoking on circulating stem cells in the mouse. There are no active tobacco-industry funded projects. All ties with tobacco industry companies and entities supported by tobacco companies were terminated in 2007.

Figures

Figure 1
Figure 1
Epithelial remodelling and mucus accumulation in small airways of patients with COPD. (A) Representative images of normal-appearing structural organisation of small airway in lifelong NS subject and a combination of goblet cell metaplasia and increased epithelial height in small airway from a patient in GOLD stage IV COPD. PAS staining. Scale bars=100 µm. Inserts show detailed characteristics of epithelial remodelling. (B, C) Box and whisker plots showing progressive increase of epithelial height (V:SAepi) (B) and reduction of airway luminal area due to epithelial expansion (C) in COPD small airways compared with NS and FS airways. (D) Mucus plug in the airway lumen. PAS staining. Scale bar=100 µm. (E) Box and whisker plots showing progressive reduction of airway luminal area due to mucus plugging in COPD small airways compared with NS and FS airways. Boxes represent the IQR, whiskers extend to the most extreme data point which is no more than 1.5 times the IQR from the box, and circles beyond the whiskers are extreme values, the line within the box represents the median. Groups were compared pairwise using Mann-Whitney U test. Estimated p values were Bonferroni-adjusted. The threshold for significance was 0.05. *Significantly different compared with NS controls, **significantly different compared with all other groups. FS, former smoker; GOLD, Global Initiative for Chronic Obstructive Lung Disease; NS, non-smoker; PAS, periodic acid-Schiff.
Figure 2
Figure 2
Mural remodelling of small airways of patients with COPD. (A) Representative images of normal-appearing structural organisation of a small airway wall in lifelong NS subject and wall remodelling in patients with GOLD stage II COPD and stage IV COPD. PicroSirius red-staining. Scale bar=100 µm. Inserts demonstrate PicroSirius red-staining (P-red) under red fluorescence. Fine structural organisation of collagen fibres in NS airway, collagen deposition in small airway from a patient in GOLD stage II COPD, and a combination of collagen deposition in RBM and perivascular regions (yellow arrows) with collagen scaffold degradation in small airway from a patient in GOLD stage IV COPD. Bottom images show elastin immunostaining in small airways from lifelong NS subject, patients with GOLD stage II and stage IV COPD. Scale bars=100 µm. (B–D) Box and whisker plots show wall thickness (V:SAsubepi) (B), collagen density (C) and elastin density (D) in small airways of NS and FS controls and patients with COPD. Boxes represent the IQR, whiskers extend to the most extreme data point which is no more than 1.5 times the IQR from the box and circles beyond the whiskers are extreme values, the line within the box represents the median. Groups were compared pairwise using Student’s t-test for collagen content and Mann-Whitney U test otherwise. Estimated p values were Bonferroni-adjusted. The threshold for significance was 0.05. *Significantly different compared with NS controls, **significantly different compared with all other groups. FS, former smoker; GOLD, Global Initiative for Chronic Obstructive Lung Disease; NS, non-smoker.
Figure 3
Figure 3
Reduced alveolar attachments around small airways of patients with COPD. (A) Representative images of intact alveolar attachments in small airway from lifelong NS subject and their loss in small airway from a patient in GOLD stage IV COPD. PAS staining. Scale bars=100 µm. Inserts show detailed organisation of alveolar attachments (red stars). (B) Box and whisker plots showing progressive loss of alveolar attachments in COPD small airways compared with NS and FS airways. Boxes represent the IQR, whiskers extend to the most extreme data point which is no more than 1.5 times the IQR from the box, and circles beyond the whiskers are extreme values, the line within the box represents the median. Groups were compared pairwise using Student’s t-test. Estimated p values were Bonferroni-adjusted. The threshold for significance was 0.05. *Significantly different compared with NS controls, **significantly different compared with all other groups. FS, former smoker; GOLD, Global Initiative for Chronic Obstructive Lung Disease; NS, non-smoker; PAS, periodic acid-Schiff.
Figure 4
Figure 4
Relative contribution of small airway pathological findings to airflow limitation in COPD. (A–E) Scatter plots showing correlations and lines of best fit of alveolar attachments (A), epithelial height (B), mucus plugging (C), airway wall thickness (D), collagen density (E) and elastin density (F) with airflow limitation measured as FEV1. (G) Relative contribution of pathological parameters on airflow limitation (measured as FEV1) plotted as the proportion of FEV1 variability and its corresponding 95% CI explained by each parameter. R²=80.3%, metrics are normalised to sum 100%. FS, former smoker; GOLD, Global Initiative for Chronic Obstructive Lung Disease; NS, non-smoker.
Figure 5
Figure 5
Collagen degradation in the adventitia of small airways is associated with loss of alveolar attachments. (A) Representative images of collagen and elastin anchoring fibres (yellow arrows) in alveolar attachments in a lifelong NS subject, patient with GOLD stage II COPD, and a patient with GOLD stage IV COPD. Top row: PicroSirius red-staining under red fluorescence; bottom row: elastin immunofluorescence. Scale bars=20 µm. (B, C) Box and whisker plots show collagen (B) and elastin (C) density in 10 µm zone of outer adventitia in small airways from NS and FS controls and patients with COPD. Boxes represent the IQR, whiskers extend to the most extreme data point which is no more than 1.5 times the IQR from the box, and circles beyond the whiskers are extreme values, the line within the box represents the median. Groups were compared pairwise using Mann-Whitney U test. Estimated p values were Bonferroni-adjusted. The threshold for significance was 0.05. *Significantly different compared with all other groups. (D) Scatter plot showing correlation and best fit line of collagen density in outer adventitia of small airways with alveolar attachments. FS, former smoker; GOLD, Global Initiative for Chronic Obstructive Lung Disease; NS, non-smoker.
Figure 6
Figure 6
Quantification of lymphocytes in small airways of patients with COPD. (A–C) Representative images of CD4 (A) and CD8 (B) T lymphocyte infiltration in airway wall and lymphoid follicle adjacent to small airway (C). Box and whisker plots show lymphocyte counts in airway walls with normalisation to 1 mm RBM, and the proportion of small airways with adjacent lymphoid follicles from all patient groups. Boxes represent the IQR, whiskers extend to the most extreme data point which is no more than 1.5 times the IQR from the box and circles beyond the whiskers are extreme values, the line within the box represents the median. Groups were compared pairwise using Mann-Whitney U test. Estimated p values were Bonferroni-adjusted. The threshold for significance was 0.05. *Significantly different compared with NS controls. FS, former smoker; NS, non-smoker; RBM, reticular basement membrane.
Figure 7
Figure 7
Quantification of neutrophils in small airways of patients with COPD. (A) Representative image of neutrophil infiltration in airway wall. (B) Box and whisker plots show neutrophil counts in airway walls with normalisation to 1 mm RBM. Boxes represent the IQR, whiskers extend to the most extreme data point which is no more than 1.5 times the IQR from the box, and circles beyond the whiskers are extreme values, the line within the box represents the median. Groups were compared pairwise using Mann-Whitney U test. Estimated p values were Bonferroni-adjusted. The threshold for significance was 0.05. *Significantly different compared with NS controls, **significantly different compared with all other groups. (C) Scatter plot showing correlation and best fit line between small airway wall neutrophilic infiltration and FEV1. (D) Scatter plot showing correlation and best fit line between small airway wall neutrophilic infiltration and alveolar attachment counts. (E) Multivariable regression analysis with following LMG variance decomposition showing the relative contribution and importance of inflammatory parameters on alveolar attachment loss plotted as the proportion of variability and its corresponding 95% CI explained by each parameter. Multivariable regression model R²=43.9%, relative importance metrics are normalised to 100%. FS, former smoker; LMG, Lindeman, Merenda, Gold; NS, non-smoker; RBM, reticular basement membrane.
Figure 8
Figure 8
Relationship of emphysema to loss of alveolar attachments in COPD. (A) Coronal CT images for patient with very severe COPD (GOLD stage IV). Areas of emphysema (low attenuation) are coloured blue. (B) Box and whisker plots showing per cent of lungs containing LAV as an indicator of emphysema in different patient groups. Boxes represent the IQR, whiskers extend to the most extreme data point which is no more than 1.5 times the IQR from the box and circles beyond the whiskers are extreme values, the line within the box represents the median. Groups were compared pairwise using Mann-Whitney U test. Estimated p values were Bonferroni-adjusted. The threshold for significance was 0.05. *Significantly different compared with all other groups. (C) Scatter plot showing correlation and best fit line between percentage of lung with emphysema and FEV1. (D) Scatter plot showing correlation and best fit line between percentage of lung with emphysema and alveolar attachment counts. FS, former smoker; GOLD, Global Initiative for Chronic Obstructive Lung Disease; LAV, low attenuation volume; NS, non-smoker; PAS, periodic acid-Schiff.

Similar articles

Cited by

References

    1. Spurzem JR, Rennard SI. Pathogenesis of COPD. Semin Respir Crit Care Med 2005;26:142–53. 10.1055/s-2005-869535 - DOI - PubMed
    1. Curtis JL, Freeman CM, Hogg JC. The immunopathogenesis of chronic obstructive pulmonary disease: insights from recent research. Proc Am Thorac Soc 2007;4:512–21. 10.1513/pats.200701-002FM - DOI - PMC - PubMed
    1. Rabe KF, Watz H. Chronic obstructive pulmonary disease. Lancet 2017;389:1931–40. 10.1016/S0140-6736(17)31222-9 - DOI - PubMed
    1. Hogg JC, Macklem PT, Thurlbeck WM. Site and nature of airway obstruction in chronic obstructive lung disease. N Engl J Med 1968;278:1355–60. 10.1056/NEJM196806202782501 - DOI - PubMed
    1. McDonough JE, Yuan R, Suzuki M, et al. . Small-airway obstruction and emphysema in chronic obstructive pulmonary disease. N Engl J Med 2011;365:1567–75. 10.1056/NEJMoa1106955 - DOI - PMC - PubMed

Publication types

MeSH terms