. 2021 Apr 27;118(17):e2022376118.
doi: 10.1073/pnas.2022376118.

Learning loss due to school closures during the COVID-19 pandemic

Affiliations

Learning loss due to school closures during the COVID-19 pandemic

Per Engzell et al. Proc Natl Acad Sci U S A. .

Abstract

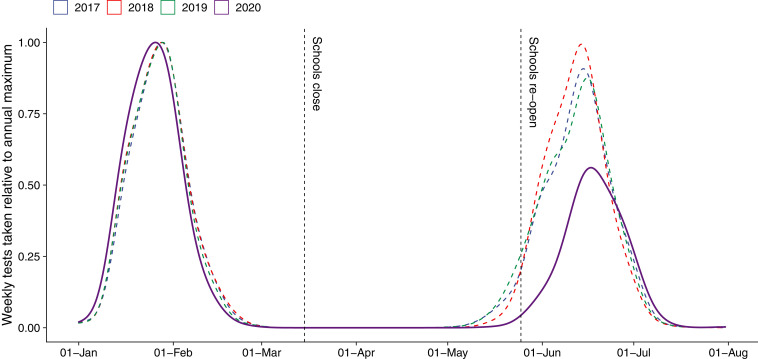
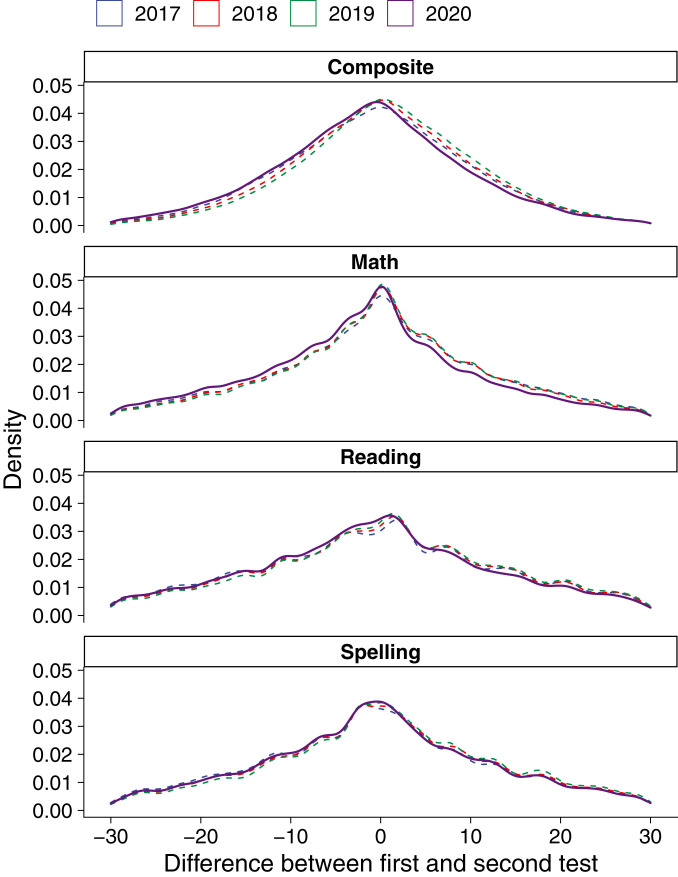
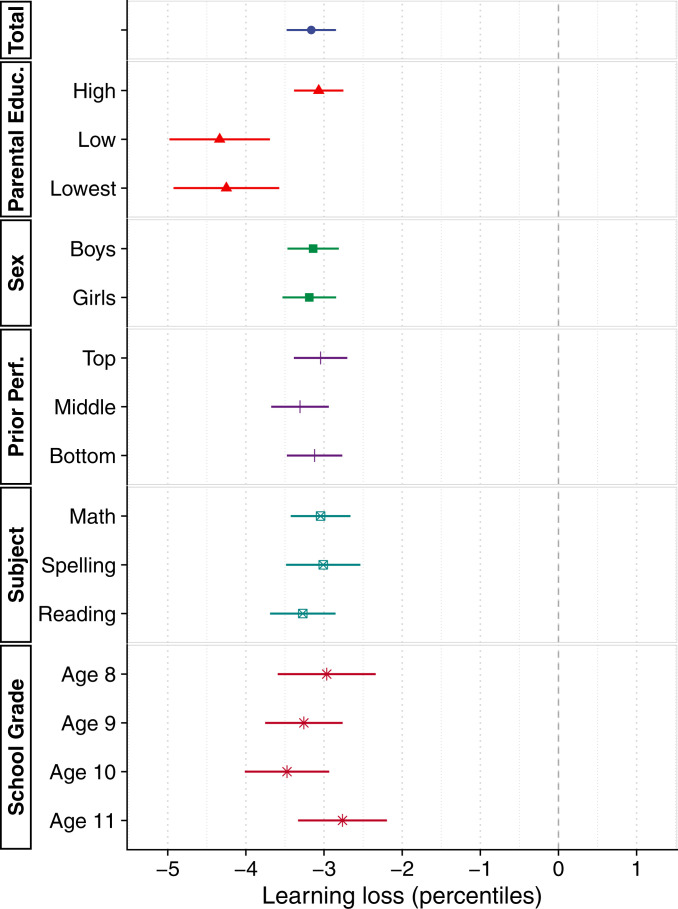
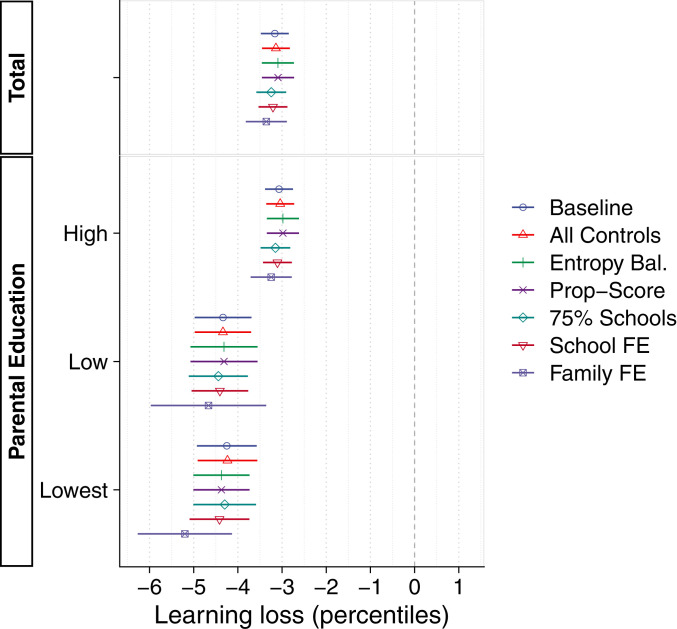
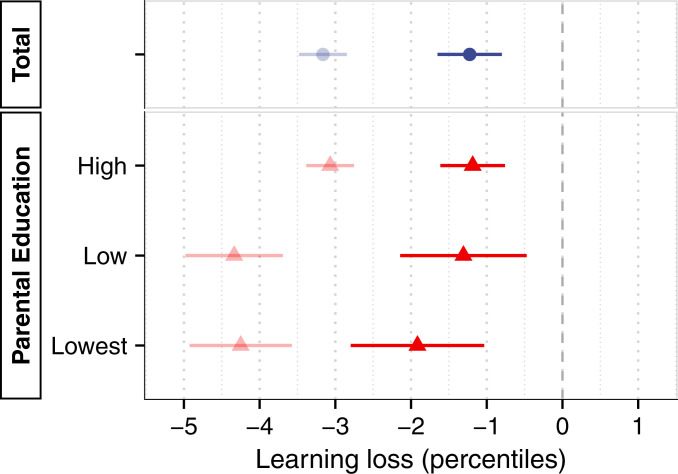
Suspension of face-to-face instruction in schools during the COVID-19 pandemic has led to concerns about consequences for students' learning. So far, data to study this question have been limited. Here we evaluate the effect of school closures on primary school performance using exceptionally rich data from The Netherlands (n ≈ 350,000). We use the fact that national examinations took place before and after lockdown and compare progress during this period to the same period in the 3 previous years. The Netherlands underwent only a relatively short lockdown (8 wk) and features an equitable system of school funding and the world's highest rate of broadband access. Still, our results reveal a learning loss of about 3 percentile points or 0.08 standard deviations. The effect is equivalent to one-fifth of a school year, the same period that schools remained closed. Losses are up to 60% larger among students from less-educated homes, confirming worries about the uneven toll of the pandemic on children and families. Investigating mechanisms, we find that most of the effect reflects the cumulative impact of knowledge learned rather than transitory influences on the day of testing. Results remain robust when balancing on the estimated propensity of treatment and using maximum-entropy weights or with fixed-effects specifications that compare students within the same school and family. The findings imply that students made little or no progress while learning from home and suggest losses even larger in countries with weaker infrastructure or longer school closures.

Keywords: COVID-19; digital divide; learning loss; school closures; social inequality.


Conflict of interest statement

The authors declare no competing interest.

Figures

Fig. 1.
Fig. 1.
Distribution of testing dates 2017 to 2020 and timeline of 2020 school closures. Density curves show the distribution of testing dates for national standardized assessments in 2020 and the three comparison years 2017 to 2019. Vertical lines show the beginning and end of nationwide school closures in 2020. Schools closed nationally on March 16 and reopened on May 11, after 8 wk of remote learning. Our difference-in-differences design compares learning progress between the two testing dates in 2020 to that in the 3 previous years.
Fig. 2.
Fig. 2.
Difference in test scores 2017 to 2020. Density curves show the difference between students’ percentile placement between the first and the second test in each of the years 2017 to 2020. Note that this graph does not adjust for confounding due to trends, testing date, or sample composition, which we address in subsequent analyses using a variety of techniques.
Fig. 3.
Fig. 3.
Estimates of learning loss for the whole sample and by subgroup and test. The graph shows estimates of learning loss from a difference-in-differences specification that compares learning progress between the two testing dates in 2020 to that in the 3 previous years. Statistical controls include time elapsed between testing dates and a linear trend in year. Point estimates are with 95% confidence intervals, with robust standard errors accounting for clustering at the school level. One percentile point corresponds to 0.025 SD. Where not otherwise noted, effects refer to a composite score of math, spelling, and reading. Regression tables underlying these results can be found in SI Appendix, section 7.1.
Fig. 4.
Fig. 4.
Robustness to specification. The graph shows estimates of learning loss for the whole sample and separately by parental education, using a variety of adjustments for loss to follow-up. Point estimates are with 95% confidence intervals, with robust standard errors accounting for clustering at the school level. For details, see Materials and Methods and SI Appendix, sections 4.2 and 7.4–7.8.
Fig. 5.
Fig. 5.
Knowledge learned vs. transitory influences. The graph compares estimates for the composite achievement score in our main analysis (light color) with test not designed to assess curricular content (dark color). Both sets of estimates refer to our baseline specification reported in Fig. 3. Point estimates are with 95% confidence intervals, with robust standard errors accounting for clustering at the school level. For details, see Materials and Methods and SI Appendix, sections 3.1 and 7.8.

Comment in

References

    1. United Nations , Education During COVID-19 and Beyond (UN Policy Briefs, 2020).
    1. United Nations , Convention on the Rights of the Child (United Nations, Treaty Series, 1989).
    1. Brooks S. K., et al. , The impact of unplanned school closure on children’s social contact: Rapid evidence review. Euro Surveill., 10.2807/1560-7917.ES.2020.25.13.2000188 (2020). - DOI - PMC - PubMed
    1. Viner R. M., et al. , School closure and management practices during coronavirus outbreaks including COVID-19: A rapid systematic review. Lancet Child Adolesc. Health 4, 397–404 (2020). - PMC - PubMed
    1. Snape M. D., Viner R. M., COVID-19 in children and young people. Science 370, 286–288 (2020). - PubMed

Publication types

LinkOut - more resources