. 2021 Apr 7;12(1):2089.
doi: 10.1038/s41467-021-22408-5.

Metabolic capabilities mute positive response to direct and indirect impacts of warming throughout the soil profile

Affiliations

Metabolic capabilities mute positive response to direct and indirect impacts of warming throughout the soil profile

Nicholas C Dove et al. Nat Commun. .

Abstract

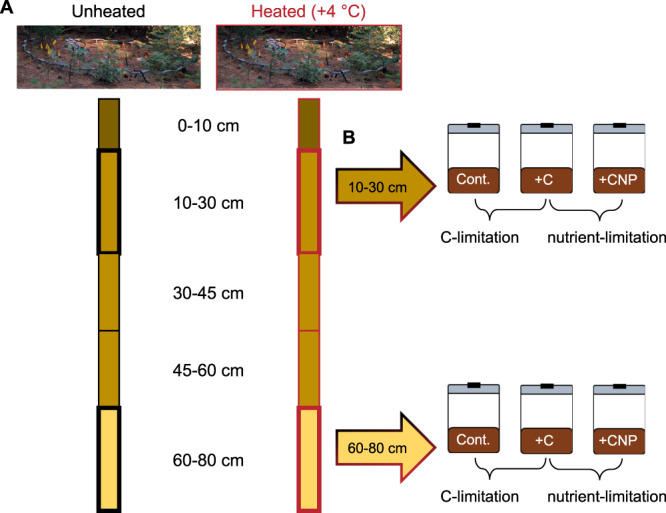
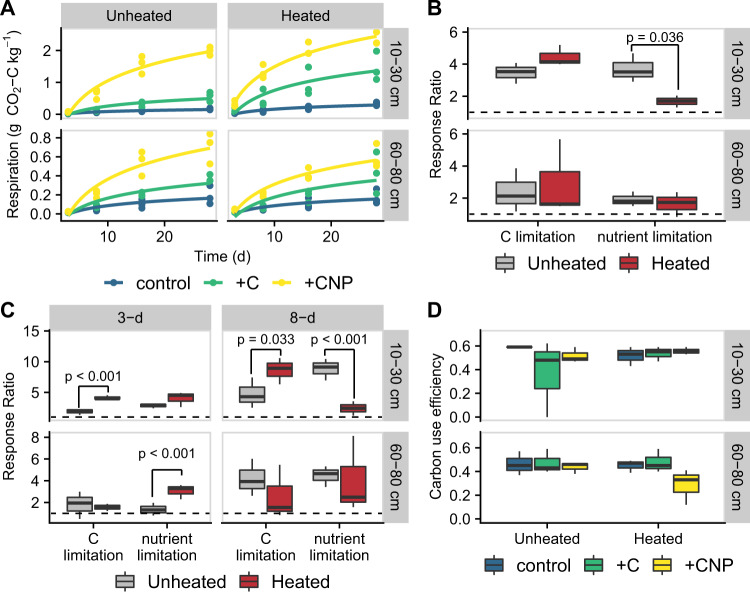
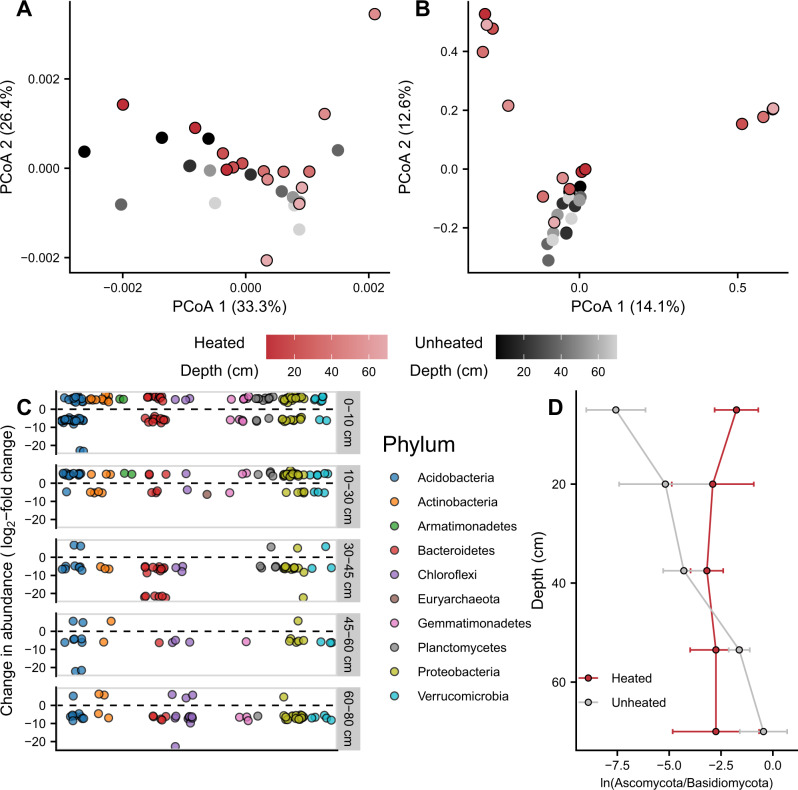
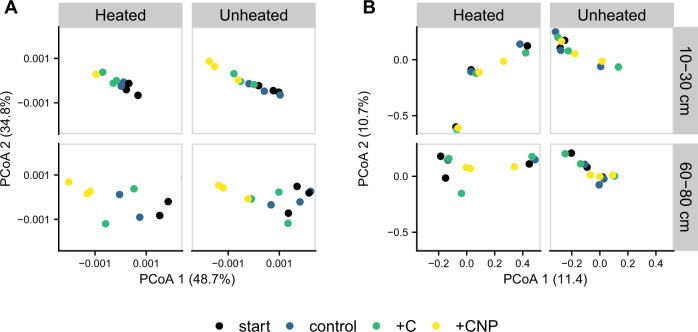
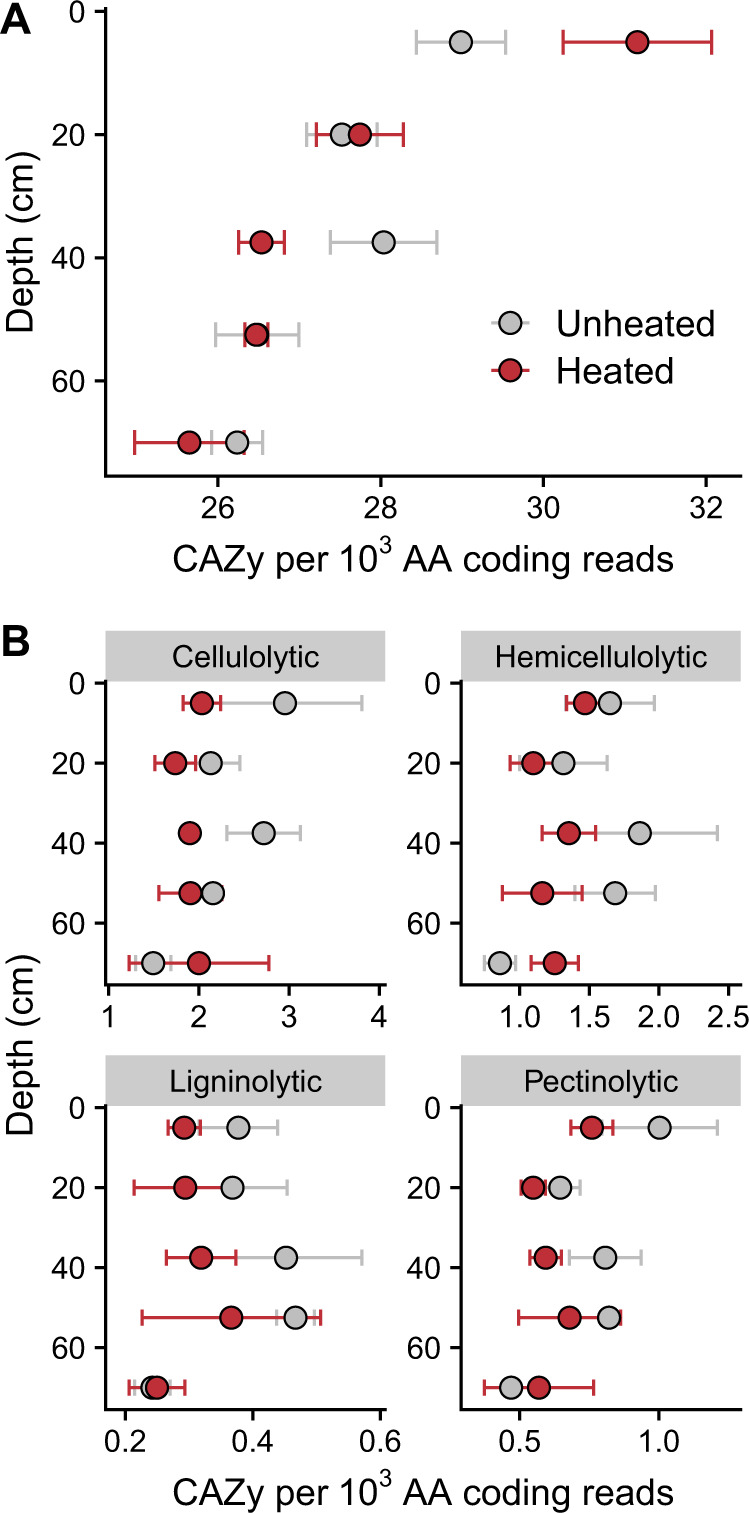
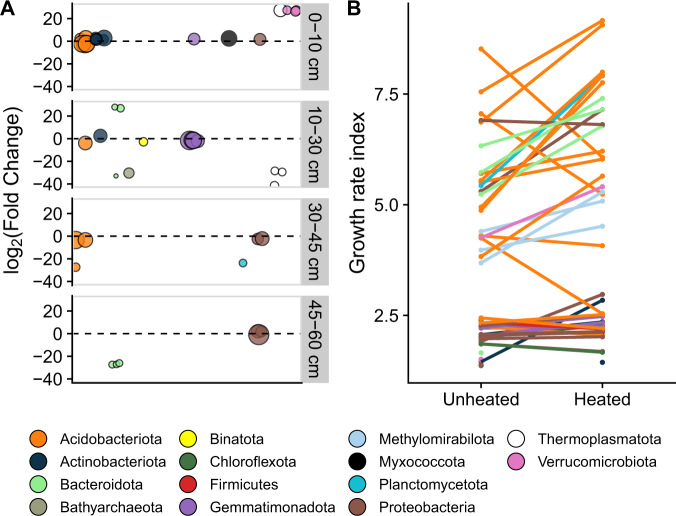
Increasing global temperatures are predicted to stimulate soil microbial respiration. The direct and indirect impacts of warming on soil microbes, nevertheless, remain unclear. This is particularly true for understudied subsoil microbes. Here, we show that 4.5 years of whole-profile soil warming in a temperate mixed forest results in altered microbial community composition and metabolism in surface soils, partly due to carbon limitation. However, microbial communities in the subsoil responded differently to warming than in the surface. Throughout the soil profile-but to a greater extent in the subsoil-physiologic and genomic measurements show that phylogenetically different microbes could utilize complex organic compounds, dampening the effect of altered resource availability induced by warming. We find subsoil microbes had 20% lower carbon use efficiencies and 47% lower growth rates compared to surface soils, which constrain microbial communities. Collectively, our results show that unlike in surface soils, elevated microbial respiration in subsoils may continue without microbial community change in the near-term.


Conflict of interest statement

The authors declare no competing interests.

Figures

Fig. 1
Fig. 1. Field and laboratory experimental design.
To test for the effect of warming in the field (A), we sampled five soil horizons (0–10, 10–30, 30–45, 45–60, and 60–80 cm) from unheated and heated (+4 °C) plots (n = 3). The 10–30 and 60–80 cm horizons from each plot were incubated for 30-d with no amendment (Cont.), cellobiose (+C), or cellobiose with inorganic nitrogen and phosphorus (+CNP) to assess the relative resource limitation of each soil (B). The response ratio of +C/Cont. and +CNP/+C was used to determine the relative C- and nutrient limitation, respectively.
Fig. 2
Fig. 2. Process rate measurements from the incubation experiment.
A Cumulative microbial respiration (with best-fit regression) measured over the 30-d incubation for each amended soil. B Boxplots (n = 3) show resource limitations of cumulative microbial respiration across both depths and heating treatments. C Boxplots (n = 3) show resource limitations of microbial respiration at 3 and 8 days of the incubation across both depths and heating treatments. Dashed line at 1.0 in panels B, C indicates no limitation. D Means (and standard error [n = 3]) of carbon use efficiency for each amended soil. Carbon limitation (C limitation) is assessed by the response of the carbon-amended soils (+C) divided by the control soil, and nutrient limitation is assessed by the response of the carbon- and nutrient-amended soil (+CNP) divided by the carbon-amended soil (+C). For boxplots (panels BD), the median is indicated by the thick black line, and the lower and upper hinges correspond to the first and third quartiles. The lower and upper whiskers extend to smallest or largest value, respectively, no further than 1.5 times the interquartile range. Asterisk (*) indicates significant differences (p < 0.05) between heating treatments (mixed-effects model).
Fig. 3
Fig. 3. Microbial communities change with heating and depth.
Ordinations of microbial communities using Principal Coordinates Analysis (PCoA) for prokaryotes (A) and fungi (B). Points denote individual samples. Red colors show heated plots and black colors show unheated control plots. Saturated colors show upper depths and unsaturated colors show deeper depths. Prokaryote operational taxonomic units with significant changes in abundance by soil heating (Wald test: p < 0.05) are shown by phylum and across depths (C). Relative abundances of fungal phyla (i.e., Ascomycota to Basidiomycota ratios) are shown for heated (red) and unheated (gray) soils (D). Error bars show ±one standard error (n = 3).
Fig. 4
Fig. 4. Change in community composition during the 30-d incubation.
Incubations were amended with carbon (C) or carbon, nitrogen, and phosphorus (CNP) compared to the starting conditions and unamended control for prokaryote (A) and fungi (B) across the heating treatments and depths. Points denote individual samples.
Fig. 5
Fig. 5. Distribution and composition of carbohydrate-active enzymes (CAZy) genes throughout heated and unheated soil profiles.
Total abundance of CAZy genes (A) and abundance of functionally classified CAZy genes (B) corrected by amino acid (AA) coding reads across heating treatments and depths. Error bars represent standard error of the mean (n = 3).
Fig. 6
Fig. 6. Change in abundance and growth rate of metagenome-assembled genomes (MAGs) with soil heating.
MAGs with significant changes in abundance by soil heating (Wald test: p < 0.050) are shown by phylum and across depths (A; note no significantly different MAGs were found in the 60–80 cm soil depth). Points denote individual MAGs and sizes represent the average relative abundance of the MAG in the unheated plots. The average growth rate index across all depths is plotted for each MAG shown by phylum (B).

Similar articles

Cited by

References

    1. Conant RT, et al. Temperature and soil organic matter decomposition rates—synthesis of current knowledge and a way forward. Glob. Change Biol. 2011;17:3392–3404. doi: 10.1111/j.1365-2486.2011.02496.x. - DOI
    1. Yost JL, Hartemink AE. How deep is the soil studied—an analysis of four soil science journals. Plant Soil. 2020;452:5–18. doi: 10.1007/s11104-020-04550-z. - DOI
    1. Jobbágy EG, Jackson RB. The vertical distribution of soil organic carbon and its relation to climate and vegetation. Ecol. Appl. 2000;10:423–436. doi: 10.1890/1051-0761(2000)010[0423:TVDOSO]2.0.CO;2. - DOI
    1. Dove NC, et al. Continental-scale patterns of extracellular enzyme activity in the subsoil: an overlooked reservoir of microbial activity. Environ. Res. Lett. 2020;15:1040a1. doi: 10.1088/1748-9326/abb0b3. - DOI
    1. Hicks Pries CE, Castanha C, Porras RC, Torn MS. The whole-soil carbon flux in response to warming. Science. 2017;355:1420–1423. doi: 10.1126/science.aal1319. - DOI - PubMed

Publication types