. 2021 Apr 7;12(1):2080.
doi: 10.1038/s41467-021-22207-y.

Genetic substructure and complex demographic history of South African Bantu speakers

Affiliations

Genetic substructure and complex demographic history of South African Bantu speakers

Dhriti Sengupta et al. Nat Commun. .

Abstract

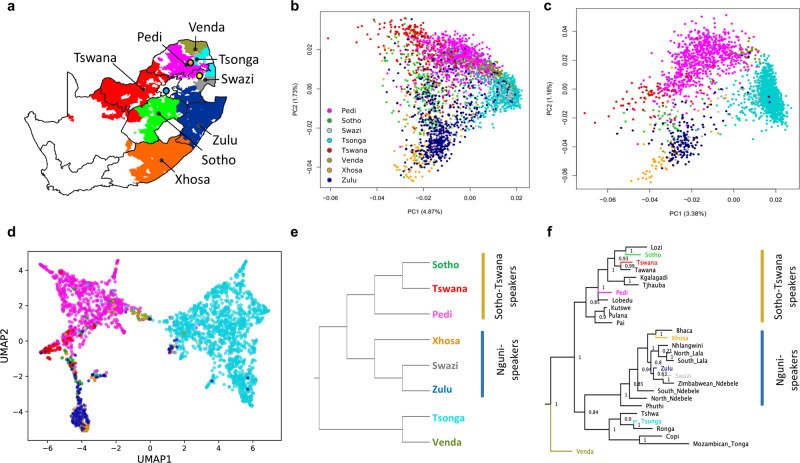
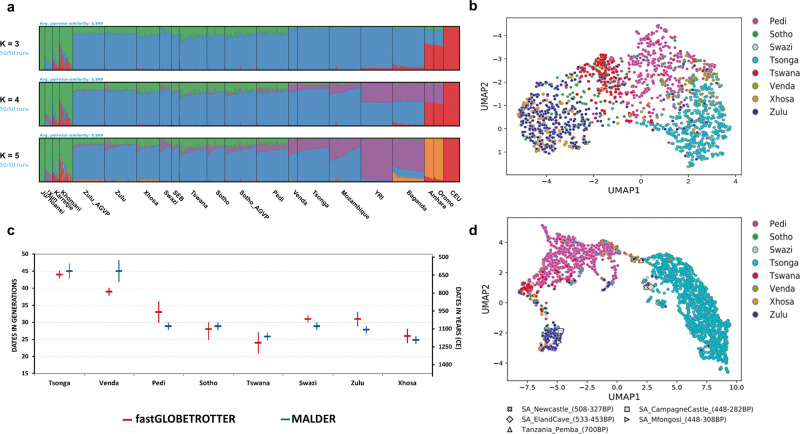
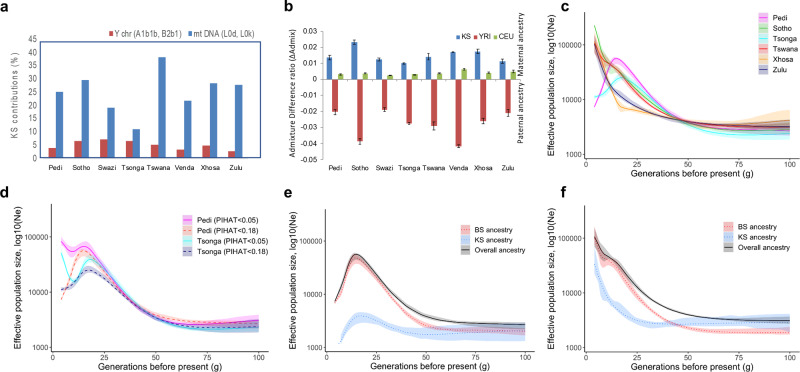
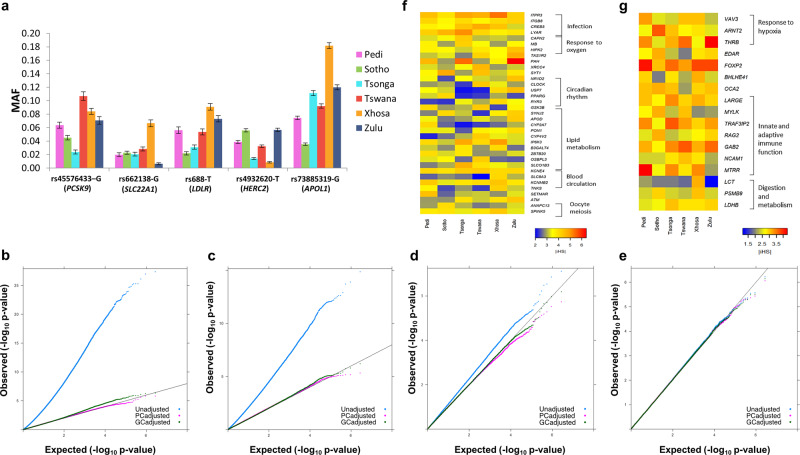
South Eastern Bantu-speaking (SEB) groups constitute more than 80% of the population in South Africa. Despite clear linguistic and geographic diversity, the genetic differences between these groups have not been systematically investigated. Based on genome-wide data of over 5000 individuals, representing eight major SEB groups, we provide strong evidence for fine-scale population structure that broadly aligns with geographic distribution and is also congruent with linguistic phylogeny (separation of Nguni, Sotho-Tswana and Tsonga speakers). Although differential Khoe-San admixture plays a key role, the structure persists after Khoe-San ancestry-masking. The timing of admixture, levels of sex-biased gene flow and population size dynamics also highlight differences in the demographic histories of individual groups. The comparisons with five Iron Age farmer genomes further support genetic continuity over ~400 years in certain regions of the country. Simulated trait genome-wide association studies further show that the observed population structure could have major implications for biomedical genomics research in South Africa.


Conflict of interest statement

The authors declare no competing interests.

Figures

Fig. 1
Fig. 1. Population structure and genetic affinities of South-Eastern Bantu-speaking (SEB) groups from South Africa correspond to both linguistic phylogeny and geographic distribution.
a Map showing the language majority areas (LMAs) of each SEB group. The centroid of each of the regions is indicated using a black dot. The three sampling sites are shown in coloured circles; Soweto in blue, Dikgale in orange and Agincourt in yellow. The original map was obtained from: https://en.wikipedia.org/wiki/Languages_of_South_Africa#/media/File:South_Africa_2011_dominant_language_map.svg. The user acknowledges Stats SA as the source of the basic data wherever they process, apply, utilise, publish or distribute the data, and also that they specify that the relevant application and analysis (where applicable) result from their own processing of the data. The language centroid points were calculated for this study (see methods for details). b Principal Component (PC) plot for the unrelated SEB samples (Pedi N = 1065, Sotho N = 366, Swazi N = 126, Tsonga N = 1644, Tswana N = 242, Venda N = 73, Xhosa N = 177 and Zulu N = 626) shows an overall correspondence between the distribution of SEB groups on the geographic map and the PCA. The colours showing the LMA for each SEB group on the geographic map corresponds to the colours used for the SEB group in the PCA. c PC plot based on ethno-linguistically concordant samples (self-reported ancestry of the participant is the same as at least 5 of the parents and grandparents) (Pedi N = 851, Sotho N = 46, Swazi N = 30, Tsonga N = 1438, Tswana N = 73, Venda N = 24, Xhosa N = 63 and Zulu N = 177) shows much clearer separation between the three major linguistic divisions (Sotho-Tswana, Nguni, and Tsonga speakers). d A composite representation of the first 10 PCs (generated using PCA-UMAP) also shows separation of the SEB groups corresponding to the three major linguistic divisions. e UPGMA tree based on pairwise FST distance between SEB groups. Sample sizes are same as of panels c. f, Linguistic phylogeny based on lexical data (majority-rule consensus tree) with posterior probability values. The SEB groups from the current study are indicated using the same colours as used in the PCA plots. The topology of the trees in e and f shows an overall alignment.
Fig. 2
Fig. 2. Gene flow into and genetic continuity of South-Eastern Bantu-speaking (SEB) groups.
a ADMIXTURE plots (from K = 3 to K = 5) based on the merged dataset with downsized ethno-linguistically concordant individuals (Pedi N = 80, Sotho N = 45, Swazi N = 30, Tsonga N = 80, Tswana N = 70, Venda N = 23, Xhosa N = 59, Zulu N = 80, Sotho_AGVP N = 80, Zulu_AGVP N = 80, Mozambique N = 80, SEB N = 19, Amhara N = 24, Oromo N = 24, Baganda N = 80, YRI N = 80, CEU N = 80, Juǀʼhoansi N = 14, Karretjie N = 17,!Xun N = 19 and Khomani N = 34). At K = 3, the plot shows differences in the level of Khoe-San gene flow (shown in green) into different SEB groups, with Tswana and Xhosa showing the highest Khoe-San ancestry proportion and Tsonga and Venda the lowest. Baganda (from Uganda); Amhara, Oromo and Somali (from Ethiopia); Sotho_AGVP and Zulu_AGVP (from South Africa) are from (ref. ) datasets. The Yoruba (YRI) and Central European (CEU) are from the 1000 Genomes Project dataset. b Composite representation of the first 10 PCs (generated using ancestry-specific PCA-UMAP) showing population structure in SEB groups persists even after Khoe-San ancestry masking. Sample sizes are same as of Fig. 1c. c Dates for Khoe-San admixture in SEB populations estimated using fastGLOBETROTTER (red dates) and MALDER (blue dates). Figure also showing 95% CI bars (vertical lines) from each method. First y-axis shows admixture dates in generations ago, while the second y-axis shows the actual estimated dates. Confidence intervals (95% CI) of estimates of dates were based on 50 bootstrap replicates for each population in each admixture dating analysis. CE refers to the Common Era. d Composite representation of the first 10 PCs comparing Iron-Age genomes to our SEB groups indicate genetic continuity for the last few centuries in certain regions of South Africa. Sample sizes are same as of Fig. 1c.
Fig. 3
Fig. 3. Insights into the demographic history of South-Eastern Bantu-speaking (SEB) groups.
a Distribution of Khoe-San (KS) associated mitochondrial and Y-chromosome haplogroups in the SEB groups shows higher maternal contribution from Khoe-San. b The analysis of admixture difference ratio (based on X chromosomal and autosomal contributions) confirms this trend and shows the level of bias to vary strongly between the SEB groups. The bars show admixture differences for the three contributing ancestries. Blue shows Khoe-San, red shows Bantu-speaker (represented by KGP Yoruba (YRI)) and green shows Eurasian (represented by KGP Central European (CEU)) ancestries for each SEB group. Positive bar values denote a maternal bias whereas negative values denote paternal bias in contributions from an ancestry. The error bars are based on 50 bootstrapping iterations with 20 samples each (source data provided in Source Data file). c Effective population size (Ne) fluctuations (estimated using IBDNe) shows SEB groups to differentiate mainly in the last 40 generations. d Ne profile differences in Pedi and Tsonga before and after removal of individuals with 0.05<PIHAT < 0.18. e, f Ancestry-specific IBDNe based evaluation of the relative contribution of Khoe-San and BS to the Ne profiles in e Pedi, and f Tswana. For e and f, the black line shows the overall (“true”) Ne while the red and blue lines show the Ne for BS and Khoe-San ancestral components, respectively. The plots show the level of Khoe-San ancestry to correlate with the extent of influence on overall Ne. For cf, the lines represent maximum likelihood inference, with shaded regions demarcating 95% confidence intervals based on 80 bootstrapping runs.
Fig. 4
Fig. 4. Possible impact of population structure within the South-Eastern Bantu-speaking (SEB) groups on genome-wide association studies (GWASs) and evolutionary estimates.
a Allele frequency variation of some of the well-known phenotype associated SNPs. The mean and the standard error was estimated using 50 random resampling runs with 30 samples each (source data provided in Source Data file). be Representative QQ plots showing results from simulated-trait GWASs comparing randomly sampled participants from b Agincourt (AGT) as cases to Soweto (SWT) as controls c 62.5% AGT + 37.5% SWT participants as cases to 100% SWT participants as controls. d Random samples from SWT without Tswana as cases to random samples from SWT with Tswana as controls. e Randomly sampled individuals from SWT as cases and controls. The Observed (−log10 P-values) represent GWAS association results derived by logistic regression (two-tailed). The Expected (−log10 P-values) are those based under the null hypothesis. For be, blue dots represent raw P-values, whereas purple and green dots represent P-values after principal component and genomic control based correction, respectively. f Heatmap showing differences in iHS statistics for some of the SNPs that were detected as outliers (|iHS| > 4; P-value < 0.003) in at least two of the SEB groups. g Heatmap showing differences in iHS statistics for SNPs in genes previously reported to be under positive selection, that were also detected to show moderate scores in one or more of the SEB groups (|iHS| > 3, P-value < 0.05).

References

    1. Deacon, H. J. & Deacon, J. Human Beginnings in South Africa: Uncovering the Secrets of the Stone Age (New Africa Books, 1999).
    1. Wadley L, Hodgskiss T, Grant M. Implications for complex cognition from the hafting of tools with compound adhesives in the Middle Stone Age, South Africa. Proc. Natl. Acad. Sci. USA. 2009;106:9590–9594. doi: 10.1073/pnas.0900957106. - DOI - PMC - PubMed
    1. d’Errico F, et al. Early evidence of San material culture represented by organic artifacts from Border Cave, South Africa. Proc. Natl. Acad. Sci. USA. 2012;109:13214–13219. doi: 10.1073/pnas.1204213109. - DOI - PMC - PubMed
    1. Lander F, Russell T. The archaeological evidence for the appearance of pastoralism and farming in southern Africa. PLoS ONE. 2018;13:e0198941. doi: 10.1371/journal.pone.0198941. - DOI - PMC - PubMed
    1. Sadr, K. Oxford Handbook of African Archaeology 645–655 (Oxford University Press, 2013).

Publication types

LinkOut - more resources