. 2021 Apr 7;12(1):2093.
doi: 10.1038/s41467-021-21933-7.

Structural variant evolution after telomere crisis

Affiliations

Structural variant evolution after telomere crisis

Sally M Dewhurst et al. Nat Commun. .

Abstract

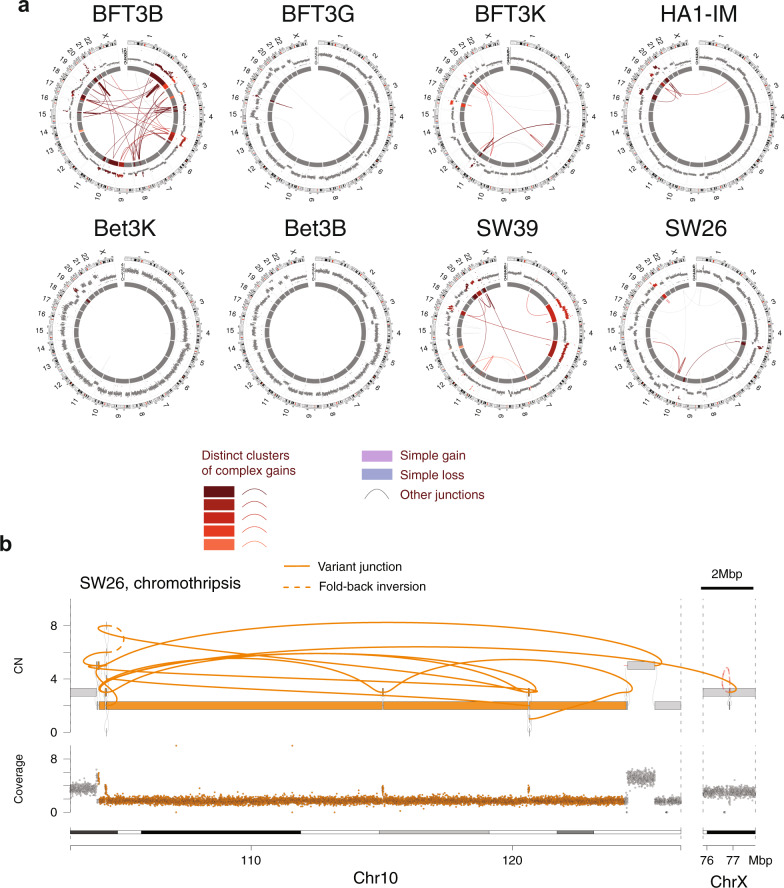
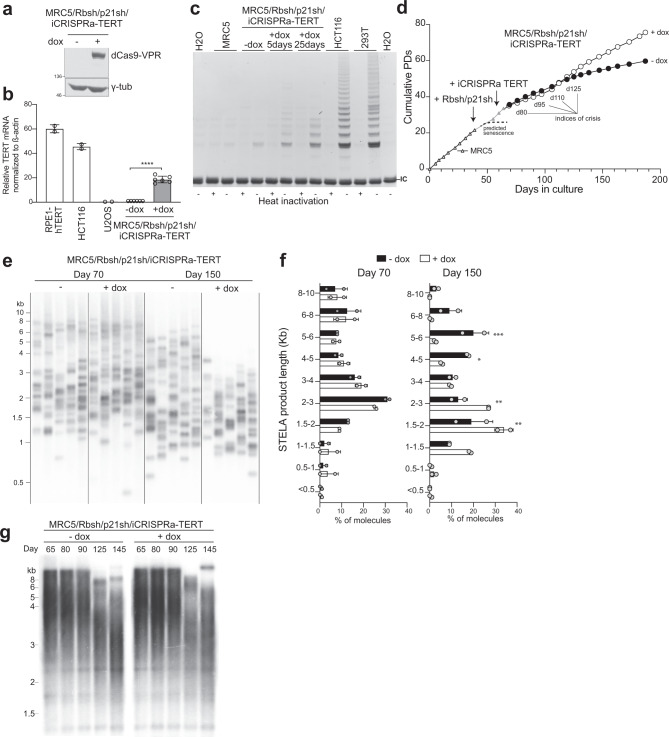
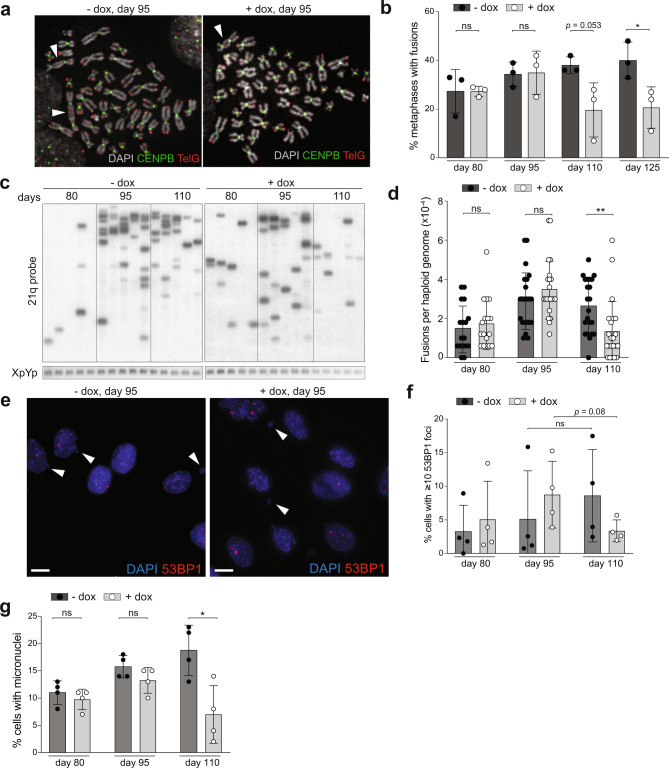
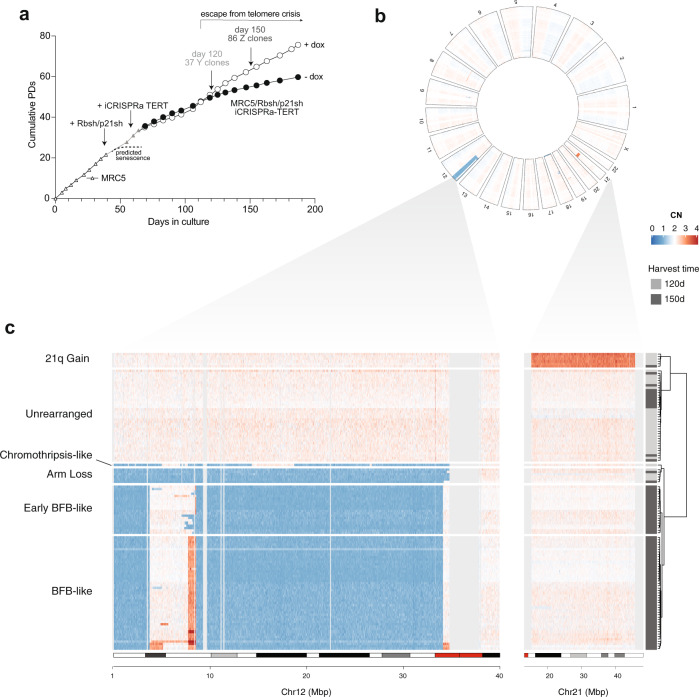
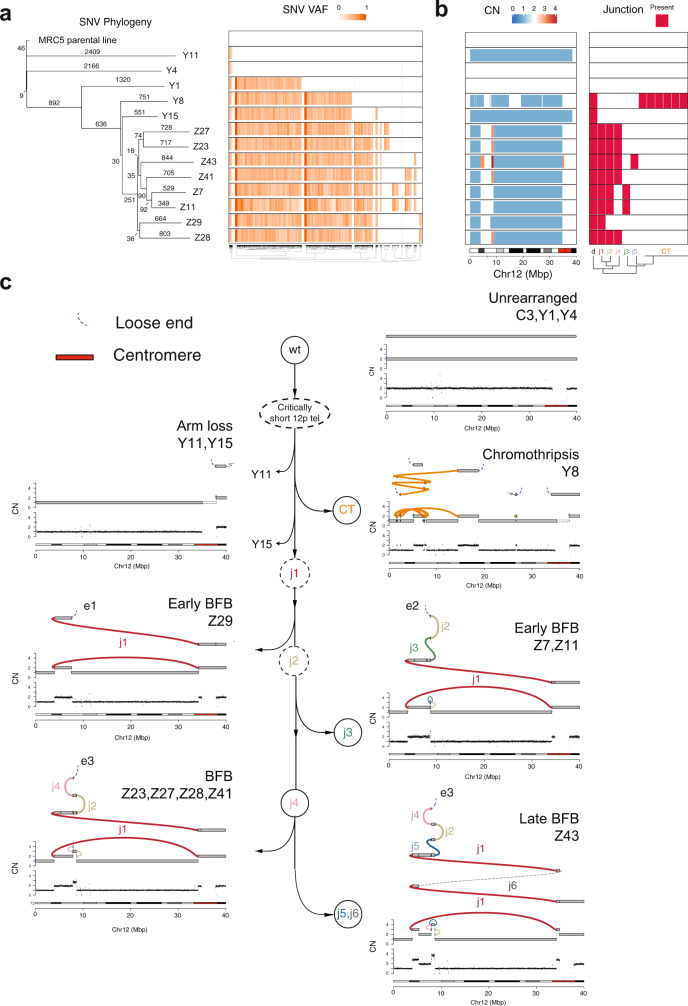
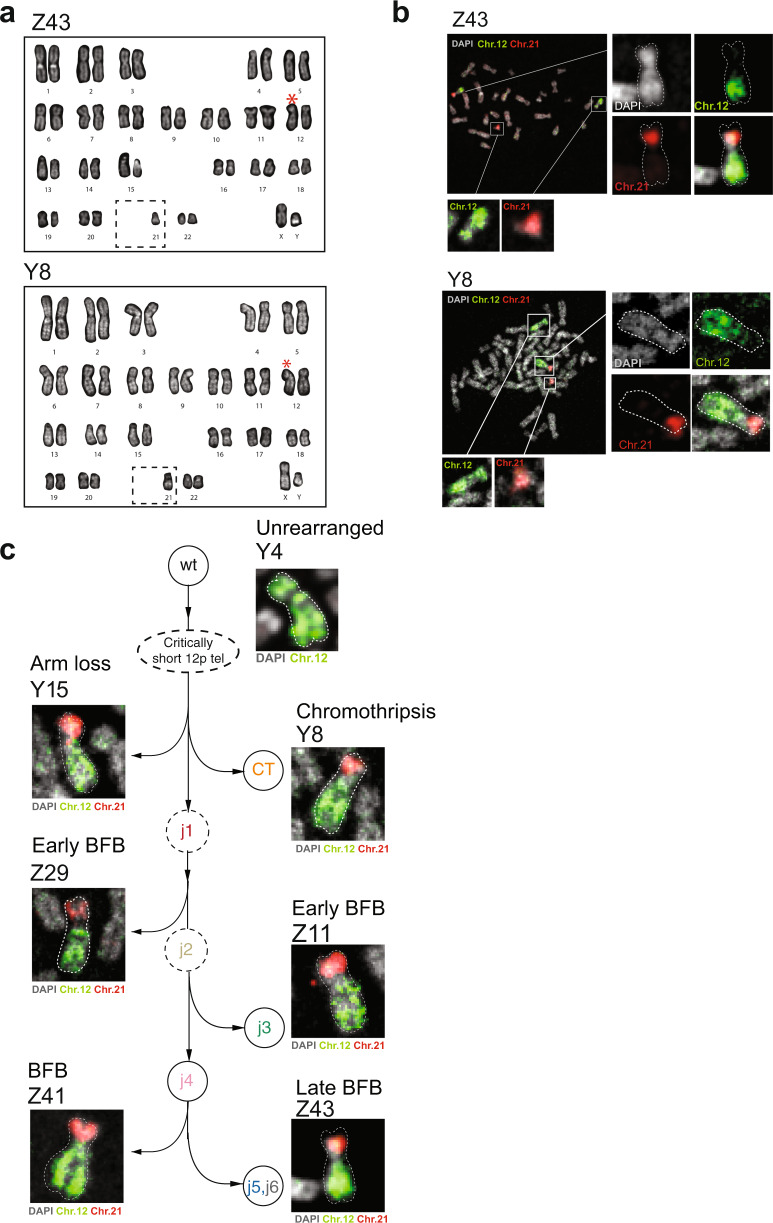
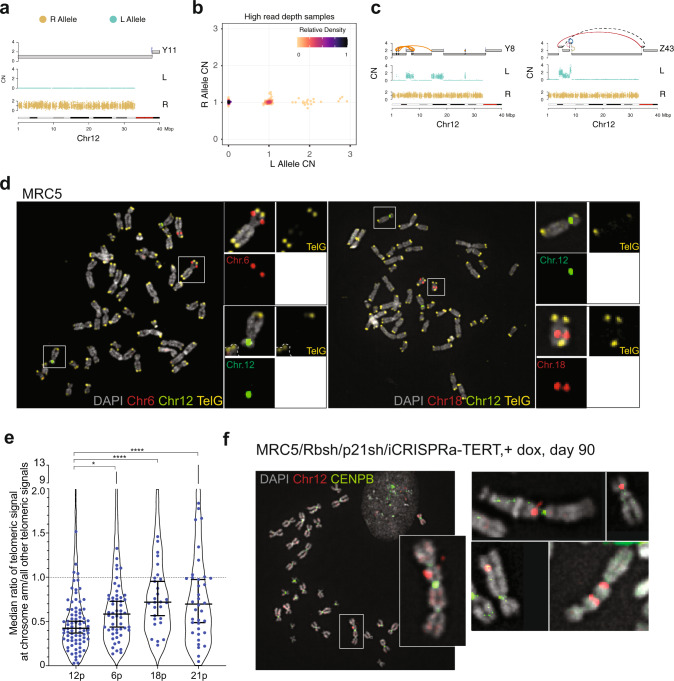
Telomere crisis contributes to cancer genome evolution, yet only a subset of cancers display breakage-fusion-bridge (BFB) cycles and chromothripsis, hallmarks of experimental telomere crisis identified in previous studies. We examine the spectrum of structural variants (SVs) instigated by natural telomere crisis. Eight spontaneous post-crisis clones did not show prominent patterns of BFB cycles or chromothripsis. Their crisis-induced genome rearrangements varied from infrequent simple SVs to more frequent and complex SVs. In contrast, BFB cycles and chromothripsis occurred in MRC5 fibroblast clones that escaped telomere crisis after CRISPR-controlled telomerase activation. This system revealed convergent evolutionary lineages altering one allele of chromosome 12p, where a short telomere likely predisposed to fusion. Remarkably, the 12p chromothripsis and BFB events were stabilized by independent fusions to chromosome 21. The data establish that telomere crisis can generate a wide spectrum of SVs implying that a lack of BFB patterns and chromothripsis in cancer genomes does not indicate absence of past telomere crisis.


Conflict of interest statement

T.d.L. is on the SAB of Calico Life Sciences, LLC. The remaining authors declare no competing interests.

Figures

Fig. 1
Fig. 1. Genomic complexity after spontaneous telomerase activation.
a CIRCOS plots showing eight cell lines that emerged spontaneously from telomere crisis (Supplementary Table 1), five of which show one or more clusters of complex gains. Binned purity- and ploidy-transformed read depth is shown in the periphery, with colored links in the center representing variant (rearrangement) junctions. A series of red colors is used to show junctions and read-depth bins belonging to distinct clusters of complex gains in each cell line. Additional colors describe junctions and bins, including those belonging to simple losses and gains (see “Methods” for details regarding junction and bin classifications). b A chromothripsis event in SW26. From bottom to top, chromosomal bands, purity–ploidy-transformed binned coverage data, JaBbA reconstructed copy number with gray and colored edges indicating variant junctions. Dashed colored edges represent fold-back inversion junctions.
Fig. 2
Fig. 2. An in vitro system for a telomerase-mediated escape from natural telomere crisis.
a Immunoblot for dCas9-VPR (using a Cas9 Ab) in MRC5/Rbsh/p21sh/iCRISPRa-TERT cells with or without doxycycline treatment for 96 h (see also Supplementary Fig. 2A, B). The blot shown is representative of at least two experiments. b qPCR of TERT mRNA expression in RPE-1, HCT116, U2OS (n = 2), and MRC5/Rbsh/p21sh/iCRISPRa-TERT cells with and without doxycycline treatment (n = 6). Values are normalized to β-actin mRNA. Error bars represent means ± SDs; P value from two-tailed Student’s t test; ****P < 0.0001. c TRAP assay on MRC5 and MRC5/Rbsh/p21sh/iCRISPRa-TERT cells with and without doxycycline treatment for indicated time periods. HCT116 and 293T (Phoenix) cells are included as positive controls. IC = internal control PCR product at 36 bp. The gel shown is representative of at least two experiments. d Growth curve of parental MRC5 cells, MRC5/Rbsh/p21sh cells, and MRC5/Rbsh/p21sh/iCRISPRa-TERT cells grown with or without doxycycline. Arrows indicate when each construct was introduced. Days in culture represent total time in culture from parental MRC5 cells to late passage MRC5/Rbsh/p21sh/iCRISPRa-TERT cells. Time points for telomere analysis (presented in Fig. 3) and the approximate onset of senescence in the parental MRC5 cells are indicated. e STELA of XpYp telomeres in MRC5/Rbsh/p21sh/iCRISPRa-TERT cells with or without doxycycline treatment at 70 and 150 days of culture. f Quantification of band intensity in e, with background signal subtracted. Data from two independent experiments (see also Supplementary Fig. 2D) were analyzed with two-way ANOVA with multiple comparisons; all points at day 70 are not significant, day 150; 5–6 kb P = 0.0005; 4–5 kb P = 0.0199; 2–3 kb P = 0.005; 1.5–2 kb P = 0.0025. Biological replicates represent cells at approximately the same days in culture (±5 days). g Genomic blot of telomeric MboI/AluI fragments in MRC5/Rbsh/p21sh/iCRISPRa-TERT cells grown with or without doxycycline at the indicated time points. The blot shown is representative of at least two experiments.
Fig. 3
Fig. 3. Dissipating telomere crisis in MRC5/Rbsh/p21sh/iCRISPRa-TERT cells.
a Metaphase spreads from MRC5/Rbsh/p21sh/iCRISPRa-TERT cells with and without doxycycline at day 95. Telomeres are detected with a telomeric repeat PNA probe (TelG, red), and centromeres are detected with a probe for CENPB (green). DNA was stained with DAPI (gray). Chromosome fusions are indicated by white arrowheads. b Quantification of the percentage of metaphase spreads with at least one fusion after the indicated days of continuous culture for MRC5/Rbsh/p21sh/iCRISPRa-TERT cells with and without doxycycline (see also Supplementary Fig. 3A), two-tailed Student’s t test; ns not significant, *P = 0.0422. c Gel showing products of telomere fusion PCR on MRC5/Rbsh/p21sh/iCRISPRa-TERT cells cultured with and without doxycycline for the indicated time. Each lane represents an independent replicate PCR reaction. Telomere fusion products are detected by hybridization with a probe for the 21q telomere (see “Methods”), and the control XpYp PCR product is detected with ethidium bromide staining. d Quantification of the number of telomere fusion products per haploid genome using the assay shown in panel c. Each dot represents a single PCR reaction. Reactions from two independent biological replicates are shown, two-tailed Student’s t test; ns not significant; **P = 0.0061. e Detection of micronuclei (arrowheads) and DNA damage foci using indirect immunofluorescence for 53BP1 (red) in the indicated cells. DNA is stained with DAPI (blue); scale bar (white) = 10 µm. f Quantification of the percentage of cells with >10 53BP1 foci at the indicated time points; two-tailed Student’s t test; ns not significant. g Quantification of the percentage of cells with micronuclei after the indicated days in culture, two-tailed Student’s t test; ns not significant; *P = 0.0157. In panels b, f, and g, error bars indicate means and standard deviations from three independent biological replicates.
Fig. 4
Fig. 4. Genomic screening of post-crisis clones.
a Growth curve of MRC5/Rbsh/p21sh/iCRISPRa-TERT cells with and without doxycycline, indicating the time points at which single-cell clones were derived (day 120 and day 150). b Circular heatmap showing genome-wide binned purity- and ploidy-transformed read depth (in units of CN across 118 low-pass WGS-profiled clones. Heatmap rows correspond to concentric rings in the heatmap. Clones are clustered with respect to genome-wide copy number profile similarity (see “Methods”). c Zoomed-in portion of chromosomes 12 and 21 that underwent copy number alterations in a majority of the clones, clustered based on their coverage across these regions. Clusters are named with respect to their consensus copy number pattern, and on the basis of high-depth WGS analyses presented in Fig. 5. Chromosome 21 gain n = 6 clones; unrearranged n = 38; chromothripsis-like n = 1; arm loss n = 6; early BFB-like n = 20; BFB-like n = 47.
Fig. 5
Fig. 5. High-resolution reconstruction and lineage of post-crisis genomes.
a SNV-based phylogeny inferred across 13 high-depth WGS clones and heatmap of variant allele fractions (VAF) for SNVs detected among two or more clones. For simplicity, private SNVs (those found only in a single clone) are not shown. b Heatmap of chromosome 12p copy numbers and variant junction patterns in chromosome 12 (see the text and “Methods”). c Proposed tree showing distinct trajectories of structural variant evolution following 12p attrition and subsequent telomere crisis. Each terminal node in the tree is associated with a unique 12p profile comprising a representative binned read-depth pattern (bottom track) from one or more clones mapping to an identical junction-balanced genome graph (second track from bottom). The top track in each profile represents a reconstruction of the rearranged allele. Each allele is a walk of genomic intervals and reference/variant junctions that, in combination with an unrearranged 12p allele (not shown), sum to the observed genome graph (see “Methods”). Two distinct arrows linking Y11 and Y15 demonstrate that these clones are distinct lineages (based on divergent SNV patterns, see panel a), that converge to identical WGS 12p CN profiles (although with likely distinct breakpoints inside the 12p centromere unmappable by WGS, see the text).
Fig. 6
Fig. 6. Resolution of BFB cycles in telomere crisis.
a DAPI banded karyotypes of post-crisis clones Z43 and Y8 showing a rearranged chromosome 12 (red star) and loss of one copy of chromosome 21 (dashed box) (see also Supplementary Fig. 6A). b Representative metaphase spreads of clone Z43 and Y8 hybridized with whole-chromosome pairs for chromosomes 12 (green) and 21 (red). DNA was stained with DAPI (gray). Insets show enlarged images of the 12–21 derivative marker chromosome and intact copies of the sister alleles (see also Supplementary Fig. 6B). c Images of derivative chromosome 12:21 from representative clones from each branch of the evolution of chromosome 12 post-crisis (according to the analysis in Fig. 5c). Metaphases were hybridized with whole-chromosome pairs for 12 (green) and 21 (red). DNA was stained with DAPI (gray).
Fig. 7
Fig. 7. A short telomere on one allele of 12p.
a Genomic track plots of parental alleles phased into lost (“L”) and retained (“R”) haplotypes (see “Methods”) on chromosome 12p of clone Y11. b Scatter plot showing purity- and ploidy-transformed L and R haplotype-specific allelic read depth across 12p segments in high-pass WGS-profiled post-crisis clones. c Genomic track plots of allelic read counts on the L and R allele of clones Y8 and Z43, two post-crisis clones that independently acquired structural variants on an otherwise unrearranged chromosome 12p allele. d Metaphase spreads of early-passage MRC5 cells hybridized with BAC probes to chromosome 12 (green) combined with probes for chromosome 6 or 18 (red) and a PNA probe for telomeres (TelG, yellow). Insets of white-boxed chromosomes are shown with each channel individually. e Quantification of the relative length of the shortest of the two 12p telomeres. Each dot shows the median ratio of the TelG signal of the shortest telomeres of the indicated chromosome arm to all other telomeres in each metaphase spread. Violin plots show the data from all telomeres analyzed. Chromosome 12 was identified using a specific BAC probe (Chr.12p11.2) in 79 metaphase spreads with a total of 3992 telomeres. Chromosomes 6 and 18 were identified based on BAC probe hybridization (Chr.6p21.2–21.3, Chr.18q12.3–21.1) in 53 and 28 metaphases, respectively (2629 and 1497 telomeres, respectively). Chromosome 21 was identified from DAPI banding patterns in 36 metaphases (1757 telomeres). P values were derived from a two-sided Student’s t test; *P = 0.0147; ****P < 0.0001. Error bars show median with 95% CI. f Dicentric chromosomes containing chromosome 12 in telomere crisis. Metaphase spreads from MRC5/Rbsh/p21sh/iCRISPRa-TERT cells cultured with doxycycline at day 90 (during crisis) were hybridized with a BAC probe for Chr.12p11.2 (red) and a CENPB PNA probe (green) to identify centromeres. A full spread is shown with white box inset zoom in. Further examples from other spreads are also shown (see also Supplementary Fig. 7B).

Similar articles

Cited by

References

    1. Drier Y, et al. Somatic rearrangements across cancer reveal classes of samples with distinct patterns of DNA breakage and rearrangement-induced hypermutability. Genome Res. 2013;23:228–235. doi: 10.1101/gr.141382.112. - DOI - PMC - PubMed
    1. Yang L, et al. Diverse mechanisms of somatic structural variations in human cancer genomes. Cell. 2013;153:919–929. doi: 10.1016/j.cell.2013.04.010. - DOI - PMC - PubMed
    1. Hadi K, et al. Distinct classes of complex structural variation uncovered across thousands of cancer genome graphs. Cell. 2020;183:197–210.e32. doi: 10.1016/j.cell.2020.08.006. - DOI - PMC - PubMed
    1. The ICGC/TCGA Pan-Cancer Analysis of Whole Genomes Consortium. Pan-cancer analysis of whole genomes. Nature578, 82–93 (2020). - PubMed
    1. Li Y, et al. Patterns of somatic structural variation in human cancer genomes. Nature. 2020;578:112–121. doi: 10.1038/s41586-019-1913-9. - DOI - PMC - PubMed

Publication types