. 2021 Apr 7;12(1):2091.
doi: 10.1038/s41467-021-22058-7.

Myofibril and mitochondria morphogenesis are coordinated by a mechanical feedback mechanism in muscle

Affiliations

Myofibril and mitochondria morphogenesis are coordinated by a mechanical feedback mechanism in muscle

Jerome Avellaneda et al. Nat Commun. .

Abstract

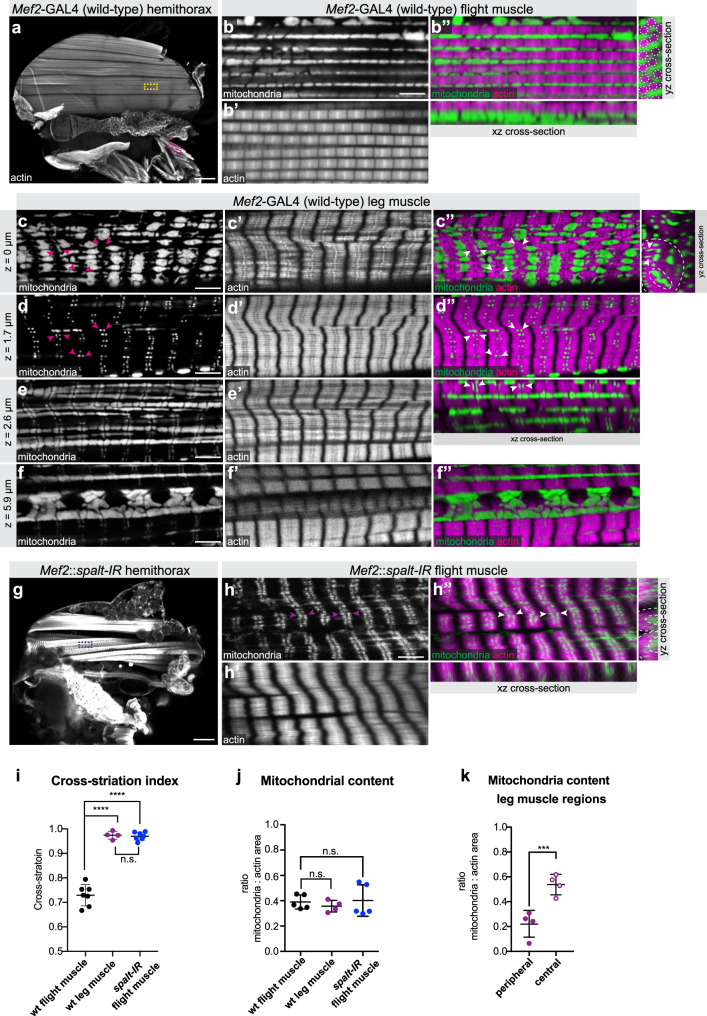
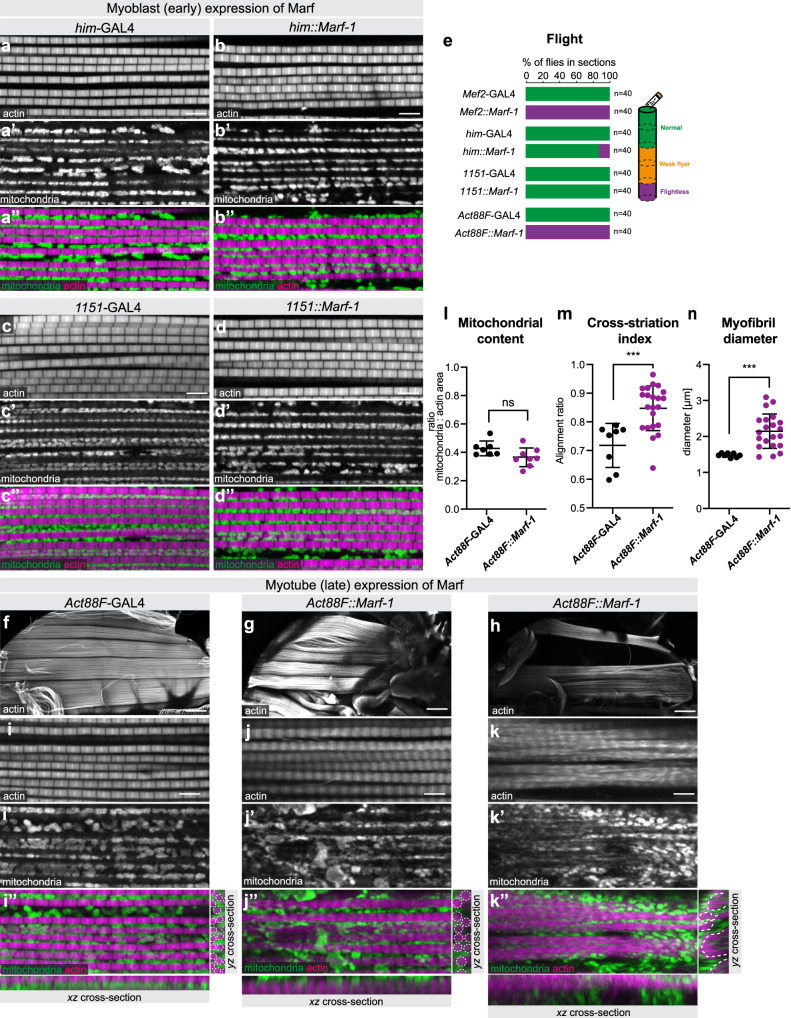
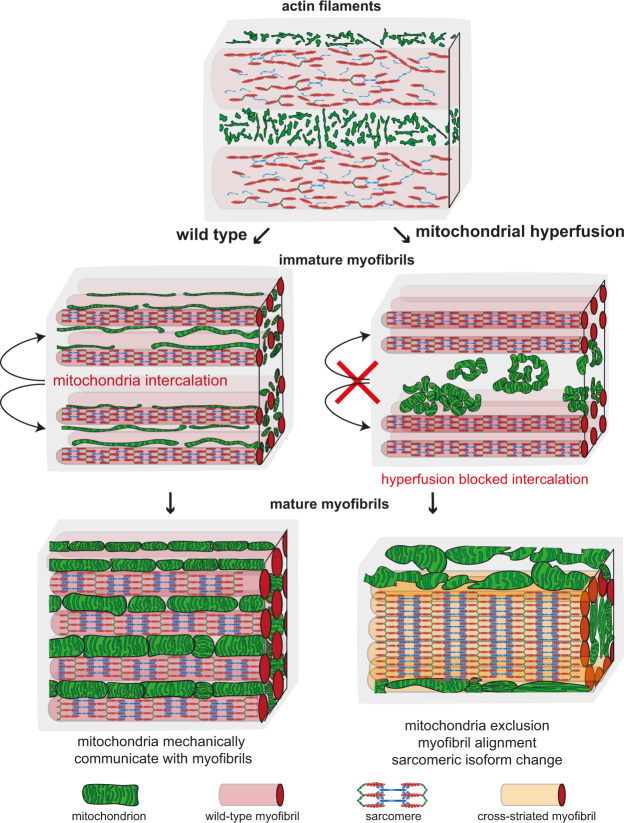
Complex animals build specialised muscles to match specific biomechanical and energetic needs. Hence, composition and architecture of sarcomeres and mitochondria are muscle type specific. However, mechanisms coordinating mitochondria with sarcomere morphogenesis are elusive. Here we use Drosophila muscles to demonstrate that myofibril and mitochondria morphogenesis are intimately linked. In flight muscles, the muscle selector spalt instructs mitochondria to intercalate between myofibrils, which in turn mechanically constrain mitochondria into elongated shapes. Conversely in cross-striated leg muscles, mitochondria networks surround myofibril bundles, contacting myofibrils only with thin extensions. To investigate the mechanism causing these differences, we manipulated mitochondrial dynamics and found that increased mitochondrial fusion during myofibril assembly prevents mitochondrial intercalation in flight muscles. Strikingly, this causes the expression of cross-striated muscle specific sarcomeric proteins. Consequently, flight muscle myofibrils convert towards a partially cross-striated architecture. Together, these data suggest a biomechanical feedback mechanism downstream of spalt synchronizing mitochondria with myofibril morphogenesis.


Conflict of interest statement

The authors declare no competing interests.

Figures

Fig. 1
Fig. 1. spalt regulates muscle type-specific mitochondria morphogenesis.
af Mef2-GAL4 (wild type) hemithorax (a), flight muscle (b) and leg muscle (cf) stained with phalloidin to visualise actin (magenta) and expressing mito-GFP to visualise the mitochondrial matrix (green). Yellow and magenta boxes in a indicate representative regions of flight and leg muscles magnified in bf. Single confocal plane as well as and xz yz cross-sections are shown (b″). Note the individualised myofibrils (dotted circles) surrounded by densely packed mitochondria. cf Leg muscle top (c), middle (d, e) and central slice (f) showing the tubular fibre morphology (yz cross-section), cross-striated myofibrils and complex mitochondrial shapes filling the surface and the centre of the myofiber and contacting the sarcomeric I-bands with thin extensions (magenta and white arrow heads). g, h Mef2::spalt-IR hemithorax (g) and flight muscle (h) display tubular fibre morphology (h″ yz cross-section), cross-striated myofibrils and centrally located mitochondria with thin extension towards the I-bands (arrow heads). ik Quantification of the lateral fibrillar alignment called cross-striation index in muscle (i; n = 6, 4, 6 animals respectively see Supplementary Fig. 1), the relative mitochondria content (j, relative to myofibril content; n = 5, 4, 5 animals respectively) and the mitochondria content in leg muscle regions (k; n = 4). Dotted lines on the yz cross-sections of c″ and h″ represent the regions measured. Note that higher mitochondria density in the centre of leg muscles. In all plots, individual circles represent individual animals, for each a minimum of five measurements was done, and mean ± standard-deviation (SD) is indicated. Significance from two-tailed unpaired t-tests is denoted as p-values ***p ≤ 0.001 or ****p ≤ 0.0001. (n.s.) non-significant. Scale bars are 100 µm (a, g) and 5 µm (b, cf, h).
Fig. 2
Fig. 2. Quantification of mitochondrial morphology in muscle types.
ae Highly resolved confocal sections of unfixed alive flight muscle mitochondria labelled with MOM-GFP expressed with Mef2-GAL4 (a) to segment the mitochondria outlines using machine learning (b, see Supplementary Fig. 2). In all, 3D segmentation of individual flight muscle mitochondria using Fiji with classification of individual mitochondria based on shape classifiers (c), see Methods section for the classification parameters. Total mitochondria number and their volumes in a 67.5 µm × 67.5 µm × 6.7 µm volume (d). Note the preferred orientation of the long mitochondrial axis with the axis of the myofibrils (e). fh Serial block-face electron microscopy of adult flight muscles, showing a longitudinal view (f). Note the intimate contact of mitochondria and myofibrils. Cross-section view of a 3D reconstruction of individual mitochondria shown in different colours (g) and of the myofibrils in magenta with one mitochondrion in light pink (h, Supplementary Movie 2). Note the mitochondrial indentations caused by pushing myofibrils. ik Fixed leg muscle mitochondria labelled with mitochondrial matrix GFP (mito-GFP) expressed with Mef2-GAL4 (Supplementary Movie 3). A representative peripheral (top) section of the z-stack (also used in Fig. 1c) and a yz-cross-section orthogonal view are shown (i). Interactive Watershed using Fiji allowed segmentation (j) and 3D reconstruction of individual mitochondria (k, Supplementary Movie 4). lq Serial block-face electron microscopy of adult a coxa muscle from a second thorax segment leg showing a longitudinal view (l). Note the small mitochondria parts located next to the I-bands, which extend from larger mitochondria seen in the 3D reconstruction (m, Supplementary Movie 7). n, q Mitochondria were individually segmented, allowing to measure total mitochondria number and their volumes in a 56 µm × 12.9 µm × 8.73 µm volume based on shape classifiers (n), see Methods section for the classification parameters. Note the orientation of the long mitochondrial axis with the axis of the myofibrils (o), similar to flight muscle mitochondria, despite the perpendicular extensions visible in individual mitochondria (p), yz-cross-section orthogonal view (q). Scale bars are 5 µm in a, i and 2 µm in f, l, q.
Fig. 3
Fig. 3. Myofibrils mechanically shape flight muscle mitochondria.
a Live dissection of hemithorax in which actin has been labelled with Cherry-Gma expressed with Mef2-GAL4. Black rectangle indicates a severed area, in which myofibrils have been mechanically cut, magenta rectangle marks an intact area. be High magnification confocal sections of intact (b, d) and severed areas (c, e) of unfixed flight muscles in which mitochondria have been labelled with MOM-GFP (expressed with Mef2-GAL4) (b, c) or with mito-GFP together with Cherry-Gma to label myofibrils (d, e). Note the spherical mitochondria shape and their disengagement from the myofibrils in the severed areas. f, g High magnification of unfixed flight muscle from wild type (f) or Mhc[10] mutant (g) adults genetically labelled with Cherry-Gma to label myofibrils (expressed with Mef2-GAL4) (f, g) and mito-GFP to label mitochondria (f′, g′). Note how similar the rounded Mhc[10] mitochondria (g′) are to the ones in severed myofibrils in e′. Scale bars are 100 µm (a) and 5 µm (bg).
Fig. 4
Fig. 4. Mitochondria dynamics can impact myofibril development.
ai Adult hemi-thoraces (a, b, f, g), flight muscles (d, e, h, i) and flight test (c) of the indicated genotypes. Actin has been visualised with phalloidin, mitochondria with mito-GFP. White dashed lines outline the myofibrils in the yz cross-sections (d″, e″). Note the small round mitochondria present between normal myofibrils upon Marf knock-down (e). Marf over-expression using UAS-Marf-1 or UAS-Marf-2 with Mef2-GAL4 causes fibre atrophy (f, g) and cross-striated myofibrils (h, i). Note that the mitochondria are largely separated from the aligned myofibrils, outlined by the dashed white line on the yz cross-sections (h″, i″). jl Quantification of mitochondrial content (relative to actin area) (j; n = 12, 12, 12, 11 animals, respectively), of individual mitochondrial area in a single confocal section (k; n = 6894 and 14443 total mitochondria, from five animals in each case) and the cross-striation index of the indicated genotypes (l; n = 6, 17, 10 animals, respectively). In all plots the mean ± standard-deviation (SD) is indicated, each dot the value from single animals (j, l) or confocal sections (k), and significance from two-tailed unpaired t-tests is denoted as p-values ***p ≤ 0.001, ****p ≤ 0.0001. n.s. non-significant. Scale bars are 100 µm (a, b, f, g) and 5 µm (d, e, h, i).
Fig. 5
Fig. 5. Mitochondria hyper-fusion causes a transcriptional shift to cross-striated muscle type.
ak Adult wild-type (a, e, i) as well as Mef2::Marf-1 flight muscles (b, f, j) and wild-type leg muscles (c, g, k) expressing GFP-tagged muscle-type specific proteins Actin 88F-GFP (ac), Flightin-GFP (eg) and Kettin-GFP (ik); samples were fixed and actin was visualised with phalloidin. Relative GFP fluorescence levels are represented via a pixel intensity scale (white represents higher intensity). d, h, l GFP fluorescence was quantified with quantitative confocal microscopy (see Methods section) and plotted relative to control flight muscle levels (in d n = 7, 8 and 5 animals, respectively; in h n = 9, 6 and 7 animals, respectively; in l n = 5, 12 and 5 animals, respectively). Note that Marf over-expression in flight muscle converts the expression levels towards wild-type leg muscle levels. mo Spalt protein levels in developing flight muscle myotubes at 24 h APF were quantified using immunostaining and quantitative confocal microscopy comparing wild type (m, o; n = 12 animals)) to Mef2::Marf-1 (n, o; n = 14 animals). Actin was visualised with phalloidin, nuclei with DAPI. Note the comparable expression levels. pr Bruno protein levels in developing flight muscle myotubes at 24 h APF were quantified using immunostaining and quantitative confocal microscopy comparing wild type (p, r; n = 6 animals) to Mef2::Marf-1 (q, r; n = 7 animals). Actin was visualised with phalloidin, nuclei with DAPI. In all plots the mean ± standard-deviation (SD) is indicated, each dot the value from single animals, and significance from two-tailed unpaired t-tests is denoted as p-values = 0.0287 (*), ***p ≤ 0.001. n.s. non-significant. Scale bars are 5 µm.
Fig. 6
Fig. 6. Developmental timing of mitochondrial dynamics impacts myofibril development.
ae Wild-type adult control (a, c) and early over-expression of Marf-1 with him-GAL4 (b) or 1151-GAL4 (d) flight muscles were stained with phalloidin and anti-complex V antibody to visualise myofibrils and mitochondria. Note the normal myofibril and mitochondria morphologies (b, d), which support flight (e). fn Wild-type control (f) and Act88F::Marf-1 hemi-thoraces (g, h), as well as flight muscles (ik) expressing Marf-1 during later developmental stages were stained with phalloidin and anti-complex V antibody to visualise myofibrils and mitochondria. Two representative phenotypes of Act88F::Marf-1 flight muscles are shown, displaying either thicker myofibrils (indicated by white dashed outline in the cross-section) (j) or partially cross-striated myofibrils (k). Mitochondria are largely excluded from myofibrillar bundles in Act88F::Marf muscles (see dashed white outline of the myofibril-rich areas in k″). ln Quantification of the Act88F::Marf flight muscle phenotypes, quantifying mitochondrial content (l; n = 7 and 8 animals, respectively), cross-striation index (m; n = 8 and 21 animals, respectively) and myofibril diameter (n; n = 8 and 21 animals, respectively). In all plots the mean ± standard-deviation (SD) is indicated and significance from two-tailed unpaired t-tests is denoted as ***p-values ≤ 0.001. n.s. non-significant. Scale bars are 5 µm (ad, ik) and 100 µm (fh).
Fig. 7
Fig. 7. Developmental effect of mitochondria hyper-fusion.
ah Developing wild-type flight muscles at 24 h after puparium formation (APF) (a, b) and 32 h APF (c, d), compared to Mef2::Marf-1 flight muscles at 24 h APF (e, f) and 32 h APF (g, h). See also Supplementary Movie 8. Mitochondria were visualised with mito-GFP and actin with phalloidin. Note the mitochondrial intercalation between myofibrils in wild-type 32 h APF flight muscles (c″), which is blocked by Mef2::Marf-1 (g″). il Developing wild-type (i, k) compared to Mef2::Marf-1 (j, l) flight muscles at 24 h APF visualised by electron microscopy (EM). Two representative regions at different magnifications are shown. Note the clustered and more rounded mitochondria upon Mef2::Marf-1. Scale bars are 2.5 µm (ag) or directly noted on EM images (il).
Fig. 8
Fig. 8. Mitochondria isolate individual myofibrils.
ah Developing wild-type flight muscles at 32 h after puparium formation (APF) (a, b) and 48 h APF (e, f), compared to Act88F::Marf-1 flight muscles at 32 h APF (c, d) and 48 h APF (g, h). See also Supplementary Movie 9. Mitochondria were visualised by immunostaining against complex V (ATPase) and actin with phalloidin. Note how mitochondria isolate myofibrils in wild type (e″) but fail to do so in Act88F::Marf-1 with mitochondria clustering centrally (g″). Scale bars are 2.5 µm.
Fig. 9
Fig. 9. Mitochondria–myofibril communication model.
Developing flight muscle schemes to highlight the interplay between mitochondria with actin filaments (top, early stage), immature myofibrils (middle, intermediate stage) and mature myofibrils (bottom, mature stage). Wild type is shown on the left and mitochondrial hyper-fusion on the right. At the actin filament stage, mitochondria display a filamentous network morphology spatially separated from the actin filament mesh. Upon myofibril assembly, mitochondria intercalate between myofibrils in wild type and establish a tight mechanical communication. Myofibril and mitochondrial diameter growth causes generation of mechanical pressure and isolates individual myofibrils. Mechanical feedback ensures the correct myofibril diameter. In contrast, hyper-fusion of mitochondria results in larger clustered mitochondrial networks that fail to intercalate between the immature myofibrils. As a consequence of mitochondrial exclusion, the mechanical communication between mitochondria and myofibrils is limited and myofibrils align with each other around centrally clustered mitochondria. Scheme for sarcomeric components was adapted from Lemke and Schnorrer.

References

    1. Gautel M, Djinovic-Carugo K. The sarcomeric cytoskeleton: from molecules to motion. J. Exp. Biol. 2016;219:135–145. doi: 10.1242/jeb.124941. - DOI - PubMed
    1. Lange S, Ehler E, Gautel M. From A to Z and back? Multicompartment proteins in the sarcomere. Trends Cell Biol. 2006;16:11–18. doi: 10.1016/j.tcb.2005.11.007. - DOI - PubMed
    1. Lemke SB, Schnorrer F. Mechanical forces during muscle development. Mechanisms Dev. 2017;144:92–101. doi: 10.1016/j.mod.2016.11.003. - DOI - PubMed
    1. Geeves MA, Holmes KC. The molecular mechanism of muscle contraction. Adv. Protein Chem. 2005;71:161–193. doi: 10.1016/S0065-3233(04)71005-0. - DOI - PubMed
    1. Moyes CD. Controlling muscle mitochondrial content. J. Exp. Biol. 2003;206:4385–4391. doi: 10.1242/jeb.00699. - DOI - PubMed

Publication types

MeSH terms

LinkOut - more resources