

doi: 10.1038/s41467-021-22401-y.
VESPER: global and local cryo-EM map alignment using local density vectors
Affiliations
- PMID: 33828103
- PMCID: PMC8027200
- DOI: 10.1038/s41467-021-22401-y
Item in Clipboard
VESPER: global and local cryo-EM map alignment using local density vectors
Nat Commun.
.
Abstract
An increasing number of density maps of biological macromolecules have been determined by cryo-electron microscopy (cryo-EM) and stored in the public database, EMDB. To interpret the structural information contained in EM density maps, alignment of maps is an essential step for structure modeling, comparison of maps, and for database search. Here, we developed VESPER, which captures the similarity of underlying molecular structures embedded in density maps by taking local gradient directions into consideration. Compared to existing methods, VESPER achieved substantially more accurate global and local alignment of maps as well as database retrieval.
Conflict of interest statement
The authors declare no competing interests.
Figures
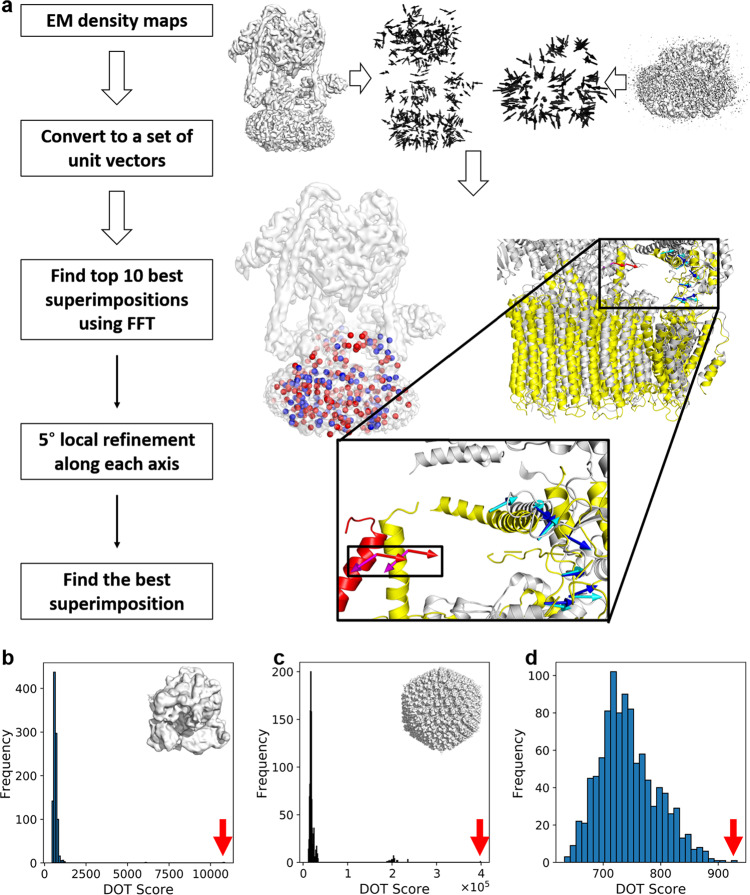
a The flowchart of VESPER. Steps of VESPER are illustrated in the right panel with an example of a map alignment between the complete V-ATPase (EMD-8724, 6.8 Å; left) and Vo region of the V-ATPase (EMD-8409, 3.9 Å; right). First, a set of unit vectors are computed using the mean shift algorithm for each map. The number of vectors for EMD-8724 and EMD-8409 were 2441 and 678, respectively. In the figure, vectors were thinned out for better presentation. Next, the two maps are matched using FFT to maximize the sum of the dot products of matched vectors. Then, the top 10 scoring models undergo a local angle refinement with a 5° interval. The best scoring superimposition is shown at the bottom of the right panel. The Vo region (PDB ID: 5tj5) is colored in yellow and the complete V-ATPase (PDB ID: 5vox) is in gray. In the superimposed maps, vectors with positive and non-positive and DOT scores are colored in blue and red, respectively. The helix in the complete V-ATPase that does not match well to the Vo region is colored in red. Vectors from the Vo region are colored in blue and red, while those from the complete V-ATPase are colored in cyan and magenta. b 70S ribosome (EMD-2978, resolution: 11.6 Å) matched to itself. DOT score: 10,841; Z-score: 101.62. c human adenovirus 5 capsid (EMD-3004, resolution: 12.5 Å) matched to itself. DOT score, 398,169; Z-score: 94.31. d an alignment between human adenovirus (EMD-3004) and 70S ribosome (EMD-2978). DOT score, 943; Z-score: 3.97.
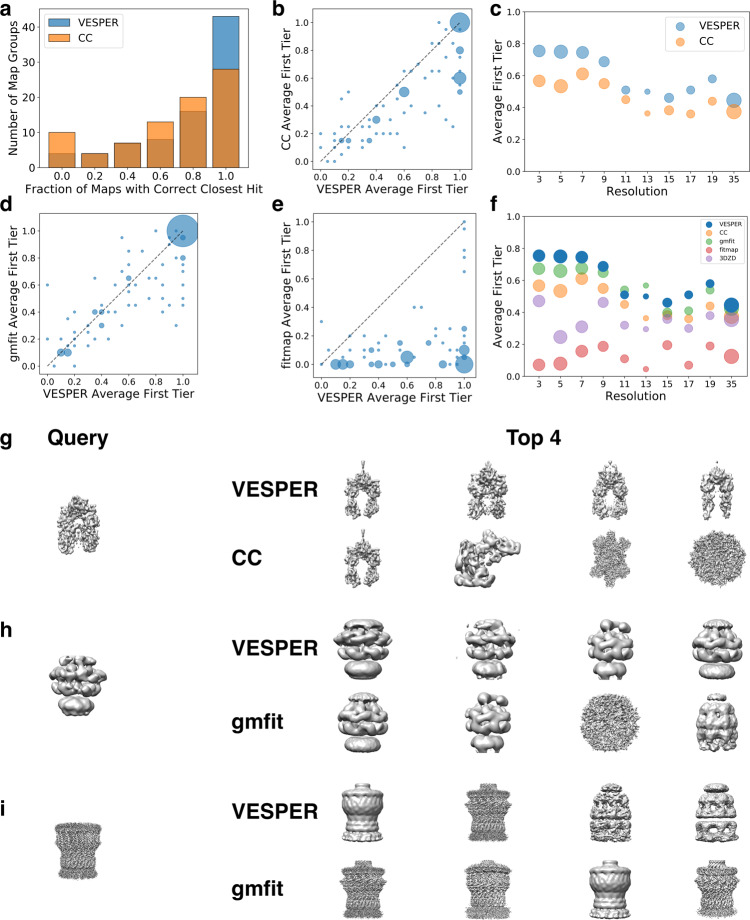
a–c comparison of VESPER with the DOT (blue) score and CC (orange). a The number of map groups classified by the fraction of member maps that retrieved a correct map as the top hit. b The first tier hit fraction for each group. The area of a data point is proportional to the number of groups. c The average fraction of correct hits within the first tier on maps at different resolutions. d Comparison between VESPER and gmfit on the first tier hit fraction. e Comparison between VESPER and fitmap on the first tier hit fraction. f The average first tier hit fraction for maps in each resolution bin by VESPER with the DOT score (blue), CC (orange), gmfit (green), fitmap (red), and EM-SURFER (3DZD; purple). The resolution of the query map was considered. g An example of a query map where the DOT score performed better than CC. The query map is PikAIII (EMD-5664). The top four retrieved maps by VESPER with the DOT score were all from PikAIII: EMD-5649, EMD-5663, EMD-5651, and EMD-5666, in this order. On the other hand, only 1 out of the top 4 retrieved maps by CC were PikAIII: EMD-5649 (PikAIII), EMD-6443 (Tetrahymena telomerase), EMD-6635 (glutamate dehydrogenase), EMD-5145 (bovine TriC), in this order. h An example of map retrieval where VESPER performed better than gmfit. The query is a map of ClpB bound to ClpP (EMD-2558). All the four maps retrieved in the first tier by VESPER were ClpB-ClpP: EMD-2557, EMD-2556, EMD-2560, EMD-2559 in this order. With gmfit, only two within the top four retrieved maps were the ClpB-ClpP: EMD-2559 (ClpB-ClpP), EMD-2560 (ClpB-ClpP), EMD-5145 (bovine TriC), EMD-2327 (GroEL-GroES). i An example of map retrieval where gmfit performed better than VESPER. The query is a 3.04 Å res. map of secretin GspD (EMD-6675). VESPER retrieved only two correct maps among the top four retrieved maps: EMD-1763 (secretin GspD), EMD-6676 (secretin GspD), EMD-2325 (GroEL-GroES), and EMD-1203 (GroEL-gp31) in this order. All four retrieved maps by gmfit were all from secretin GspD: EMD-6676, EMD-8779, EMD-1763, and EMD-6677 in this order.
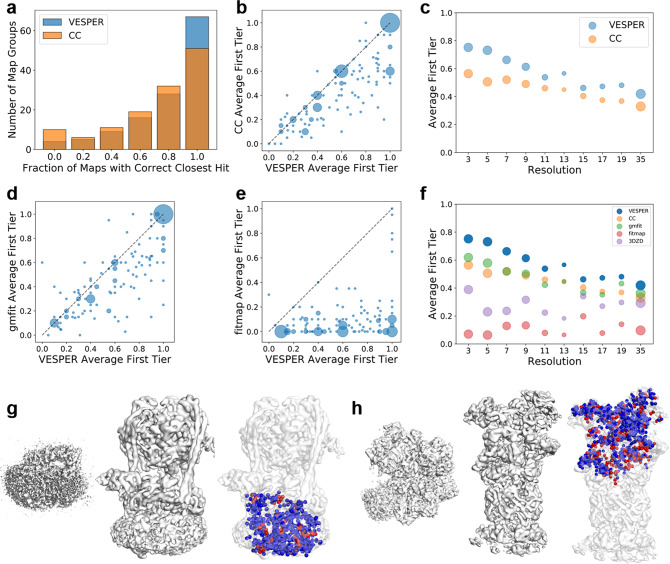
a The number of map groups with different fractions of member maps with a correct top hit. VESPER with the DOT score (blue) and CC (orange). b The average fraction of correct hits within the first tier for the 129 groups. The x-axis, VESPER with the DOT score; the y-axis, CC. The area of a point is proportional to the number of groups at that data point. c Comparison of VESPER (DOT) and CC on partial map retrieval at different resolutions. The resolution of the query map was considered. The average fraction of correct hits within the first tier was considered. d Comparison between VESPER and gmfit on the average fraction of correct hits in partial map search within the first tier for each map group. e Comparison between VESPER and fitmap on the first tier hit fraction in partial map search. f The average first tier hit fraction for maps in each resolution bin for VESPER (DOT) (blue), CC (orange), gmfit (green), fitmap (red), and EM-SURFER (3DZD; purple). The resolution of the query map was considered on the x-axis. g The Vo domain of V-ATPase (left, EMD-8409, res.: 3.9 Å) matched to the complete V-ATPase (middle, EMD-8726, res.: 7.6 Å). Colored dots in the right panel shows the dot product of matched vectors, with blue being a positive score and red for zero or a negative score. For this query, the first tier success rates of VESPER (DOT)/CC/gmfit/fitmap were 0.57/0.36/0.36/0.21, respectively. The ranks of this hit (EMD-8726) from the query by VESPER (DOT)/CC/gmfit/fitmap were 3/524/66/67 and the RMSD values of the match computed with the underlying protein subunit were 6.05/132.45/140.23/2.27 Å, respectively. h proteasome regulatory particle (left, EMD-8675, res.: 6.1 Å) matched to 26S proteasome (middle, EMD-3537, res.: 7.7 Å). The first tier success rates of VESPER (DOT)/CC/gmfit/fitmap were 0.89/0.32/0.37/0.11, respectively. The ranks of this hit (EMD-8726) from the query by VESPER (DOT)/CC/gmfit/fitmap were 1/507/184/473 and the RMSD values of the match computed with the underlying protein subunit were 11.32/111.40/138.33/131.44 Å, respectively.
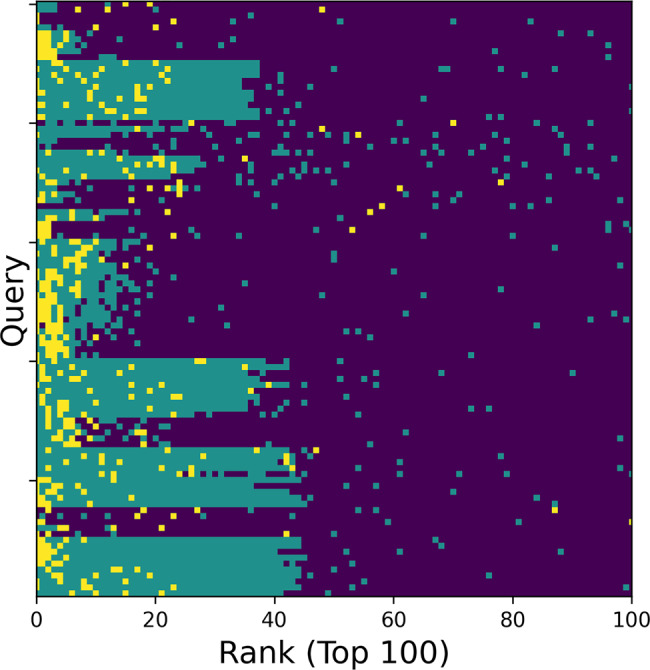
For 100 queries of partial map search that belong to a class with 10 or more members, top 100 retrieved maps were visualized in colors indicating whether the maps belong to the same group (yellow), the same class (green), or others (dark blue).
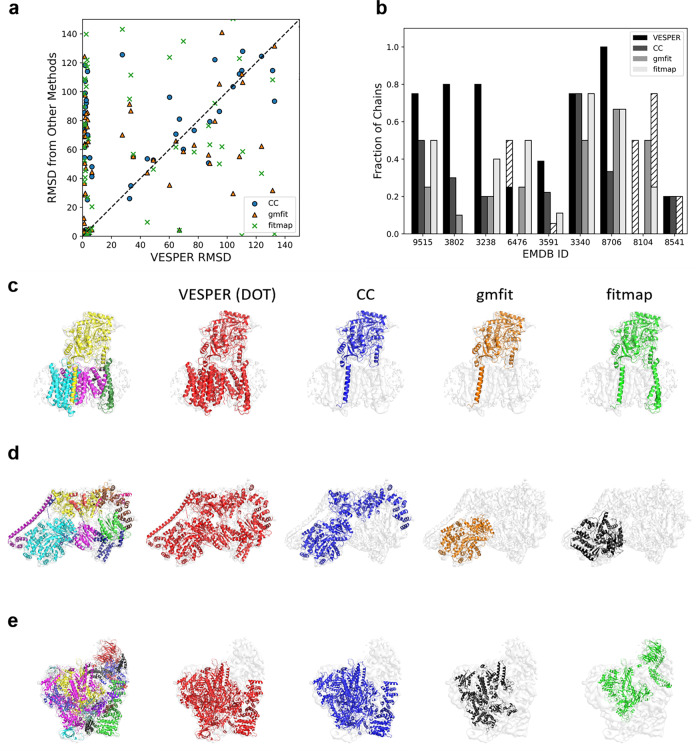
a Comparison of RMSD of the alignment with the best score by VESPER (DOT) with CC, gmfit, and fitmap. EM maps in the dataset are listed in Table 3. A voxel spacing of 3 Å and a rotation angle of 10° were used in Fig. 4. Supplementary Fig. 4 provides results for the other three parameter combinations. Blue circles, comparison against CC; orange triangles, gmfit; green crosses, fitmap, respectively. b The fraction of query chains for each map that had the top-scoring alignment with an RMSD of 5.0 Å or less (solid gray bars) and 10.0 Å or less (including hatched bars). Black bars, VESPER (DOT); dark gray, CC; medium gray, gmfit; pale gray, fitmap. c Chain structure fitting for five chains of γ-secretase (EMD-3238, PDB ID: 5fn3). The left panel shows superimposed structures of 5fn3 in the map. Each chain is in different color. From the second to the last panel from the left, chains placed within an RMSD of 5.0 Å are shown for VESPER (DOT), CC, gmfit, and fitmap, respectively. The number of chains placed within the cutoff was 4, 1, 1, and 2 chains by these methods, respectively. d Chain structure fitting of transcription factor IIH (EMD-3802, PDB ID: 5of4). There are 10 chains to fit. VESPER (DOT), CC, gmfit, and fitmap placed eight (A, B, E, F, H, X, Y, Z), three (A, B, Y), one (B), and zero chains within 5.0 Å RMSD, respectively. Chain IDs are taken from the PDB file. For fitmap, the placement of chain B, which had an RMSD of 37.7 Å is shown, since this chain had the smallest RMSD among the other chains. e fitting of 18 chains of RNA polymerase I-Rrn3-CF complex (EMD-3591, PDB ID: 5n5z). Within 5.0 Å RMSD, VESPER (DOT), CC, gmfit, and fitmap placed seven (A, B, C, E, G, H, O), four (A, B, C, O), zero, and two (B, P) chains, respectively. For gmfit, chain A that was fit at an RMSD of 9.0 Å is shown.
Similar articles
-
CryoAlign2: efficient global and local Cryo-EM map retrieval based on parallel-accelerated local spatial structural features.Bioinformatics. 2025 May 6;41(5):btaf296. doi: 10.1093/bioinformatics/btaf296. Bioinformatics. 2025. PMID: 40347456 Free PMC article.
-
Protein Structural Modeling for Electron Microscopy Maps Using VESPER and MAINMAST.Curr Protoc. 2022 Jul;2(7):e494. doi: 10.1002/cpz1.494. Curr Protoc. 2022. PMID: 35849043 Free PMC article.
-
Variability of Protein Structure Models from Electron Microscopy.Structure. 2017 Apr 4;25(4):592-602.e2. doi: 10.1016/j.str.2017.02.004. Epub 2017 Mar 2. Structure. 2017. PMID: 28262392 Free PMC article.
-
Evolution of standardization and dissemination of cryo-EM structures and data jointly by the community, PDB, and EMDB.J Biol Chem. 2021 Jan-Jun;296:100560. doi: 10.1016/j.jbc.2021.100560. Epub 2021 Mar 18. J Biol Chem. 2021. PMID: 33744287 Free PMC article. Review.
-
Deep learning for reconstructing protein structures from cryo-EM density maps: Recent advances and future directions.Curr Opin Struct Biol. 2023 Apr;79:102536. doi: 10.1016/j.sbi.2023.102536. Epub 2023 Feb 9. Curr Opin Struct Biol. 2023. PMID: 36773336 Free PMC article. Review.
Cited by
-
Real-time structure search and structure classification for AlphaFold protein models.Commun Biol. 2022 Apr 5;5(1):316. doi: 10.1038/s42003-022-03261-8. Commun Biol. 2022. PMID: 35383281 Free PMC article.
-
CryoAlign2: efficient global and local Cryo-EM map retrieval based on parallel-accelerated local spatial structural features.Bioinformatics. 2025 May 6;41(5):btaf296. doi: 10.1093/bioinformatics/btaf296. Bioinformatics. 2025. PMID: 40347456 Free PMC article.
-
Protein Structural Modeling for Electron Microscopy Maps Using VESPER and MAINMAST.Curr Protoc. 2022 Jul;2(7):e494. doi: 10.1002/cpz1.494. Curr Protoc. 2022. PMID: 35849043 Free PMC article.
-
Accurate global and local 3D alignment of cryo-EM density maps using local spatial structural features.Nat Commun. 2024 Feb 21;15(1):1593. doi: 10.1038/s41467-024-45861-4. Nat Commun. 2024. PMID: 38383438 Free PMC article.
-
DiffModeler: Large Macromolecular Structure Modeling in Low-Resolution Cryo-EM Maps Using Diffusion Model.bioRxiv [Preprint]. 2024 Feb 28:2024.01.20.576370. doi: 10.1101/2024.01.20.576370. bioRxiv. 2024. Update in: Nat Methods. 2024 Dec;21(12):2307-2317. doi: 10.1038/s41592-024-02479-0. PMID: 38328203 Free PMC article. Updated. Preprint.
References
Publication types
MeSH terms
Substances
Grants and funding
LinkOut - more resources
Full Text Sources
Other Literature Sources
