. 2021 Apr 7;11(1):7635.
doi: 10.1038/s41598-021-86920-w.

Extracellular vesicles isolated from milk can improve gut barrier dysfunction induced by malnutrition

Affiliations

Extracellular vesicles isolated from milk can improve gut barrier dysfunction induced by malnutrition

Mohamed Karim Maghraby et al. Sci Rep. .

Abstract

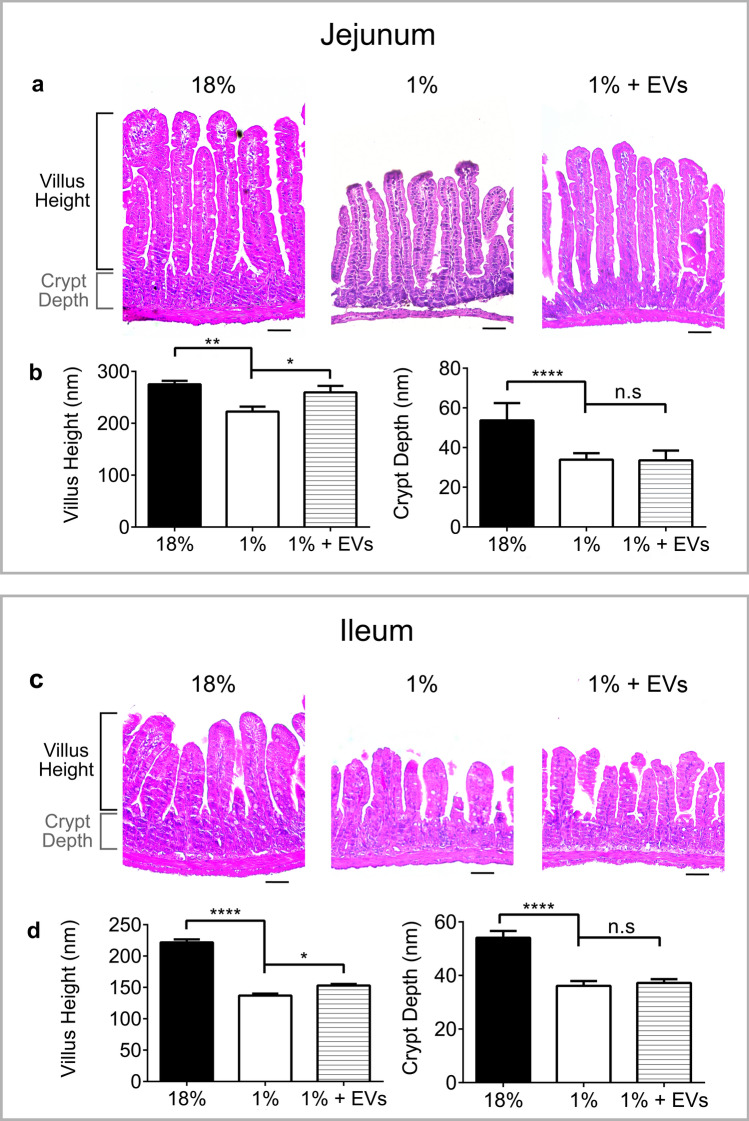
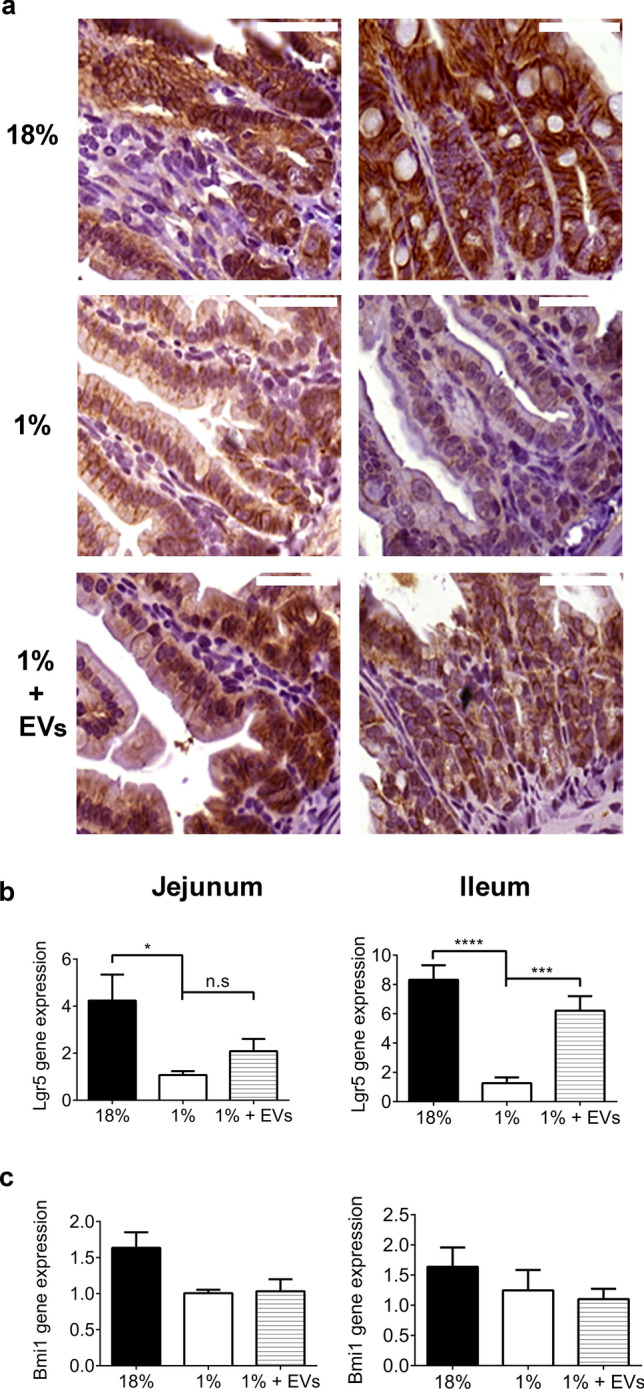
Malnutrition impacts approximately 50 million children worldwide and is linked to 45% of global mortality in children below the age of five. Severe acute malnutrition (SAM) is associated with intestinal barrier breakdown and epithelial atrophy. Extracellular vesicles including exosomes (EVs; 30-150 nm) can travel to distant target cells through biofluids including milk. Since milk-derived EVs are known to induce intestinal stem cell proliferation, this study aimed to examine their potential efficacy in improving malnutrition-induced atrophy of intestinal mucosa and barrier dysfunction. Mice were fed either a control (18%) or a low protein (1%) diet for 14 days to induce malnutrition. From day 10 to 14, they received either bovine milk EVs or control gavage and were sacrificed on day 15, 4 h after a Fluorescein Isothiocyanate (FITC) dose. Tissue and blood were collected for histological and epithelial barrier function analyses. Mice fed low protein diet developed intestinal villus atrophy and barrier dysfunction. Despite continued low protein diet feeding, milk EV treatment improved intestinal permeability, intestinal architecture and cellular proliferation. Our results suggest that EVs enriched from milk should be further explored as a valuable adjuvant therapy to standard clinical management of malnourished children with high risk of morbidity and mortality.


Conflict of interest statement

The authors declare no competing interests.

Figures

Figure 1
Figure 1
Enrichment and characterization of milk EVs. (a) Protein quantification of milk EVs enriched using (1) crude ultracentrifugation (20.48 µg/µl) and (2) ultracentrifugation with sucrose gradient purification (0.21 µg/µl). After ultracentrifugation with sucrose gradient, enriched milk EVs were pooled (n = 3) and characterised by: (b) Nanoparticle tracking analysis to demonstrate distribution of particle size and their concentration; (c) Flow cytometry to detect the milk EV-associated surface marker CD63 where the X-axis indicates fluorescence intensity linked to CD63, while the Y-axis plots fluorescence of propidium iodide relating to the presence of non-viable cells which are not expected after EV isolation procedures ; (d) Transmission electron microscopy to assess morphology, showing milk EVs at 62,000 × magnification (scale bar 500 nm) and a single milk EV at 100,000 × magnification (scale bar 200 nm);  (e) Full length immunoblots showing positive EV-membrane surface markers CD81, CD63 and CD9, and negative EV-markers calnexin and histone 3. Lanes indicated with negative symbol (−) are negative controls and positive symbol (+) indicate EV protein loading. Figures in panel a and b were generated with GraphPad Prism version 6.0.0 for Windows (www.graphpad.com); image for panel c was exported from FlowJo (www.flowjo.com).
Figure 2
Figure 2
Impact of malnutrition and milk EV treatment on body measures of mice. (a) Body weight of sham-treated mice fed 1% protein diet was significantly lower at day 14 when compared to controls i.e. sham-treated mice fed 18% protein diet (n = 7, P < 0.0001). The body weights of milk EV-treated mice fed 1% protein diet did not improve compared to sham-treated mice fed 1% protein diet (n = 7, P = 0.72). (b) The body length at day 14 of sham-treated mice fed 1% protein diet was significantly shorter than controls i.e. sham-treated mice fed 18% protein diet (n = 7, P < 0.0001); and milk EVs treatment did not impact body length (n = 7). Data are presented as mean ± standard error of mean (SEM). Significance: ***P  < 0.001, ****P  < 0.0001, n.s = not significant. Graphs and statistical tests were done using GraphPad Prism version 6.0.0 for Windows (www.graphpad.com).
Figure 3
Figure 3
Milk EVs restore villus architecture in malnourished mice. Analysis of intestinal morphology of: controls, i.e., sham-treated mice fed 18% protein diet; sham-treated mice fed 1% protein diet; and milk EV-treated mice fed 1% protein diet: (a) H&E stained sections of jejunum and associated measurements of (b) Villus height and crypt depth, n = 7/group. (c) H&E stained sections of ileum and associated measurements of (d) Villus height and crypt depth, n = 7/group. Each column represents mean ± standard error of mean (SEM). (****P < 0.0001, **P  < 0.01, *P < 0.05, n.s = not significant), scale bar 50 nm. Graphs and statistical tests were done using GraphPad Prism version 6.0.0 for Windows (www.graphpad.com).
Figure 4
Figure 4
Milk EVs improve intestinal permeability and barrier protein claudin-3. Indicators of barrier function in controls, i.e. sham treated mice fed 18% diet; sham-treated mice fed 1% protein diet; and milk EV-treated mice fed 1% protein diet as represented by: (a) Fluorescein isothiocyanate dextran (FITC) assay of intestinal permeability (n = 7/group). Each column represents mean ± standard error of mean (SEM); (b) Immunofluorescent staining for intestinal epithelial barrier protein claudin-3 (red) in the jejunum and ileum with DAPI counterstaining of nuclei in blue, n = 3/group; 40 × magnification (Scale bar, 15 µm). (c) Claudin-3 (Cldn3) mRNA expression relative to ribosomal protein L13A (Rpl13a) in the jejunum and in the ileum (n = 6/group). Each column represents mean ± standard error of mean (SEM). *** P  < 0.001, * P < 0.05, n.s = not significant. Graphs and statistical tests were done using GraphPad Prism version 6.0.0 for Windows (www.graphpad.com).
Figure 5
Figure 5
Milk EVs increase the number of proliferating Ki67 + cells in intestinal crypts in malnutrition. Number of proliferating cells in: controls i.e., sham-treated mice fed 18% protein diet; sham-treated mice fed 1% protein diet; and milk EV-treated mice fed 1% protein diet as represented by: (a) Immunofluorescent staining for proliferation marker Ki67 (red) in the jejunum and in the ileum with DAPI counterstaining of nuclei in blue; 40 × magnification (Scale bar, 25 µm) (b) Average count of Ki67 + cells per crypt in the jejunum and in the ileum. Each column represents mean ± standard error of mean (SEM) (****P < 0.0001, * P  < 0.05, n.s = not significant, n = 5/group). Graphs and statistical tests were done using GraphPad Prism version 6.0.0 for Windows (www.graphpad.com).
Figure 6
Figure 6
Milk EVs activate Wnt pathway, as seen by increased β-catenin staining, and intestinal epithelial stem cell proliferation, as seen by increased Lgr5 + cells. Stem cell activation in: controls, i.e. sham-treated mice fed 18% protein diet; sham-treated mice fed 1% protein diet; and milk EV-treated mice fed 1% protein diet, represented by: Immunohistochemistry of (a) Jejunum and ileum staining for β-catenin, 63 × magnification, n = 3/group. Scale bar, 40 µm; (b) qPCR analysis of Lgr5 expression relative to Ribosomal protein L13A (Rpl13a) in Jejunum and Ileum (****P < 0.0001, ***P < 0.001, n = 6/group). (c) qPCR analysis of Bmi1 in jejunum and ileum relative to Rpl13a (n = 6/group). Each column represents mean ± standard error of mean (SEM). Graphs and statistical tests were done using GraphPad Prism version 6.0.0 for Windows (www.graphpad.com).
Figure 7
Figure 7
Conceptual model. Framework representing a mode of action of milk EVs in the restoration of barrier dysfunction and the repair of structural injury seen in the small intestinal villi of malnourished animals. Milk EV-treatment induced repair, at least in part, through increased stem cell proliferation in intestinal crypts. This figure was in part created with BioRender and was licenced for use in publication (created with BioRender.com).

References

    1. Black RE, et al. Maternal and child undernutrition and overweight in low-income and middle-income countries. Lancet Lond. Engl. 2013;382:427–451. doi: 10.1016/S0140-6736(13)60937-X. - DOI - PubMed
    1. Irena AH, Mwambazi M, Mulenga V. Diarrhea is a major killer of children with severe acute malnutrition admitted to inpatient set-up in Lusaka Zambia. Nutr. J. 2011;10:110. doi: 10.1186/1475-2891-10-110. - DOI - PMC - PubMed
    1. World Health Organization. Updates on the management of severe acute malnutrition in infants and children. 111 (2013). - PubMed
    1. Stanfield JP, Hutt MS, Tunnicliffe R. Intestinal biopsy in kwashiorkor. Lancet Lond. Engl. 1965;2:519–523. doi: 10.1016/S0140-6736(65)91474-1. - DOI - PubMed
    1. Brewster DR, Manary MJ, Menzies IS, O’Loughlin EV, Henry RL. Intestinal permeability in kwashiorkor. Arch. Dis. Child. 1997;76:236–241. doi: 10.1136/adc.76.3.236. - DOI - PMC - PubMed

Publication types

MeSH terms

Grants and funding