

Sampling of fluid through skin with magnetohydrodynamics for noninvasive glucose monitoring
- PMID: 33828144
- PMCID: PMC8027418
- DOI: 10.1038/s41598-021-86931-7
Sampling of fluid through skin with magnetohydrodynamics for noninvasive glucose monitoring
Abstract
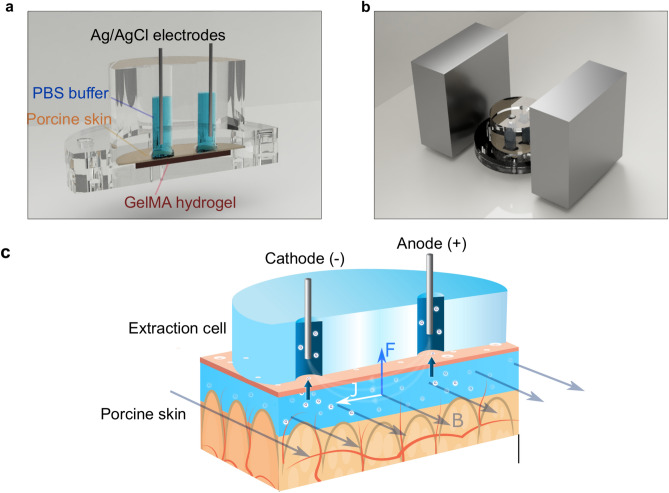
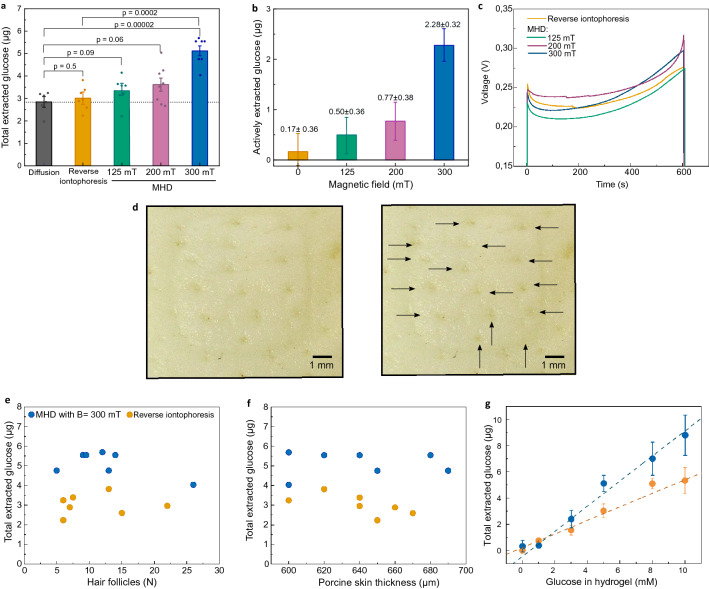
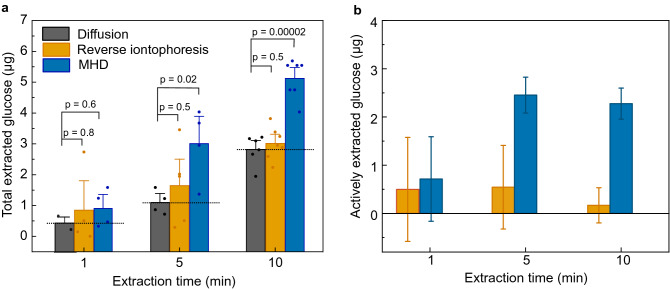
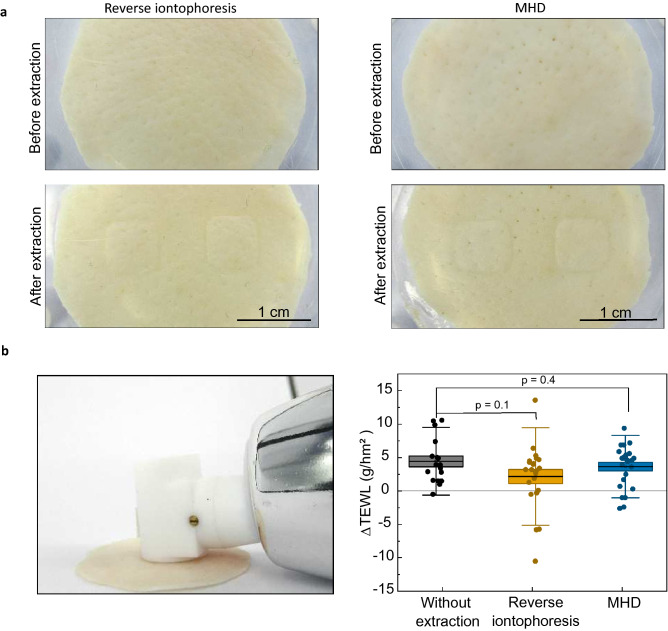
Out of 463 million people currently with diabetes, 232 million remain undiagnosed. Diabetes is a threat to human health, which could be mitigated via continuous self-monitoring of glucose. In addition to blood, interstitial fluid is considered to be a representative sample for glucose monitoring, which makes it highly attractive for wearable on-body sensing. However, new technologies are needed for efficient and noninvasive sampling of interstitial fluid through the skin. In this report, we introduce the use of Lorentz force and magnetohydrodynamics to noninvasively extract dermal interstitial fluid. Using porcine skin as an ex-vivo model, we demonstrate that the extraction rate of magnetohydrodynamics is superior to that of reverse iontophoresis. This work seeks to provide a safe, effective, and noninvasive sampling method to unlock the potential of wearable sensors in needle-free continuous glucose monitoring devices that can benefit people living with diabetes.
Conflict of interest statement
A.G.P, R.T.V., T.A.N., Z.B., E.H. and J.B. are cofounders of GlucoModicum ltd, which is developing technologies and products for needle-free health and biomarker monitoring and holds patents related to the MHD method. T.A.H., A.G.P., M.W., I.A.R., R.T.V., T.A.N., E.K. and Z.A.B. are employees of GlucoModicum ltd. J.-M.A., K. P.-F., E.H. and J.B. are scientific advisors for GlucoModicum ltd. E.H. and J.B. sits on GlucoModicum ltd board.
Figures
Similar articles
-
Non-invasive, transdermal, path-selective and specific glucose monitoring via a graphene-based platform.Nat Nanotechnol. 2018 Jun;13(6):504-511. doi: 10.1038/s41565-018-0112-4. Epub 2018 Apr 9. Nat Nanotechnol. 2018. PMID: 29632401
-
Wearable hollow microneedle sensing patches for the transdermal electrochemical monitoring of glucose.Talanta. 2022 Nov 1;249:123695. doi: 10.1016/j.talanta.2022.123695. Epub 2022 Jun 16. Talanta. 2022. PMID: 35728453
-
An integrated wearable differential microneedle array for continuous glucose monitoring in interstitial fluids.Biosens Bioelectron. 2024 Jul 15;256:116280. doi: 10.1016/j.bios.2024.116280. Epub 2024 Apr 9. Biosens Bioelectron. 2024. PMID: 38603840
-
Wearable physiological systems and technologies for metabolic monitoring.J Appl Physiol (1985). 2018 Mar 1;124(3):548-556. doi: 10.1152/japplphysiol.00407.2017. Epub 2017 Sep 28. J Appl Physiol (1985). 2018. PMID: 28970200 Review.
-
Accessing analytes in biofluids for peripheral biochemical monitoring.Nat Biotechnol. 2019 Apr;37(4):407-419. doi: 10.1038/s41587-019-0040-3. Epub 2019 Feb 25. Nat Biotechnol. 2019. PMID: 30804536 Review.
Cited by
-
Wireless wearable potentiometric sensor for simultaneous determination of pH, sodium and potassium in human sweat.Sci Rep. 2024 May 21;14(1):11526. doi: 10.1038/s41598-024-62236-3. Sci Rep. 2024. PMID: 38773136 Free PMC article.
-
Development and Characterization of Interstitial-Fluid-Mimicking Solutions for Pre-Clinical Assessment of Hypoxia.Diagnostics (Basel). 2023 Oct 4;13(19):3125. doi: 10.3390/diagnostics13193125. Diagnostics (Basel). 2023. PMID: 37835868 Free PMC article.
-
End-to-end design of wearable sensors.Nat Rev Mater. 2022;7(11):887-907. doi: 10.1038/s41578-022-00460-x. Epub 2022 Jul 22. Nat Rev Mater. 2022. PMID: 35910814 Free PMC article. Review.
-
[Research progress on minimally invasive and non-invasive blood glucose detection methods].Sheng Wu Yi Xue Gong Cheng Xue Za Zhi. 2023 Apr 25;40(2):365-372. doi: 10.7507/1001-5515.202202017. Sheng Wu Yi Xue Gong Cheng Xue Za Zhi. 2023. PMID: 37139770 Free PMC article. Chinese.
-
Pilot study in human healthy volunteers on the use of magnetohydrodynamics in needle-free continuous glucose monitoring.Sci Rep. 2022 Nov 9;12(1):18318. doi: 10.1038/s41598-022-21424-9. Sci Rep. 2022. PMID: 36351930 Free PMC article.
References
-
- IDF Atlas 9th edition (International Diabetes Foundation, Brussels, 2019). https://diabetesatlas.org/en/resources/. ISBN: 978-2-930229-87-4.
-
- Mannucci E, et al. Effects of structured versus unstructured self-monitoring of blood glucose on glucose control in patients with non-insulin-treated type 2 diabetes: A meta-analysis of randomized controlled trials. J. Diabetes Sci. Technol. 2018;12:183–189. doi: 10.1177/1932296817719290. - DOI - PMC - PubMed
Publication types
MeSH terms
Substances
LinkOut - more resources
Full Text Sources
Other Literature Sources
