. 2021 Apr 7;11(1):7665.
doi: 10.1038/s41598-021-87440-3.

En face image-based classification of diabetic macular edema using swept source optical coherence tomography

Affiliations

En face image-based classification of diabetic macular edema using swept source optical coherence tomography

Atsushi Fujiwara et al. Sci Rep. .

Abstract

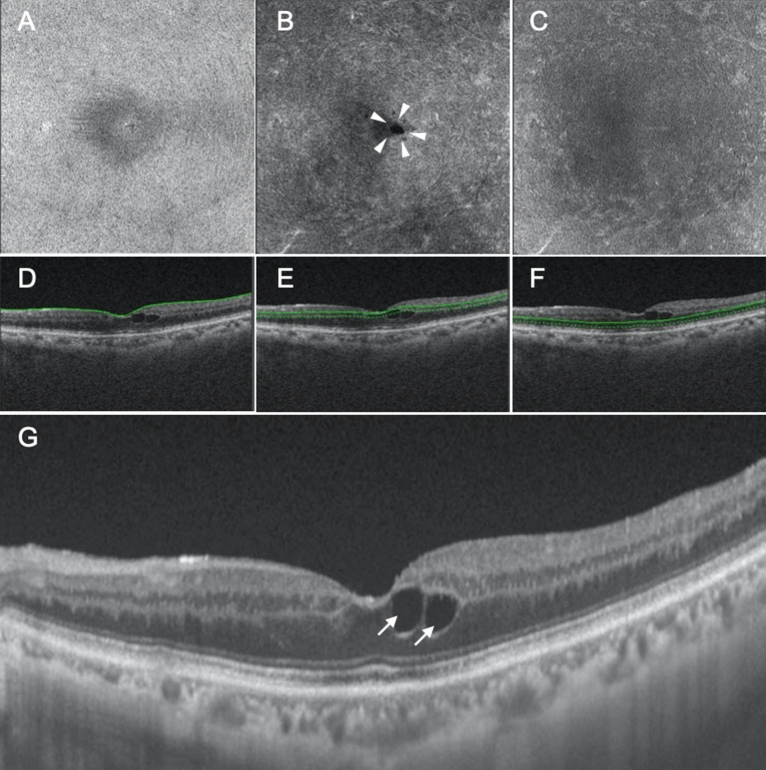
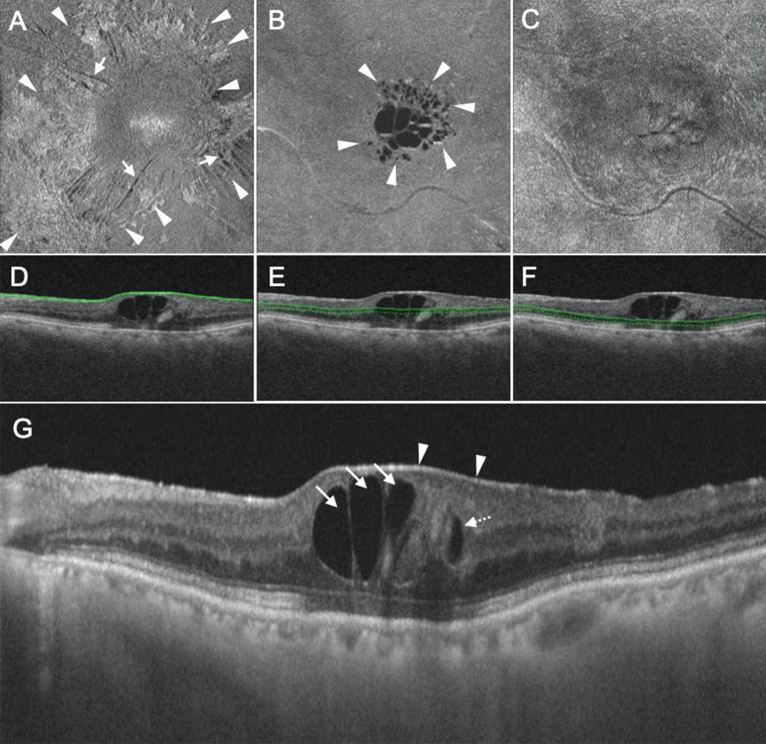
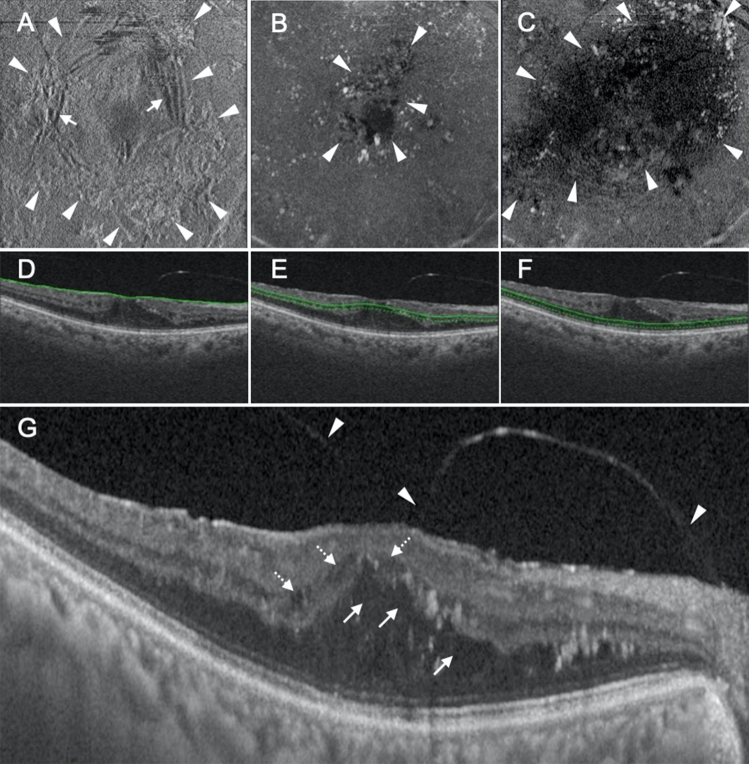
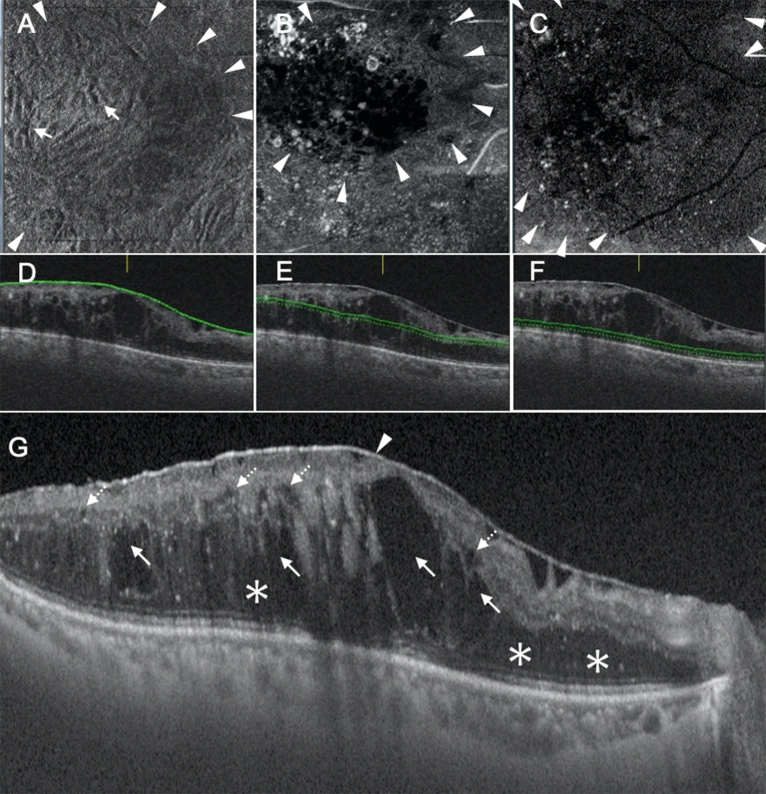
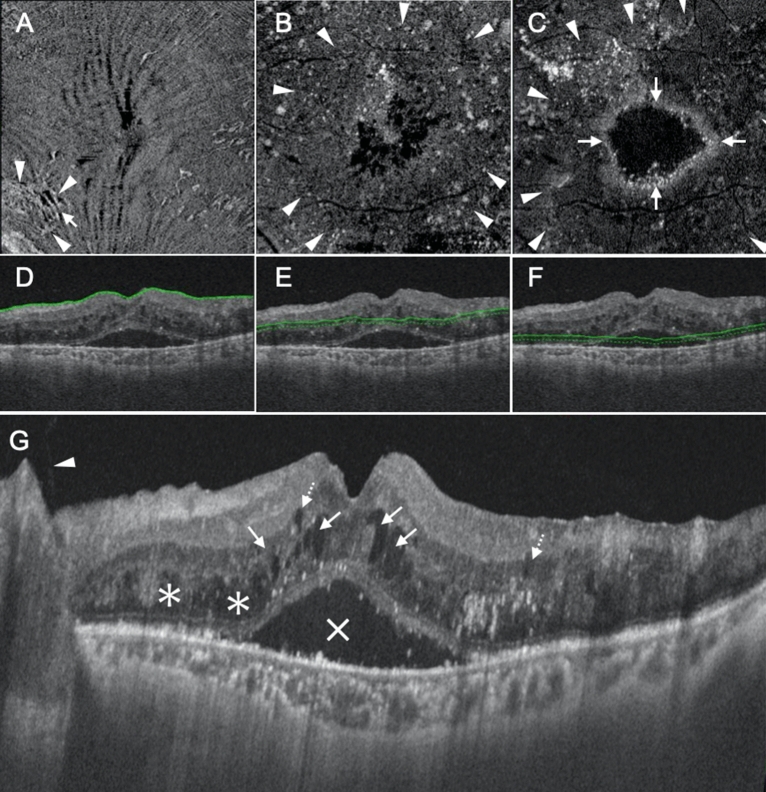
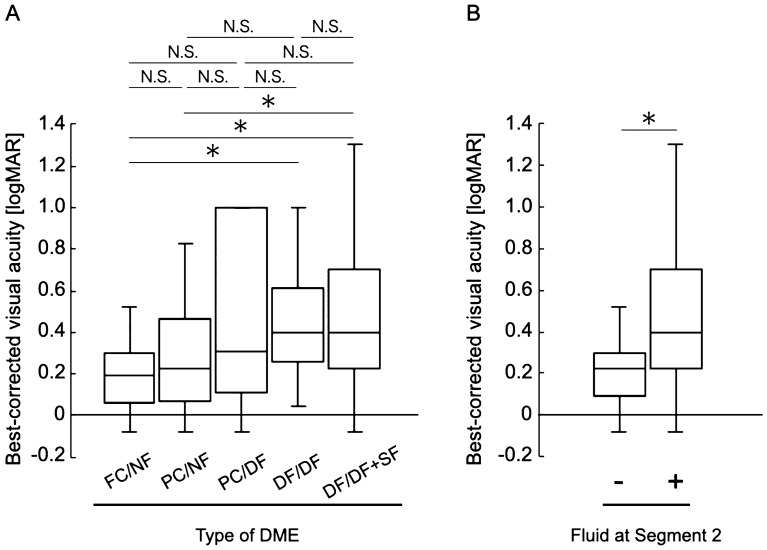
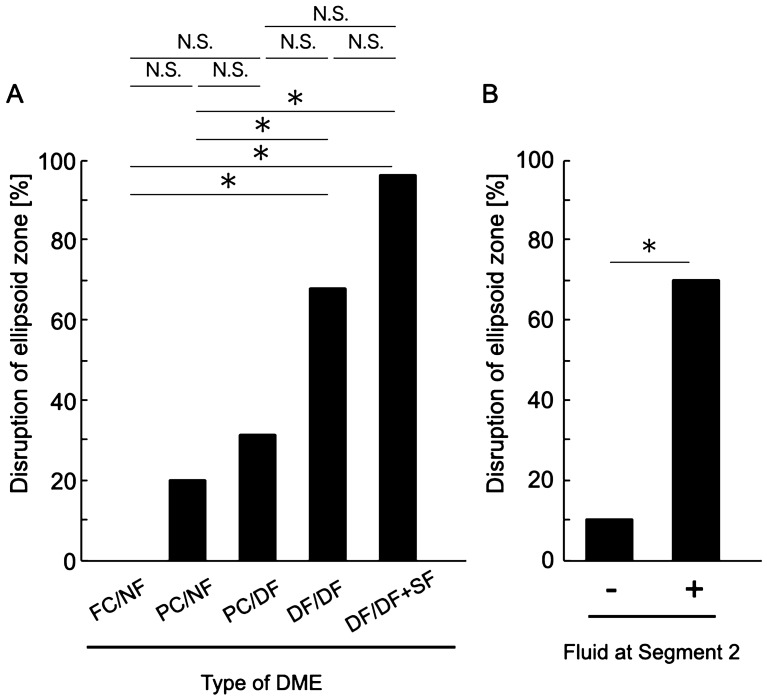
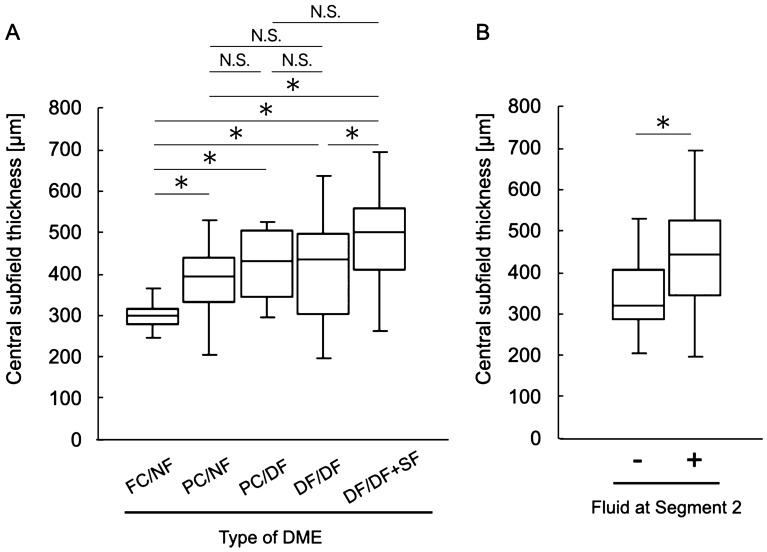
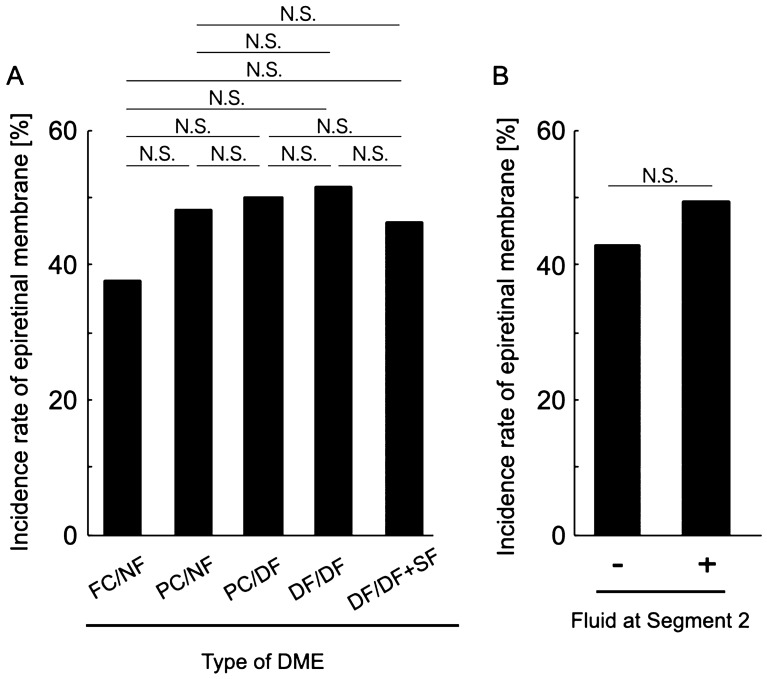
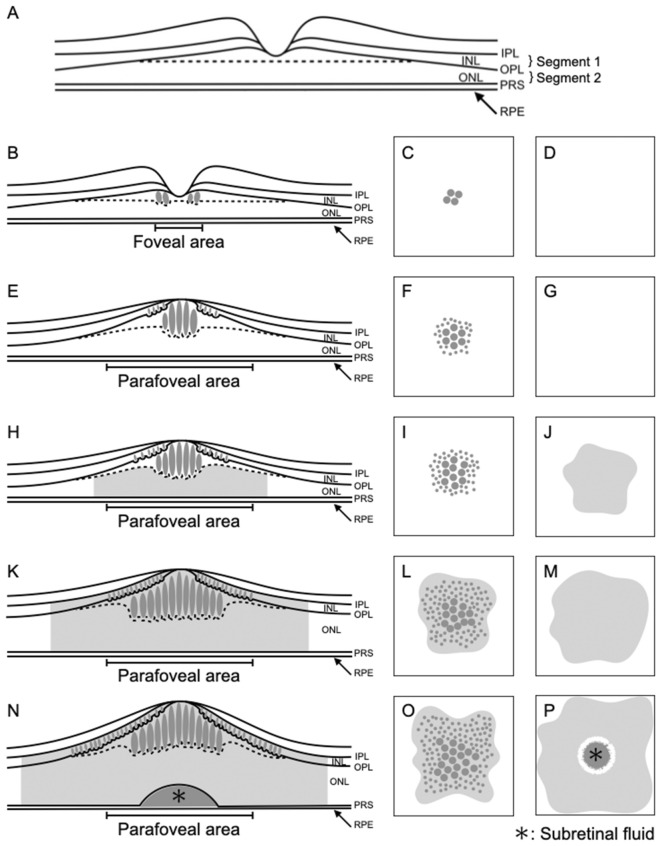
This retrospective study was performed to classify diabetic macular edema (DME) based on the localization and area of the fluid and to investigate the relationship of the classification with visual acuity (VA). The fluid was visualized using en face optical coherence tomography (OCT) images constructed using swept-source OCT. A total of 128 eyes with DME were included. The retina was segmented into: Segment 1, mainly comprising the inner nuclear layer and outer plexiform layer, including Henle's fiber layer; and Segment 2, mainly comprising the outer nuclear layer. DME was classified as: foveal cystoid space at Segment 1 and no fluid at Segment 2 (n = 24), parafoveal cystoid space at Segment 1 and no fluid at Segment 2 (n = 25), parafoveal cystoid space at Segment 1 and diffuse fluid at Segment 2 (n = 16), diffuse fluid at both segments (n = 37), and diffuse fluid at both segments with subretinal fluid (n = 26). Eyes with diffuse fluid at Segment 2 showed significantly poorer VA, higher ellipsoid zone disruption rates, and greater central subfield thickness than did those without fluid at Segment 2 (P < 0.001 for all). These results indicate the importance of the localization and area of the fluid for VA in DME.


Conflict of interest statement

The authors declare no competing interests.

Figures

Figure 1
Figure 1
Representative case showing the foveal cystoid space at Segment 1/no fluid at Segment 2 type of diabetic macular edema. (AC) En face images of the retinal surface (A), Segment 1 (B), and Segment 2 (C) are presented. The surface of the retina is smooth, and there is no epiretinal membrane (A). There are cystoid spaces at Segment 1, with fluid remaining within the fovea (arrowheads, B), whereas there is no fluid at Segment 2 (C). (DF) B-scan images and the green lines show the locations at which the en face images of the retinal surface (D), Segment 1 (E), and Segment 2 (F) were generated. The scan depth, indicated by the distance between the green line and green dotted line, was set to 0 μm for the en face image of the retinal surface (D) and 50 μm for the en face images of both Segments 1 and 2 (E,F, respectively). (G) A horizontal B-scan image centered at the fovea is presented. Foveal cystoid spaces are located at Henle’s fiber layer (arrows).
Figure 2
Figure 2
Representative case showing the parafoveal cystoid space at Segment 1/no fluid at Segment 2 type of diabetic macular edema. (AC) En face images of the retinal surface (A), Segment 1 (B), and Segment 2 (C) are presented. Epiretinal membrane (arrowheads in A) and associated retinal folds (arrows in A) can be observed at the surface of the retina (A). There are cystoid spaces at Segment 1, with fluid remaining within the parafovea (arrowheads, B). There is no fluid at Segment 2 (C). (DF) B-scan images and the green lines show the locations at which the en face images of the retinal surface (D), Segment 1 (E), and Segment 2 (F) were generated. The scan depth, indicated by the distance between the green line and green dotted line, was set to 0 μm for the en face image of the retinal surface (D) and 50 μm for the en face images of both Segments 1 and 2 (E,F, respectively). (G) A horizontal B-scan image centered at the fovea is presented. Parafoveal cystoid spaces are located at both Henle’s fiber layer (arrows) and the inner nuclear layer (dotted arrows). The arrowheads in (G) indicate the epiretinal membrane.
Figure 3
Figure 3
Representative case showing the parafoveal cystoid space at Segment 1/diffuse fluid at Segment 2 type of diabetic macular edema. (AC) En face images of the retinal surface (A), Segment 1 (B), and Segment 2 (C) are presented. Epiretinal membrane (arrowheads in A) and associated retinal folds (arrows in A) can be observed at the surface of the retina (A). There are cystoid spaces at Segment 1, with the area of fluid remaining within the parafovea (arrowheads in B). Segment 2 shows diffuse fluid (arrowheads in C). (DF) B-scan images and the green lines show the locations at which the en face images of the retinal surface (D), Segment 1 (E), and Segment 2 (F) were generated. The scan depth, indicated by the distance between the green line and green dotted line, was set to 0 μm for the en face image of the retinal surface (D) and 50 μm for the en face images of both Segments 1 and 2 (E,F, respectively). (G) A horizontal B-scan image centered at the fovea is presented. There are parafoveal cystoid spaces at both Henle’s fiber layer (arrows in G) and the inner nuclear layer (dotted arrows in G). The fluid at Segment 2 observed on the en face image is not clearly visualized on this cross-sectional image. The arrowheads in (G) show incomplete posterior vitreous detachment.
Figure 4
Figure 4
Representative case showing the diffuse fluid at Segment 1/diffuse fluid at Segment 2 type of diabetic macular edema. (AC) En face images of the retinal surface (A), Segment 1 (B), and Segment 2 (C) are presented. Epiretinal membrane (ERM; arrowheads in A) and associated retinal folds (arrows in A) can be observed at the surface of the retina (A). There is diffuse fluid with an area larger than the parafoveal area at both Segments 1 and 2 (arrowheads in B,C). (DF) B-scan images and the green lines show the locations at which the en face images of the retinal surface (D), Segment 1 (E), and Segment 2 (F) were generated. The scan depth, indicated by the distance between the green line and green dotted line, was set to 0 μm for the en face image of the retinal surface (D) and 50 μm for the en face images of both Segments 1 and 2 (E,F, respectively). (G) A horizontal B-scan image centered at the fovea is presented. The fluid at Segment 1 is located at both Henle’s fiber layer (arrows in G) and the inner nuclear layer (dotted arrows in G). There is diffuse fluid at Segment 2 (asterisks in G). The arrowhead in (G) shows ERM.
Figure 5
Figure 5
Representative case showing the diffuse fluid at Segment 1/diffuse fluid with subretinal fluid at Segment 2 type of diabetic macular edema. (AC) En face images of the retinal surface (A), Segment 1 (B), and Segment 2 (C) are presented. Epiretinal membrane (arrowheads in A) and associated retinal folds (arrows in A) can be observed at the surface of the retina. There is diffuse fluid with an area larger than the parafoveal area at both Segments 1 and 2 (arrowheads in B,C). Subretinal fluid, visualized as a high-intensity ring-shaped region, can also be observed at Segment 2 (arrows in C). (DF) B-scan images and the green lines show the locations at which the en face images of the retinal surface (D), Segment 1 (E), and Segment 2 (F) were generated. The scan depth, indicated by the distance between the green line and green dotted line, was set to 0 μm for the en face image of the retinal surface (D) and 50 μm for the en face images of both Segments 1 and 2 (E,F, respectively). (G) A horizontal B-scan image centered at the fovea is presented. The fluid at Segment 1 is located at both Henle’s fiber layer (arrows in G) and the inner nuclear layer (dotted arrows in G). There is diffuse fluid at Segment 2 (asterisks in G). The X in (G) indicates subretinal fluid and the arrowhead in (G) shows that the posterior hyaloid is detached from the retina completely but remains attached to the optic disc.
Figure 6
Figure 6
Relationship between visual acuity and the en face image-based classification of diabetic macular edema (DME). (A) Best-corrected visual acuity values are compared among the DME types. (B) Best-corrected visual acuity values are compared according to the presence or absence of fluid at Segment 2. DME diabetic macular edema, logMAR logarithm of the minimal angle of resolution, FC/NF foveal cystoid space/no fluid type, PC/NF parafoveal cystoid space/no fluid type, PC/DF parafoveal cystoid space/diffuse fluid type, DF/DF diffuse fluid/diffuse fluid type, DF/DF + SF diffuse fluid/diffuse fluid with subretinal fluid type, N.S. not significant; *P < 0.001.
Figure 7
Figure 7
Relationship between ellipsoid zone (EZ) disruption and the en face image-based classification of diabetic macular edema (DME). (A) EZ disruption rates are compared among the DME types. (B) EZ disruption rates are compared according to the presence or absence of fluid at Segment 2. DME diabetic macular edema, FC/NF foveal cystoid space/no fluid type, PC/NF parafoveal cystoid space/no fluid type, PC/DF parafoveal cystoid space/diffuse fluid type, DF/DF diffuse fluid/diffuse fluid type, DF/DF + SF diffuse fluid/diffuse fluid with subretinal fluid type, N.S. not significant, *P < 0.001.
Figure 8
Figure 8
Relationship between the central subfield thickness (CST) and the en face image-based classification of diabetic macular edema (DME). (A) CST values are compared among the DME types. (B) CST values compared according to the presence or absence of fluid at Segment 2. DME diabetic macular edema, FC/NF foveal cystoid space/no fluid type, PC/NF parafoveal cystoid space/no fluid type, PC/DF parafoveal cystoid space/diffuse fluid type, DF/DF diffuse fluid/diffuse fluid type, DF/DF + SF diffuse fluid/diffuse fluid with subretinal fluid type, N.S. not significant, *P < 0.001.
Figure 9
Figure 9
Relationship between the incidence of epiretinal membrane (ERM) and the en face image-based classification of diabetic macular edema (DME). (A) The incidence of ERM is compared among the DME types. (B) The incidence of ERM is compared according to the presence or absence of fluid at Segment 2. DME diabetic macular edema, FC/NF foveal cystoid space/no fluid type, PC/NF parafoveal cystoid space/no fluid type, PC/DF parafoveal cystoid space/diffuse fluid type, DF/DF diffuse fluid/diffuse fluid type, DF/DF + SF diffuse fluid/diffuse fluid with subretinal fluid type, N.S. not significant.
Figure 10
Figure 10
Schematic illustration of the en face image-based classification of diabetic macular edema (DME). (A,B,E,H,K,N) The illustrations indicate the cross-section of the retina. The dotted line indicates the inferior border of Henle’s fiber layer. (C,F,I,L,O) The illustrations indicate the en face image of Segment 1. (D,G,J,M,P) The illustrations indicate the en face image of Segment 2. (A) This illustration indicates the locations of Segments 1 and 2 in the normal retina. Segment 1 mainly comprises the inner nuclear layer (INL) and outer plexiform layer, including Henle’s fiber layer. Segment 2 mainly comprises the outer nuclear layer. (BD) This is the foveal cystoid space/no fluid type. In Segment 1, foveal cystoid spaces can be observed at Henle’s fiber layer (B,C). There is no fluid at Segment 2 (B,D). (EG) This is the parafoveal cystoid space/no fluid type. In Segment 1, parafoveal cystoid spaces can be observed at both Henle’s fiber layer and INL (E and F). There is no fluid at Segment 2 (E,G). (HJ) This is the parafoveal cystoid space/diffuse fluid type. In Segment 1, parafoveal cystoid spaces can be observed at both Henle’s fiber layer and INL (H and I). Diffuse fluid can be observed at Segment 2 (H,J). (KM) This is the diffuse fluid/diffuse fluid type. Diffuse fluid can be observed at both Segments 1 (K,L) and 2 (K,M). (NP) This is the diffuse fluid/diffuse fluid with subretinal fluid type. In addition to diffuse fluid at both Segments 1 (N,O) and 2 (N,P), the fluid has accumulated in the subretinal space (asterisks in N,P). IPL inner plexiform layer, INL inner nuclear layer, OPL outer plexiform layer, ONL outer nuclear layer, PRS photoreceptor segments, RPE retinal pigment epithelium.

Similar articles

Cited by

References

    1. Bhagat N, Grigorian RA, Tutela A, Zarbin MA. Diabetic macular edema: pathogenesis and treatment. Surv. Ophthalmol. 2009;54:1–32. doi: 10.1016/j.survophthal.2008.10.001. - DOI - PubMed
    1. Lee R, Wong TY, Sabanayagam C. Epidemiology of diabetic retinopathy, diabetic macular edema and related vision loss. Eye Vis (Lond.) 2015;2:17. doi: 10.1186/s40662-015-0026-2. - DOI - PMC - PubMed
    1. Chung YR, et al. Role of inflammation in classification of diabetic macular edema by optical coherence tomography. J. Diabetes Res. 2019;2019:8164250. doi: 10.1155/2019/8164250. - DOI - PMC - PubMed
    1. Grading diabetic retinopathy from stereoscopic color fundus photographs—an extension of the modified Airlie House classification. ETDRS report number 10. Early treatment diabetic retinopathy study research group. Ophthalmology98, 786–806 (1991). - PubMed
    1. Karst SG, et al. Detailed analysis of retinal morphology in patients with diabetic macular edema (DME) randomized to ranibizumab or triamcinolone treatment. Graefes Arch. Clin. Exp. Ophthalmol. 2018;256:49–58. doi: 10.1007/s00417-017-3828-1. - DOI - PMC - PubMed