. 2021 Apr;592(7856):768-772.
doi: 10.1038/s41586-021-03425-2. Epub 2021 Apr 7.

A biosensor for the direct visualization of auxin

Affiliations

A biosensor for the direct visualization of auxin

Ole Herud-Sikimić et al. Nature. 2021 Apr.

Abstract

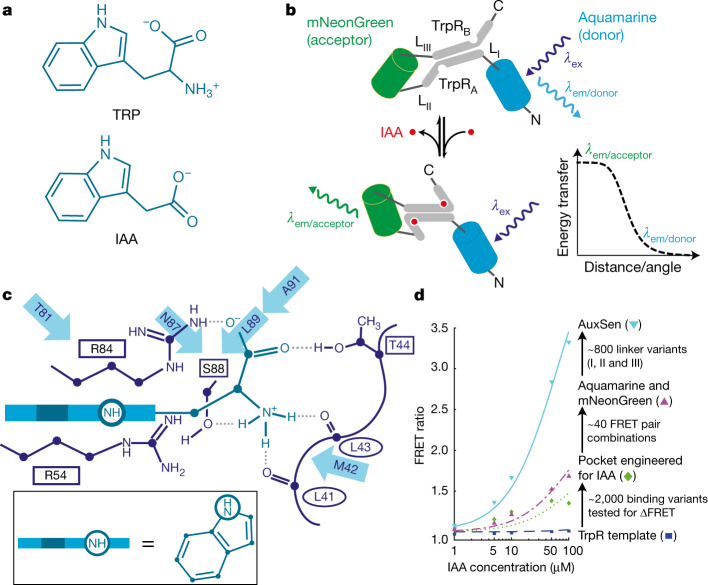
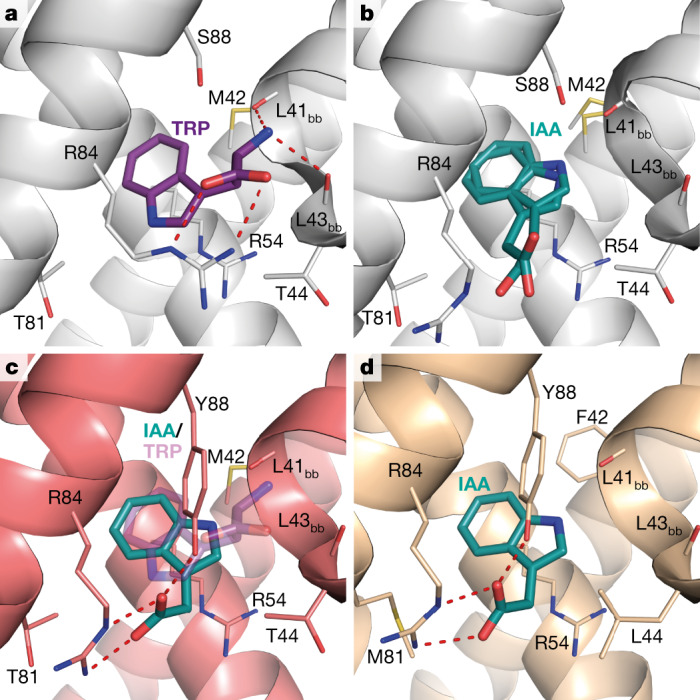
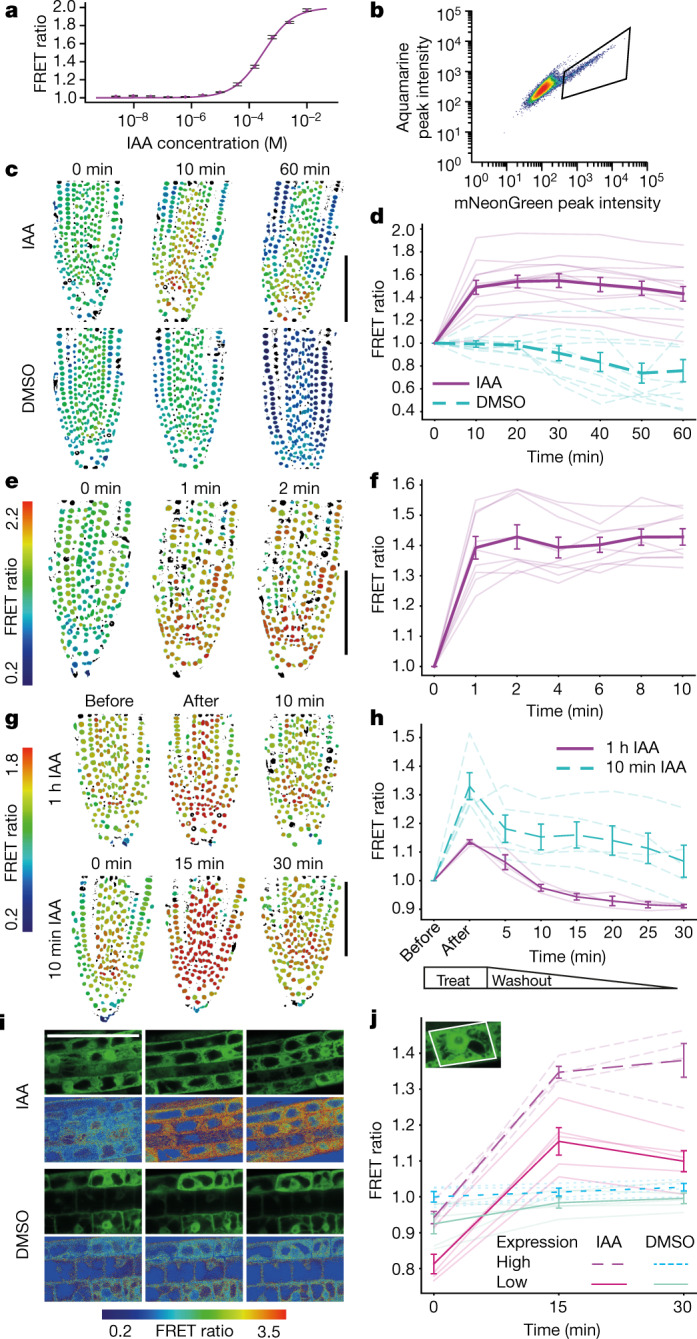
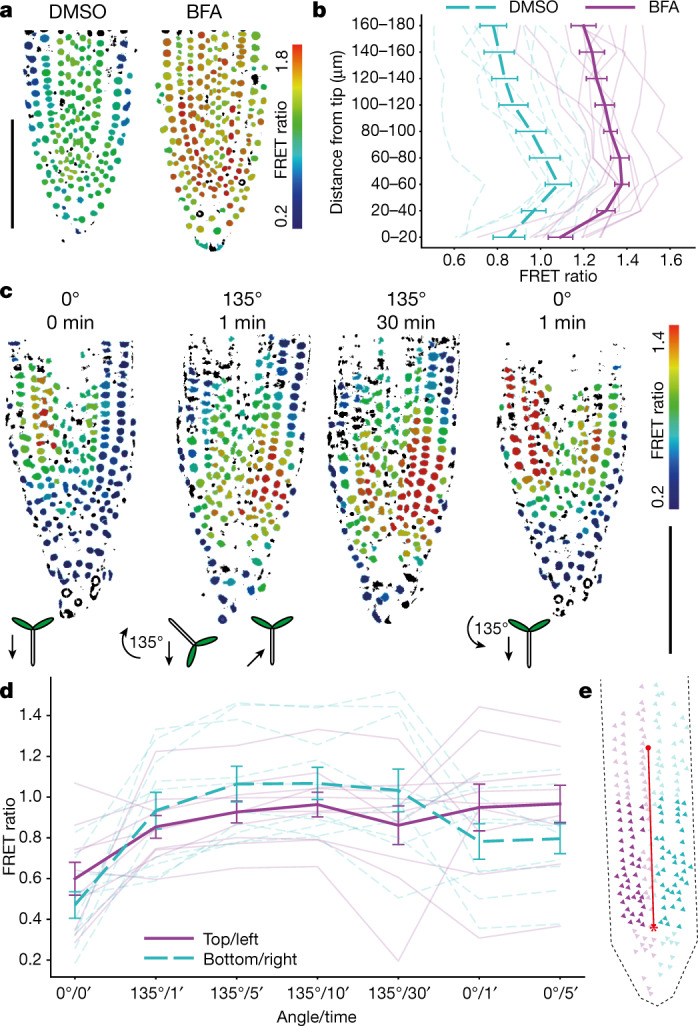
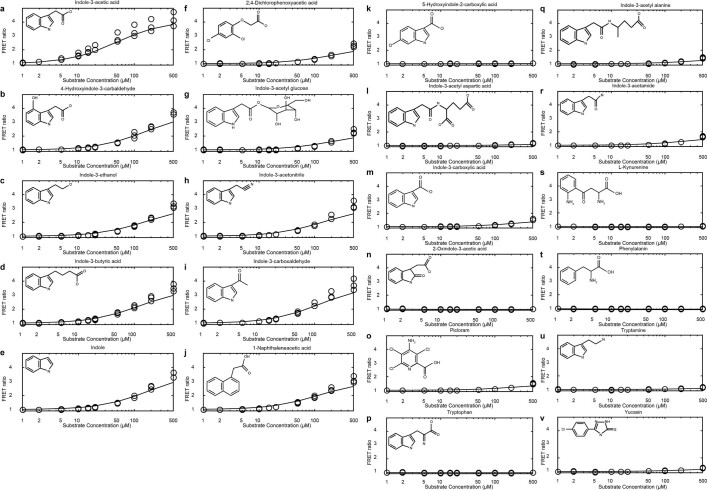
One of the most important regulatory small molecules in plants is indole-3-acetic acid, also known as auxin. Its dynamic redistribution has an essential role in almost every aspect of plant life, ranging from cell shape and division to organogenesis and responses to light and gravity1,2. So far, it has not been possible to directly determine the spatial and temporal distribution of auxin at a cellular resolution. Instead it is inferred from the visualization of irreversible processes that involve the endogenous auxin-response machinery3-7; however, such a system cannot detect transient changes. Here we report a genetically encoded biosensor for the quantitative in vivo visualization of auxin distribution. The sensor is based on the Escherichia coli tryptophan repressor8, the binding pocket of which is engineered to be specific to auxin. Coupling of the auxin-binding moiety with selected fluorescent proteins enables the use of a fluorescence resonance energy transfer signal as a readout. Unlike previous systems, this sensor enables direct monitoring of the rapid uptake and clearance of auxin by individual cells and within cell compartments in planta. By responding to the graded spatial distribution along the root axis and its perturbation by transport inhibitors-as well as the rapid and reversible redistribution of endogenous auxin in response to changes in gravity vectors-our sensor enables real-time monitoring of auxin concentrations at a (sub)cellular resolution and their spatial and temporal changes during the lifespan of a plant.


Conflict of interest statement

The authors declare no competing interests.

Figures

Fig. 1
Fig. 1. Summary of the design process.
a, Chemical structures of TRP and IAA. b, Principle of the sensor design. Only in the presence of IAA (red) are the fluorophores (mNeonGreen and Aquamarine) sufficiently close and in the correct orientation for energy transfer (EFRET). N and C represent the N and C termini of the proteins, respectively; L represents the linker; and λex and λem represent the excitation and emission wavelengths, respectively. c, Structure of the binding pocket of TrpR with ligand in side view (boxed) (modified from ref. ). Interactions with the side chains of R84, S88 and T44 (second TrpR chain) as well as the backbone carbonyl groups of L41 and L43 (second TrpR chain) are shown explicitly. Further residues that were mutated in this study are indicated with arrows. d, Major steps in the design of the sensor (AuxSen), and their cumulative contribution to the change in FRET ratio (ΔFRET) plotted against IAA concentration . Template sensor construct, TrpR–eCFP–Venus (blue squares); engineered binding pocket for IAA, TrpR(M42F/T44L/T81M/N87G/S88Y)–eCFP–Venus (green diamonds); optimized fluorophore combination, TrpR(M42F/T44L/T81M/N87G/S88Y)–mNeonGreen–Aquamarine (purple triangles); AuxSen, TrpR(M42F/T44L/T81M/N87G/S88Y)–mNeonGreen–Aquamarine with optimised linkers I, II and III (light blue inverted triangles).
Fig. 2
Fig. 2. Structure of AuxSen and critical steps in the engineering process.
a, b, Structure of TrpR bound to the native ligand TRP (purple, Protein Data Bank (PDB) ID: 1ZT9) (a) and to the design-target IAA (green) (b). IAA is rotated by 180° in the binding pocket compared with TRP. Owing to a lack of stabilization when binding to TrpR, IAA shows conformational freedom; two alternative conformations are shown. c, The mutation S88Y sterically precludes the positioning of TRP (transparent purple) in the binding site while favouring the binding of IAA. d, Structure of the final AuxSen variant (TrpR(M42F/T44L/T81M/N87G/S88Y)) bound to IAA. The ligand is firmly packed in the enhanced hydrophobic pocket of TrpR and is anchored to R84 as well as Y88, resulting in a high affinity of AuxSen for IAA. All structures are superimposed on the Cα of residues 20–60 of both chains. Red dashed lines show polar interactions between ligand and side-chain atoms. The subscript ‘bb’ labels residues that have interactions of backbone atoms with the ligand.
Fig. 3
Fig. 3. FRET ratio of AuxSen in response to auxin treatment.
a, b, The FRET ratio obtained by flow cytometry in Arabidopsis protoplasts. a, Dose–response curve, normalized to the minimum FRET ratio (mean ± s.e.m.; n = 3 biologically independent samples). b, Baseline fluorescence intensity (‘Log_Height’ (a.u.)) without exogenous IAA; the relevant area is boxed (Extended Data Figs. 6,7). cf, Changes in the FRET ratio (colour bar) in root nuclei incubated in 10 μM IAA recorded for 1 h (c, d) or for 10 min (e, f). c, e, Images (DMSO, control). Scale bar, 100 μm. d, f, Quantitative analyses. The thick lines represent the mean (±s.e.m.), and the thin lines each represent independent single-seedling measurements (n = 14 (experimental), n = 10 (control) in d, n = 9 in f). g, h, Changes in the FRET ratio (colour bar) in root nuclei following the washout of IAA. g, Images obtained after incubation with 10 μM IAA for 1 h (top) or 10 min (bottom). Images were taken before or immediately after IAA treatment, or 10 min after the end of IAA treatment. Scale bar, 100 μm. h, Quantitative analysis. The thick lines represent the mean (±s.e.m.), and the thin lines each represent independent single-seedling measurements (n = 5 (10 min), n = 3 (1 h)). i, j, Change in the FRET ratio of ER-localized AuxSen in response to 100 μM IAA. i, Expression of ER-localized AuxSen (green; first and third rows) and FRET ratio (colour bar; second and fourth rows) of root tissue treated with IAA (top two rows) or DMSO (bottom two rows; control). Scale bar, 50 μm. j, Quantitative analysis of cells with high (broken lines; IAA, n = 4; DMSO, n = 4) or low (solid lines; IAA, n = 5; DMSO, n = 5) levels of AuxSen accumulation. The thick lines represent the mean (±s.d.), the thin lines each represent individual cells. Inset, AuxSen expression in the ER.
Fig. 4
Fig. 4. FRET ratio of auxin sensor in response to redistribution of endogenous auxin.
a, b, Change in the nuclear FRET ratio (colour bar) within the root tip of individual seedlings treated with brefeldin A (BFA) or DMSO. a, Images. b, Quantitative analysis after treatment with BFA (10 μM for 10 h, magenta; n = 10) or DMSO (control, green; n = 9). The thick lines represent the mean (±s.e.m.), the thin lines each represent individual seedlings. c, d, The response of AuxSen to root gravitropism. c, Top, nuclear FRET ratio (colour bar) before and after turning (first and second images), and before and after turning back to the near-vertical position (third and fourth images). Bottom, Cartoons of the seedlings, with arrows indicating the direction of the gravity vector. The signal moves from the left side to the bottom and back to the left side; the colour scale indicates the relative FRET ratio. d, Quantified response of the sensor in individual roots. The thick lines represent the mean (±s.e.m.), the thin lines each represent individual roots (n = 10). Scale bars, 100 μm (a, c). e, Diagram of root tip. Nuclei within 100 μm above the quiescent centre (asterisk) and at least 10 μm from the midline (red line) were analysed (dark triangles). Green, right/bottom; magenta, left/top.
Extended Data Fig. 1
Extended Data Fig. 1. FRET response of several binding-domain variants to increasing substrate concentration.
a, Wild-type TrpR. bq, Engineered TrpR variants. Each mark indicates a single measurement. Circle, IAA; rhombus, TRP; square, IAN.
Extended Data Fig. 2
Extended Data Fig. 2. Details observed in the crystal structures.
a, Structure of IAA in the binding pocket of TrpR(M42F/T44L/T81I/S88Y). b, Structure of IAN bound to the same variant as in a. c, Overlay of IAA in TrpR(T44L/T81M/S88Y) (magenta) and TrpR(T44L/T81M/N87G/S88Y) (green). d, Structural overview of variants TrpR(T44L/T81M/N87G/S88Y) (green), TrpR(T44L/T81M/S88Y) (magenta), and TrpR(M42F/T44L/T81M/N87G/S88Y) (AuxSen, gold). It is apparent that AuxSen differs from the two intermediate structures regarding the overall arrangement of the helices. eg, The structure of TrpR(S88Y/T44L) and all variant structures based on it show a slight relocation of the backbone of residues 70–90. This is probably due to the fact that all structures based on this variant crystallize in the orthorhombic space group P212121 (f) as opposed to the tetragonal space group P43 found for TrpR–IAA and TrpR(S88Y)–IAA (e). Both geometries have been found in earlier crystal structures of TrpR, for example PDB 1ZT9 (tetragonal) and 2OZ9 (orthorhombic). It seems that the introduction of the T44L mutation strongly favours crystallization in the orthorhombic geometry. In the P212121 space group, crystals form more extensive crystal contacts. The structure overlay (g) shows how several residues are displaced (residues that have symmetry mates within 3 Å are shown in red, and the ligand IAA is shown in green). However, interactions and positioning of the ligands are maintained. Nonetheless, we only compare backbone coordinates between variants of the same space group, to exclude misinterpretations due to crystal contacts.
Extended Data Fig. 3
Extended Data Fig. 3. Parameters tested for potential influence on the change of FRET ratio.
a, Change in FRET ratio upon IAA treatment plotted against the dissociation constant (Kd) of the same variant as determined by ITC. b, FRET ratio changes do not correlate with the Förster distance. Blue–yellow pairs are marked in green, yellow–red pairs are in orange. Blue–yellow pairs, in general, show a higher FRET ratio change upon IAA treatment, but a similar range of Förster distances as the yellow–red ones. c, FRET ratio changes (in per cent) of several variants tested with two different fluorophore pairs. Variants showing a strong response with one fluorophore pair usually also show a strong response with another pair (correlation coefficient = 0.6). dj, Effects of mutations in linkers. d, Structure of the construct. The IAA-binding TrpR variants were cloned as tandem repeats into the construct containing donor and acceptor fluorophores, analogous to ref. . The positional effect of the fluorescent proteins probably stems from slight rearrangements of the overall backbone in both TrpR subunits. Predominantly, this involves helix E of the reading-head motif, which mediates the DNA interaction in the natural function of TrpR. Because helix E is towards the C-terminal end of the chain, is it thought that fluorescent proteins positioned at this end will experience a larger positional relocation and thus show a more dynamic range of the FRET signal. eg, First-round linker mutations. All three linkers were mutated, but no pattern for the optimal linker length could be determined. One linker II variant was chosen for further mutations. h, i, Second-round linker mutations. Linkers I and III were mutated in the variant obtained in the first round, with no changes in the optimized linker II. j, Third-round linker mutations. Linker I was further mutated in the variant containing mutations in linkers II and III. The linker length axis indicates the number of amino acid residues.
Extended Data Fig. 4
Extended Data Fig. 4. pH, salt and redox sensitivity of AuxSen.
a, The FRET ratio is slightly affected by changes in the pH, but fully functional in the range of pH values within the plant cell. Red, pH 6.0; blue, pH 6.5; green, pH 7.0; violet, pH 7.5; cyan, pH 8.0. b, The FRET ratio is not strongly affected by salts and changes in the redox potential. Black, control; red, 1 mM (NH4)2SO4; blue, 1 mM CaCl2; green, 10 mM NH4NO3; violet, 10 mM DTT; cyan, 10 mM H2O2; yellow, 10 mM KCl; orange squares, 10 mM KNO3; orange diamonds, 10 mM NaCl. c, ITC data of AuxSen binding to IAA, measured at different pH values. Data are mean ± s.d., derived from 3 technical replicates.
Extended Data Fig. 5
Extended Data Fig. 5. Affinities of AuxSen for auxin-related compounds.
aj, Compounds with weak affinities; kv, compounds with no affinity. The change in FRET ratio (y axis) is plotted against increasing concentrations of the individual compounds in μM (x axis). Each mark indicates a single measurement.
Extended Data Fig. 6
Extended Data Fig. 6. FRET ratio of AuxSen quantified in protoplasts.
Cell-suspension-culture protoplasts were transfected with pJIT60-2xp35SS:NLS:AuxSen and the FRET response was captured by flow cytometry as the ratio of the emission between the Aquamarine peak intensity (FL9) and mNeonGreen peak intensity (FL10) as ‘Log_Height’ (a.u.). a, Normalized excitation and emission spectra for mNeonGreen and Aquamarine. The 405-nm laser line is shown as a vertical bar and bandpass filters are shown as open boxes, as rendered by FPBase. As FRET occurs, the emission output is shifted from the FL9 to the FL10 bandpass. b, Baseline level of AuxSen FRET response, without exogenous IAA. c, Maximal response level of AuxSen with 10 mM IAA.
Extended Data Fig. 7
Extended Data Fig. 7. Demonstration of relevant population regions and Aquamarine, mNeonGreen and AuxSen fluorescent emission in cell-suspension-culture protoplasts.
Bivariate plots from left to right are as follows: forward versus side-scatter log area ungated; emission peak to shoulder FL1 (534/30) versus FL2 (585/29); forward versus side-scatter log area with cells of interest marked and gated for bd; emission peak-to-shoulder FL9 (465/30) versus FL10 (529/28). Arrows indicate ‘gating’, meaning that the following plot is restricted to those data points that fall within that particular window. a, Cells only transfected with water. b, Cells transfected with pJIT60-2xp35SS:NLS:Aquamarine. Cells expressing Aquamarine were used to determine which scattering population produced the fluorescent protein. This gate is followed for mNeonGreen emission. c, Cells transfected with pJIT60-2xp35SS:NLS:mNeonGreen. Cells expressing mNeonGreen were used to determine which scattering population produced the fluorescent protein. This gate is followed for Aquamarine emission. d, Cells transfected with pJIT60-2xp35SS:NLS:AuxSen. Cells expressing AuxSen identified by their mNeonGreen emission then restricted to the ‘cells of interest’ scattering population that produced the greatest amount of protein. The FRET-response region was then made to encompass the entire range of possible fluorescence, including the shift in the FL9 to the FL10 bandpasses. See also Supplementary Table 2. Flow cytometry basic gate statistics and FRET-ratios based on (‘FL10-Log_Height’/‘FL9-Log_Height’) ratio are plotted against time for the final gate FRET response.
Extended Data Fig. 8
Extended Data Fig. 8. Quantitative analysis of PIN mRNA accumulation in seedlings treated with 10 μM IAA.
Seedlings were kept in MS medium (control; 0 min, purple) or transferred to a solution containing 10 μM IAA. RNA was extracted from 6 seedlings each after 10 min (blue) or 60 min (orange) and subjected to analysis by quantitative PCR with reverse transcription. Data are mean ± s.d. derived from 3 technical replicates, and black dots represent individual values.

Comment in

  • O auxin, where art thou?
    Balcerowicz M, Shetty KN, Jones AM. Balcerowicz M, et al. Nat Plants. 2021 May;7(5):546-547. doi: 10.1038/s41477-021-00921-1. Nat Plants. 2021. PMID: 33958778 No abstract available.

Similar articles

Cited by

References

    1. Enders, T. A. & Strader, L. C. Auxin activity: Past, present, and future. Am. J. Bot. 102, 180–196 (2015). 10.3732/ajb.1400285 - DOI - PMC - PubMed
    1. Paque, S. & Weijers, D. Q&A: Auxin: the plant molecule that influences almost anything. BMC Biol. 14, 67 (2016). 10.1186/s12915-016-0291-0 - DOI - PMC - PubMed
    1. Ulmasov, T., Murfett, J., Hagen, G. & Guilfoyle, T. J. Aux/IAA proteins repress expression of reporter genes containing natural and highly active synthetic auxin response elements. Plant Cell9, 1963–1971 (1997). - PMC - PubMed
    1. Friml, J. et al. Efflux-dependent auxin gradients establish the apical-basal axis of Arabidopsis. Nature426, 147–153 (2003). 10.1038/nature02085 - DOI - PubMed
    1. Weijers, D. et al. Auxin triggers transient local signaling for cell specification in Arabidopsis embryogenesis. Dev. Cell10, 265–270 (2006). 10.1016/j.devcel.2005.12.001 - DOI - PubMed

Publication types