. 2021 Apr;592(7855):611-615.
doi: 10.1038/s41586-021-03440-3. Epub 2021 Apr 7.

Type III-A CRISPR immunity promotes mutagenesis of staphylococci

Affiliations

Type III-A CRISPR immunity promotes mutagenesis of staphylococci

Charlie Y Mo et al. Nature. 2021 Apr.

Abstract

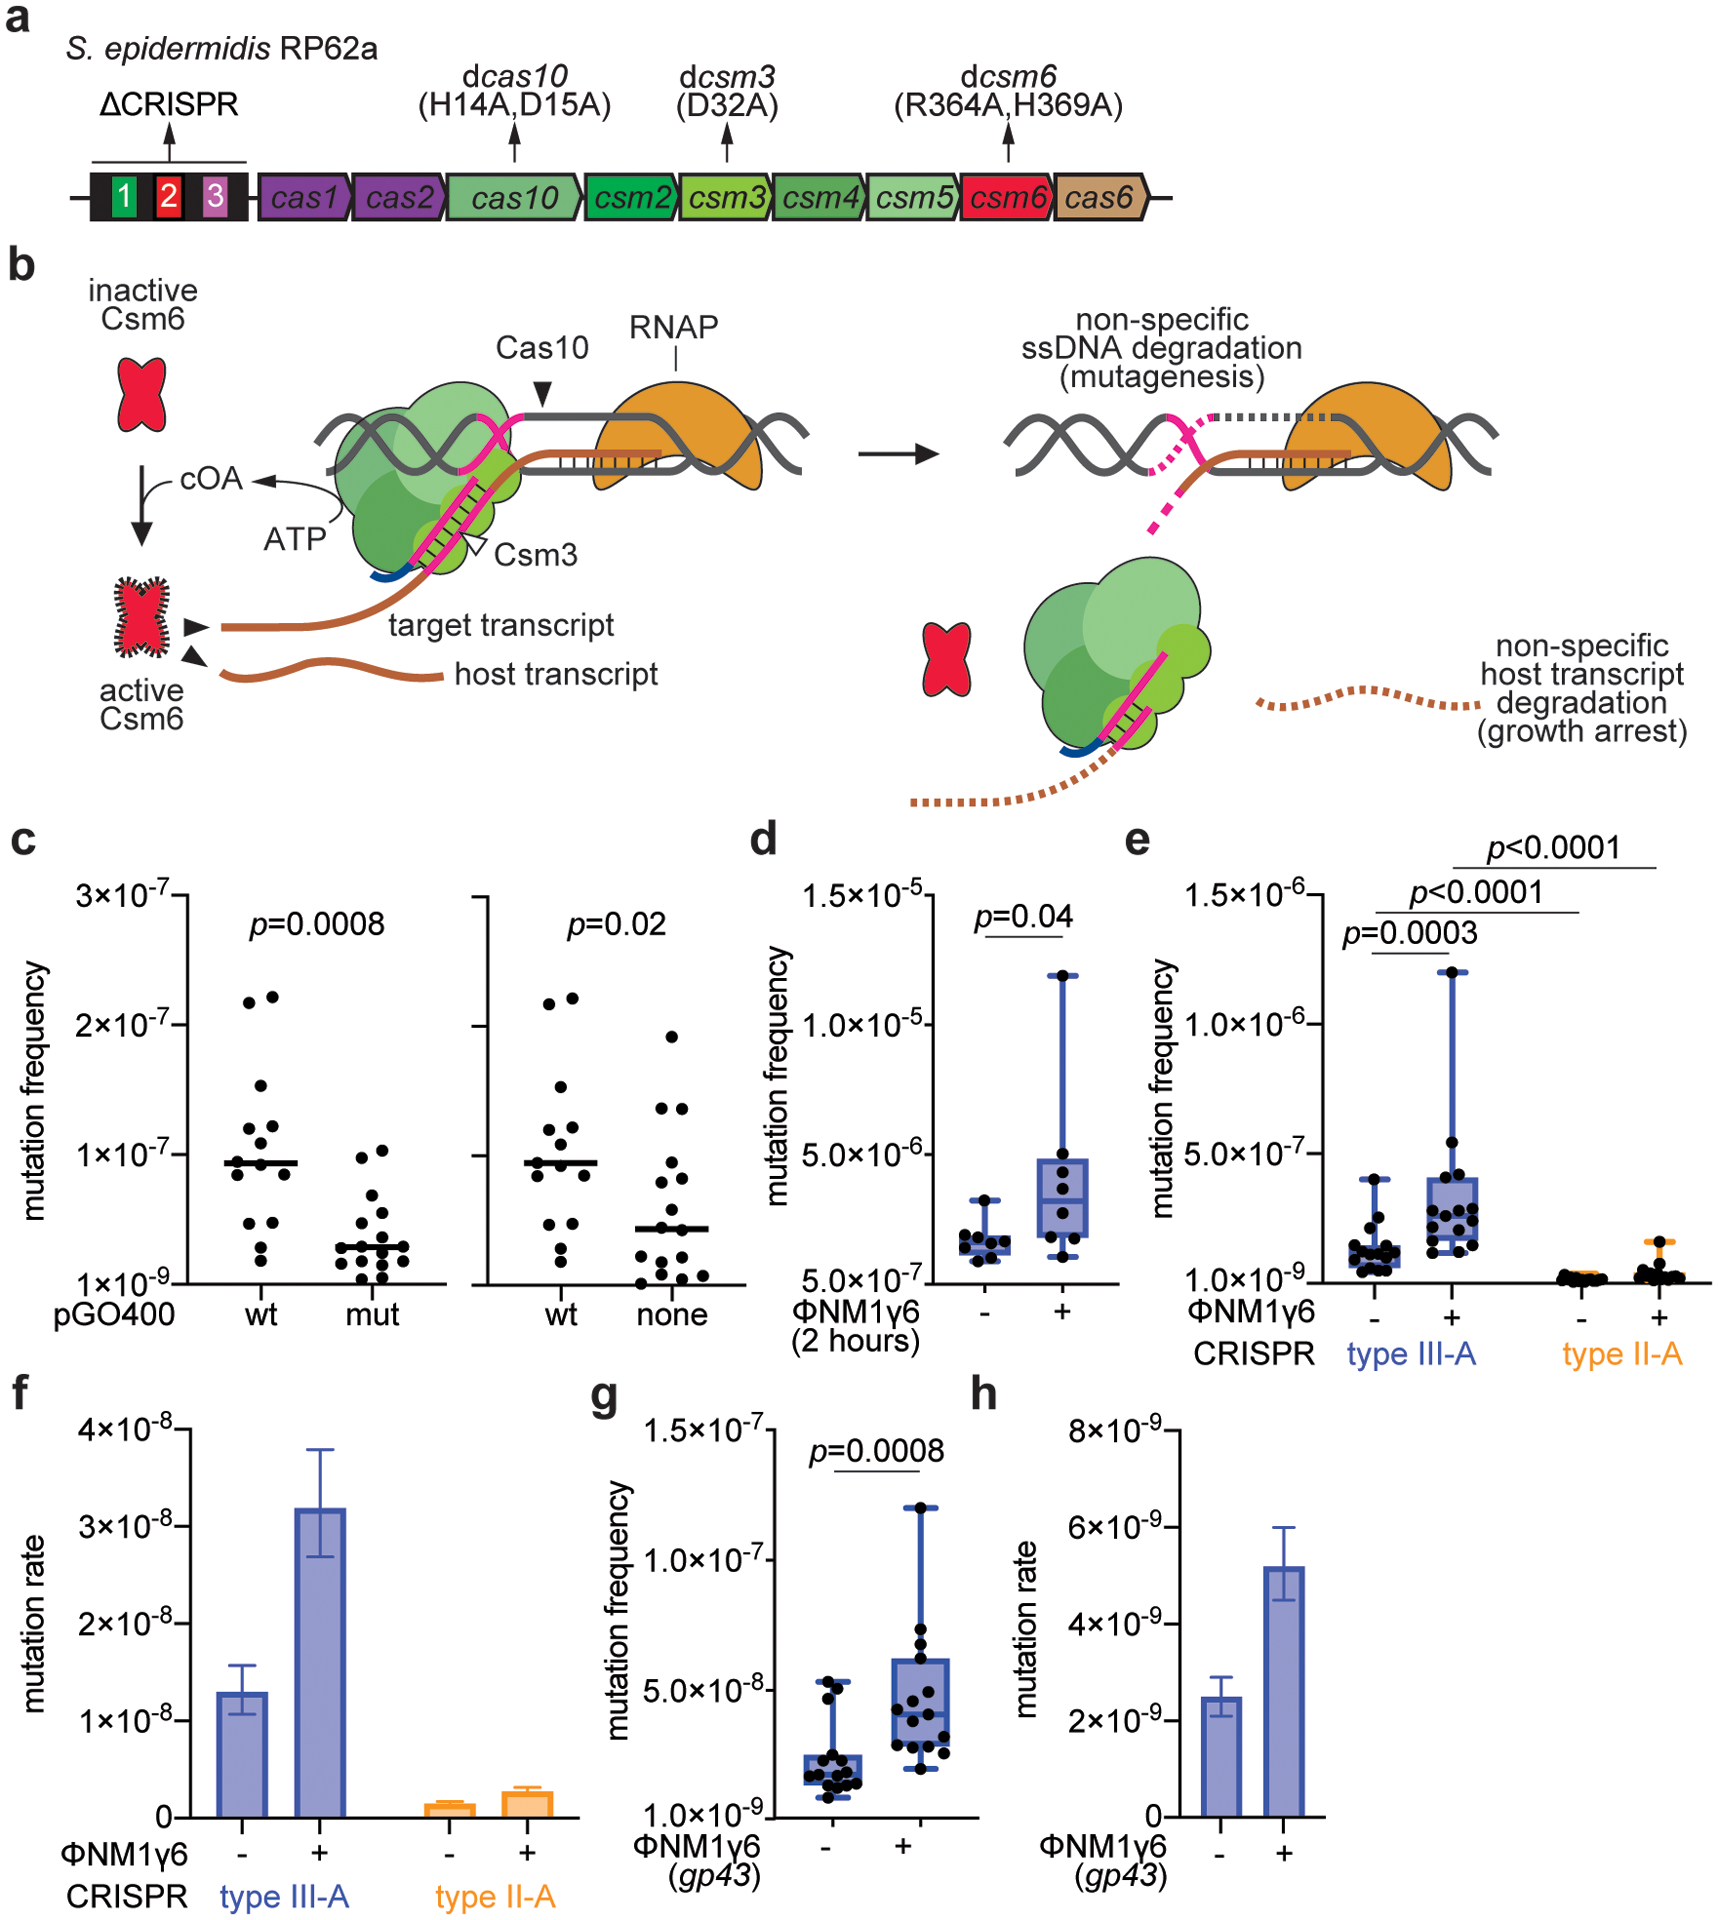
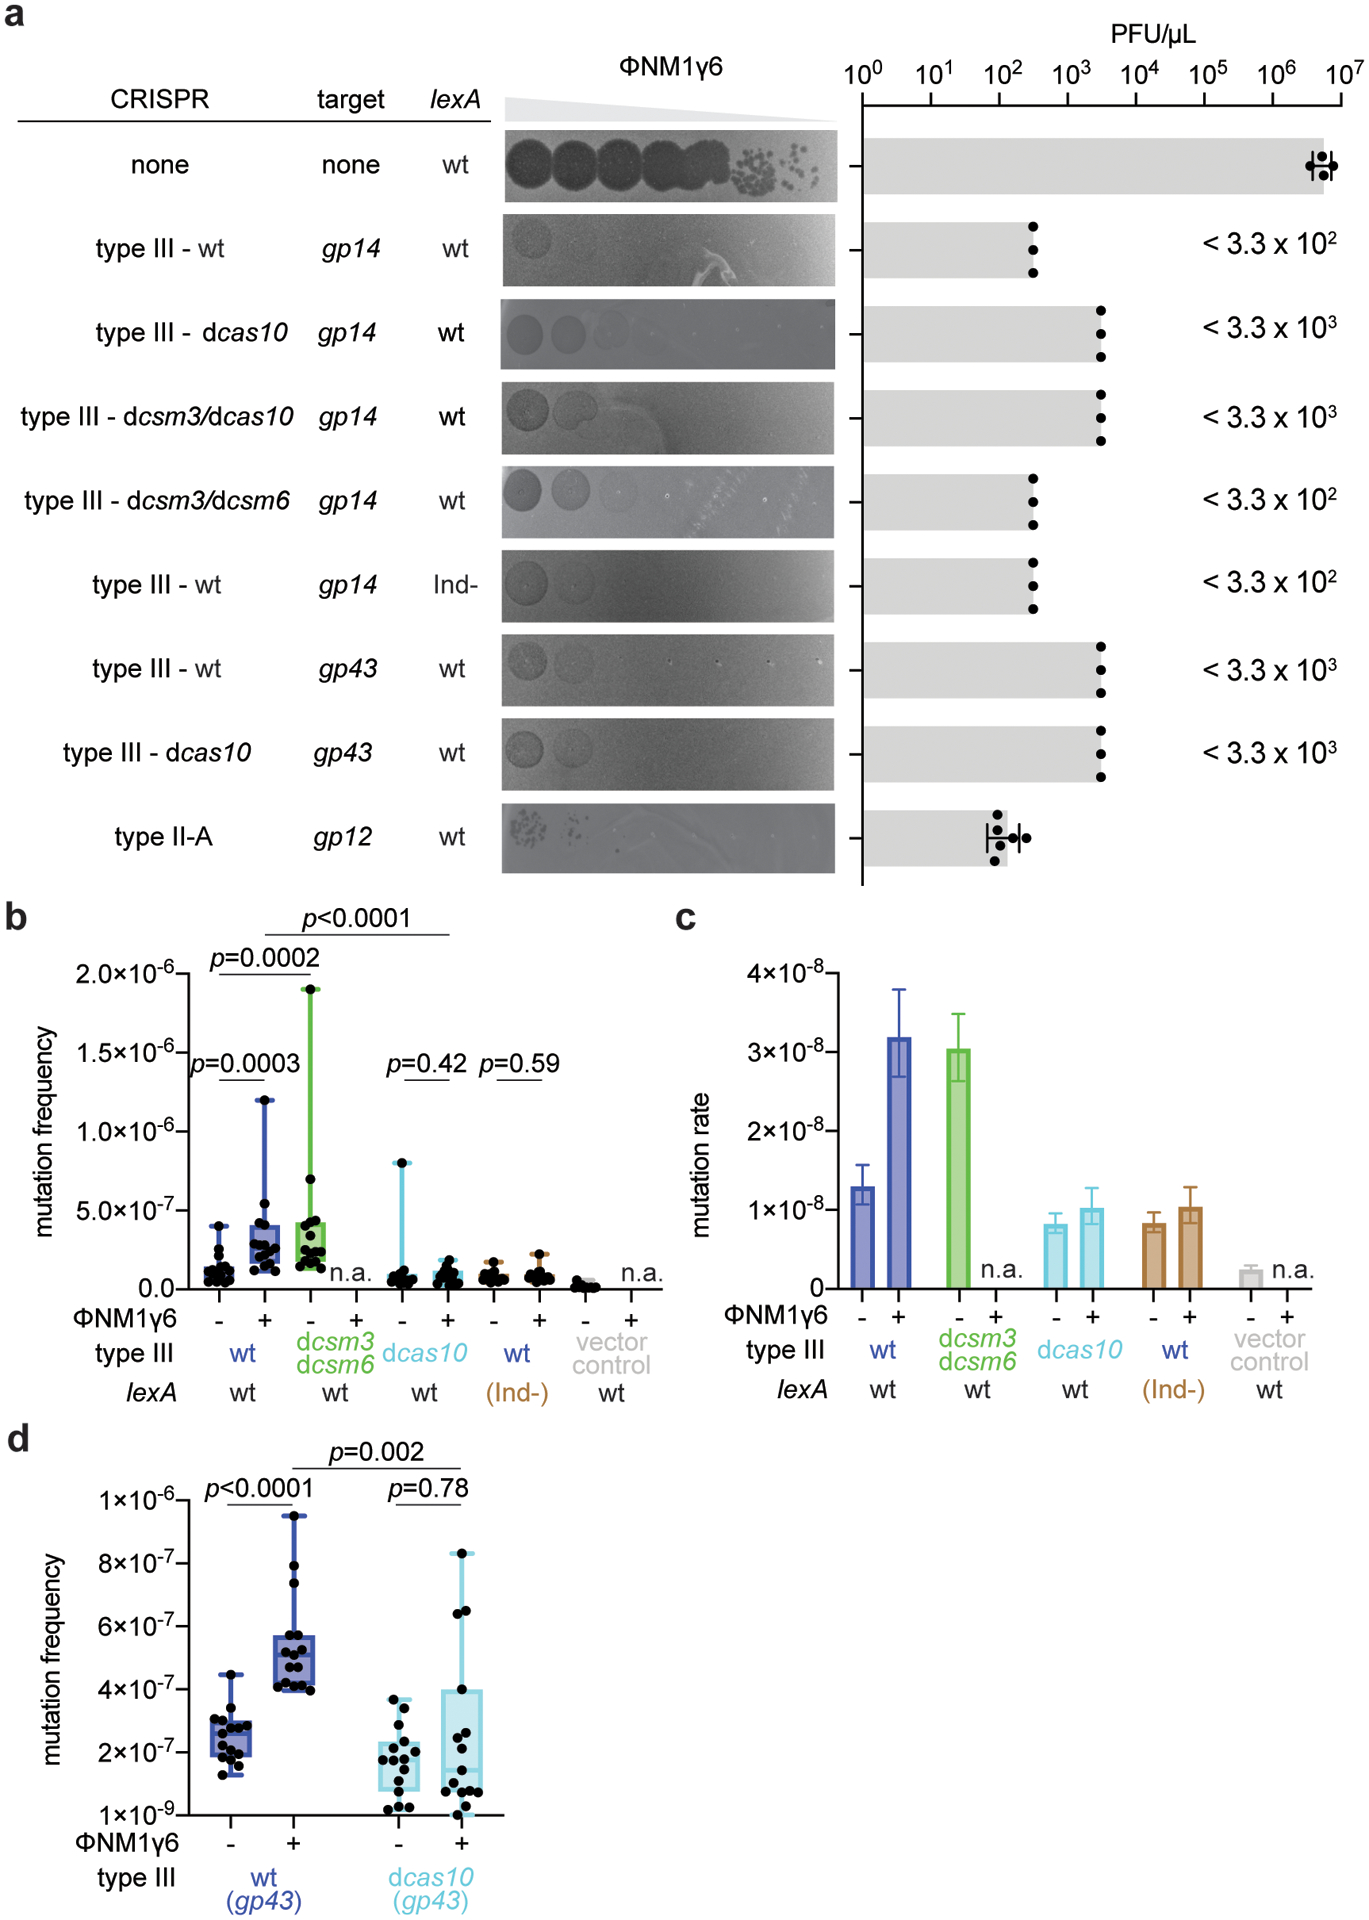
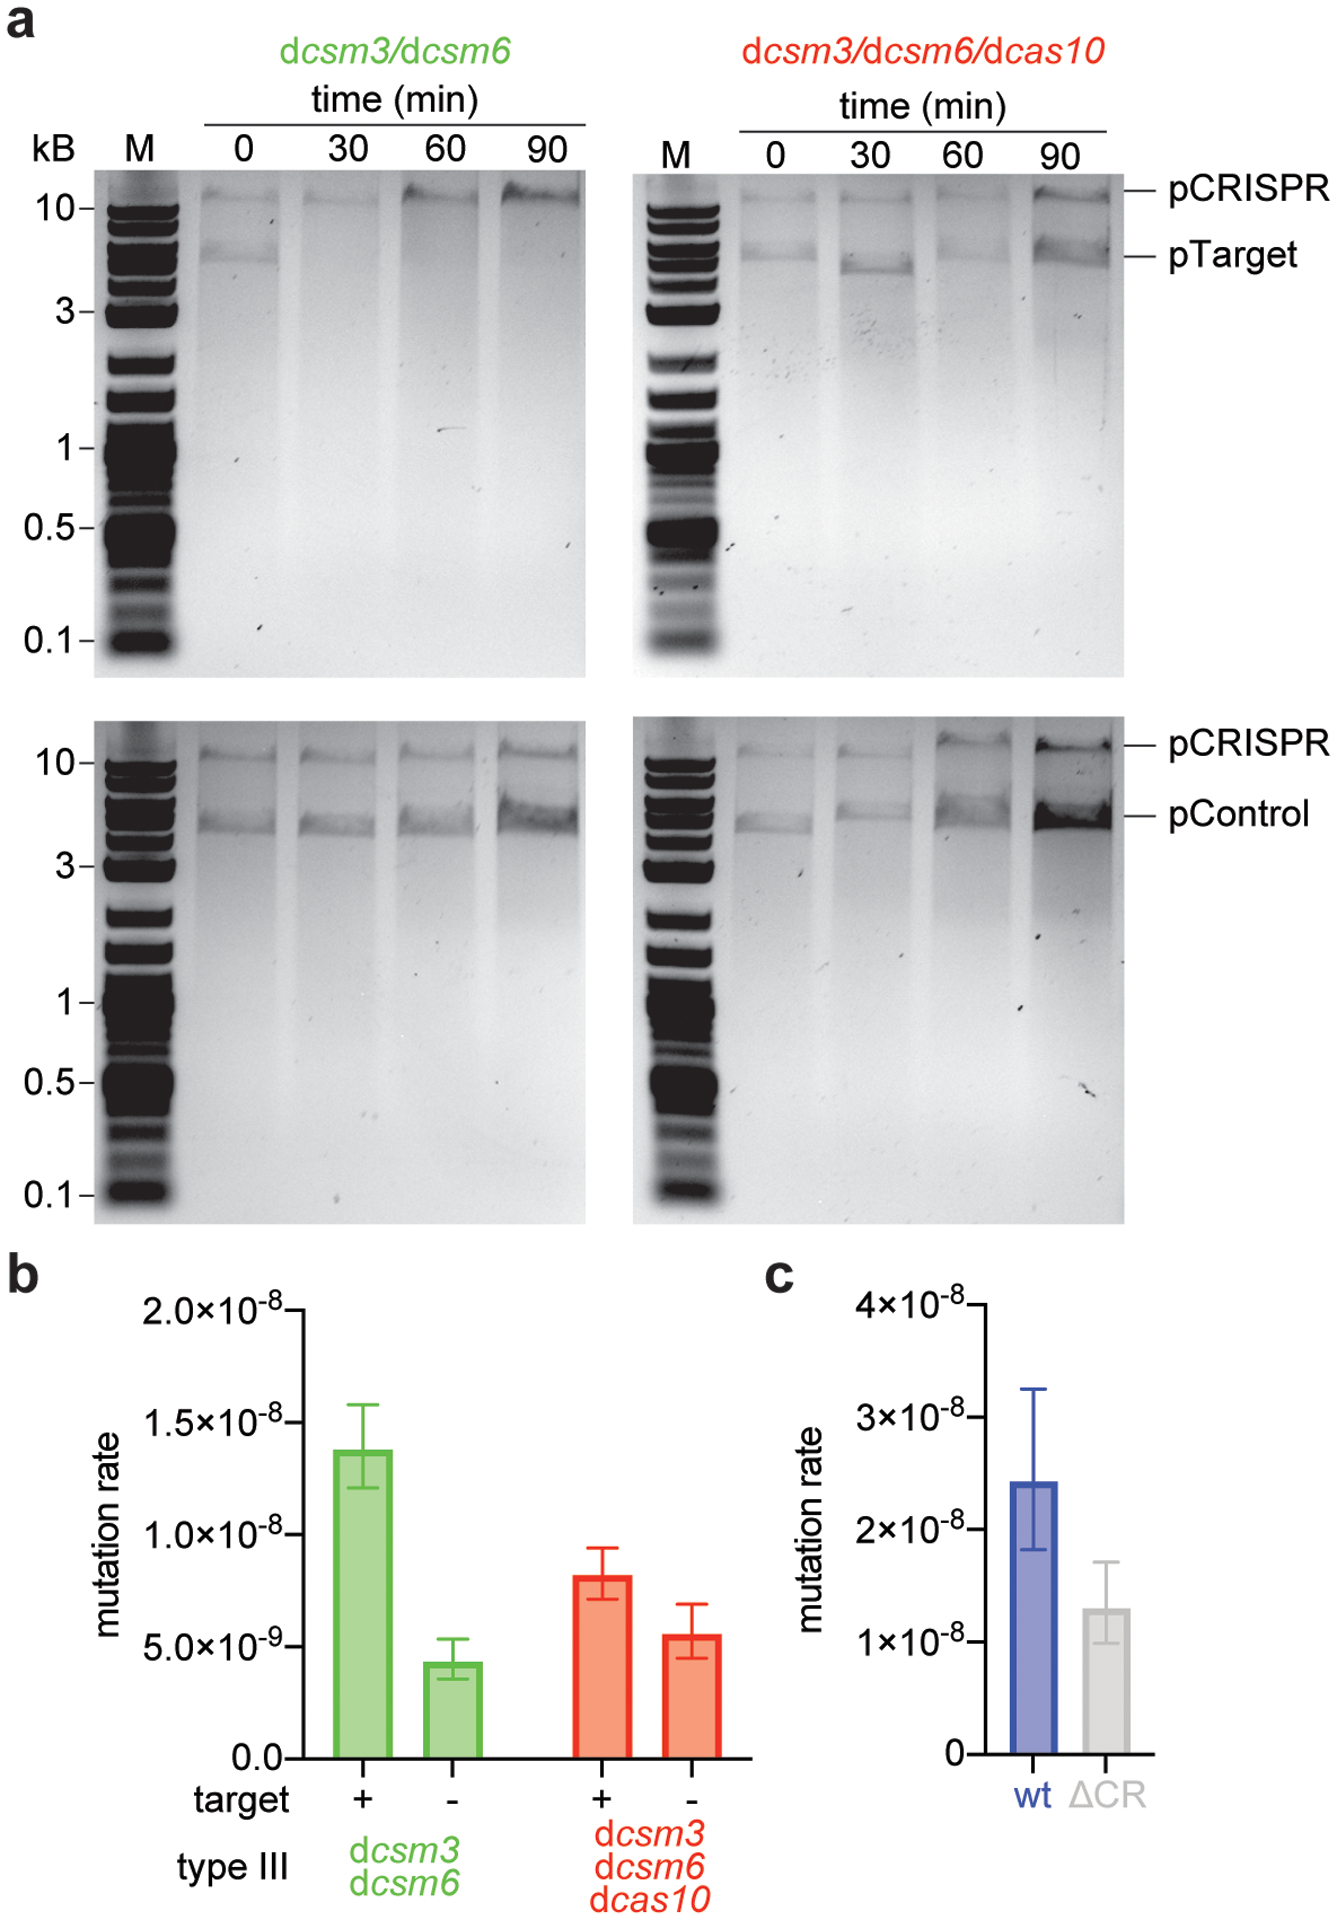
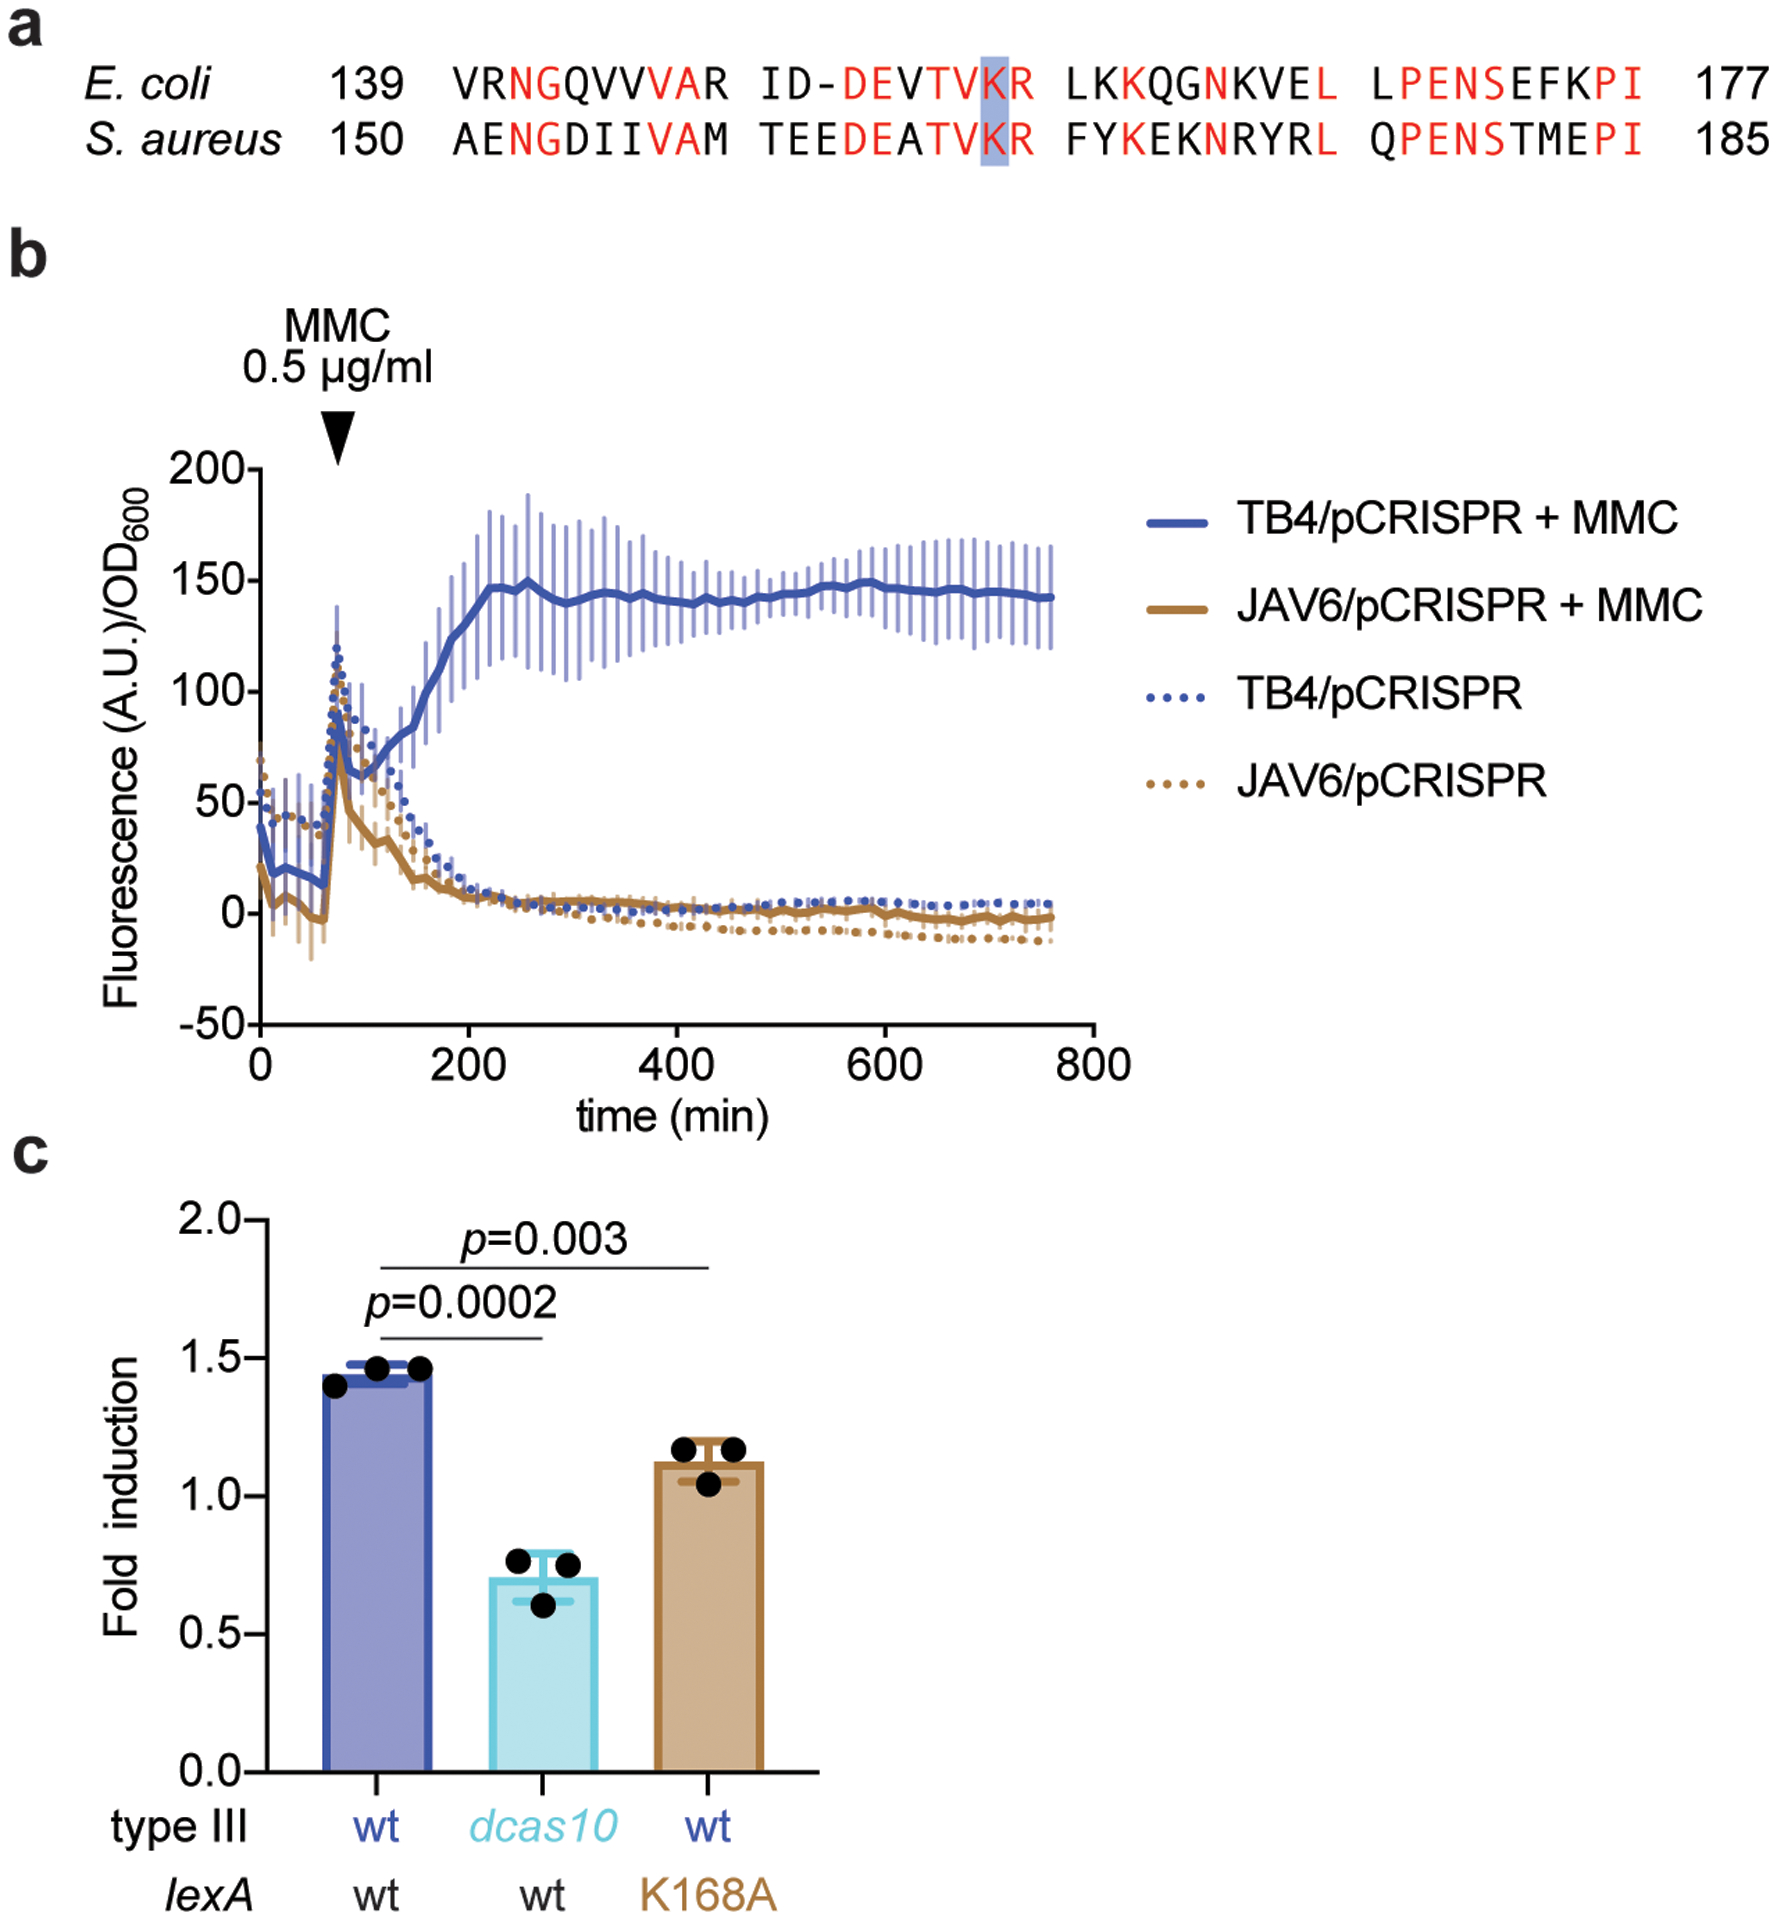
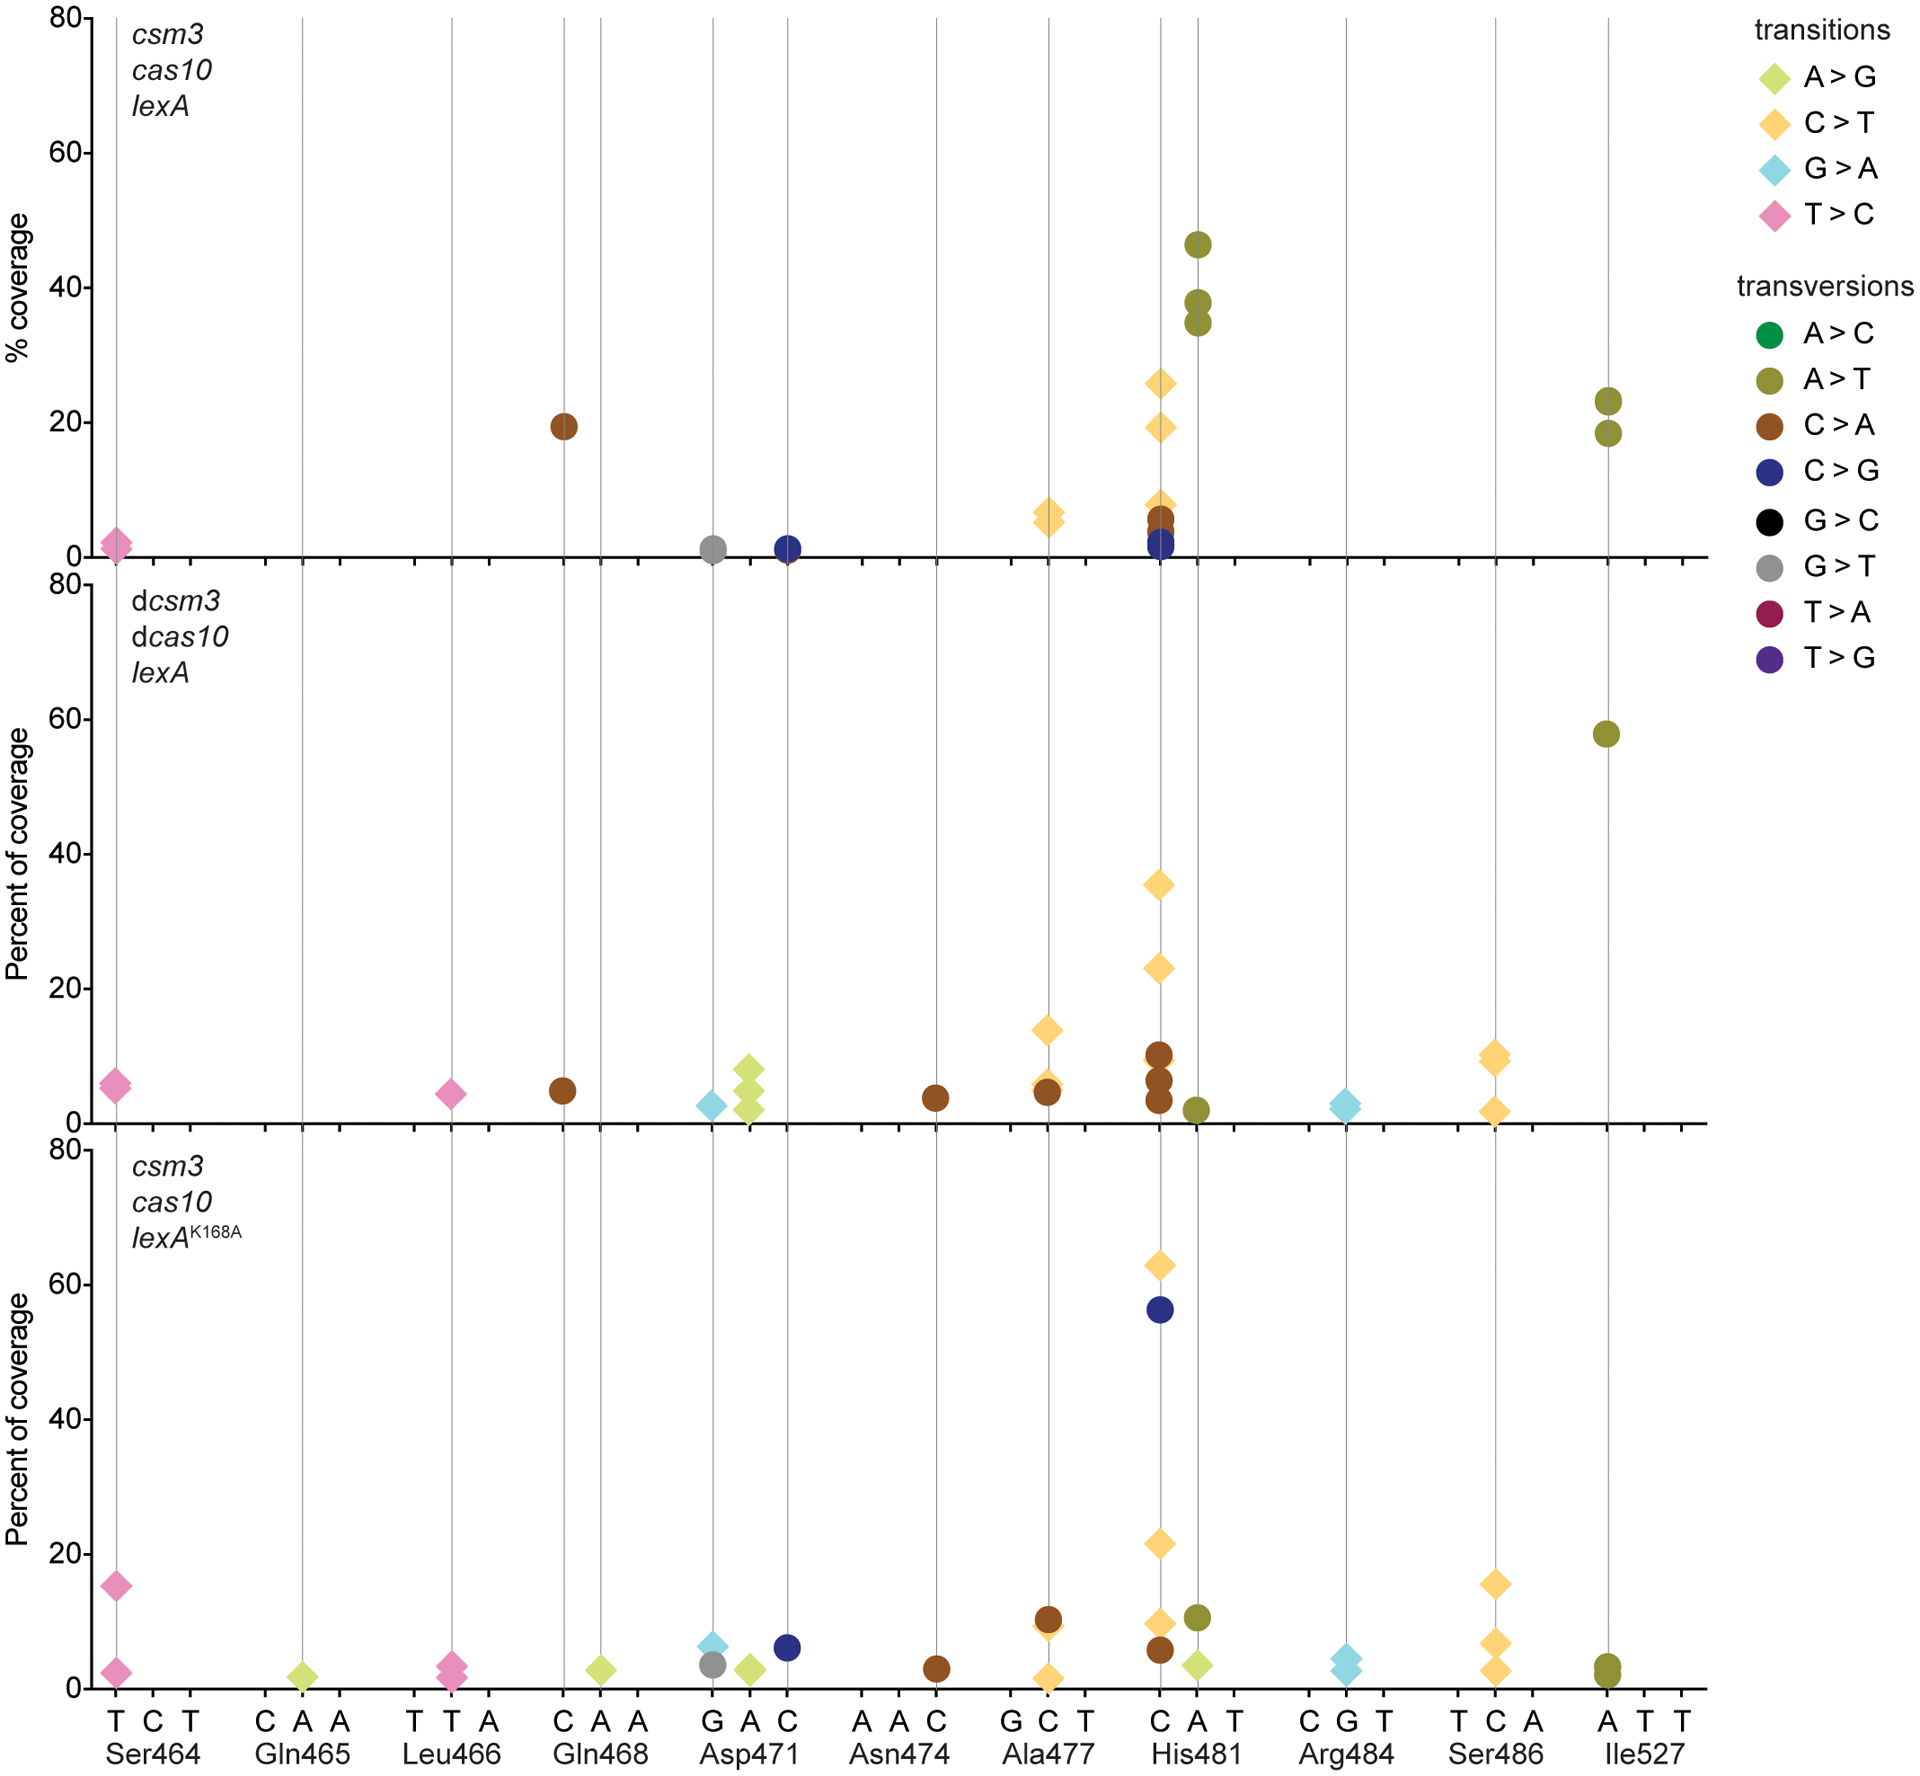
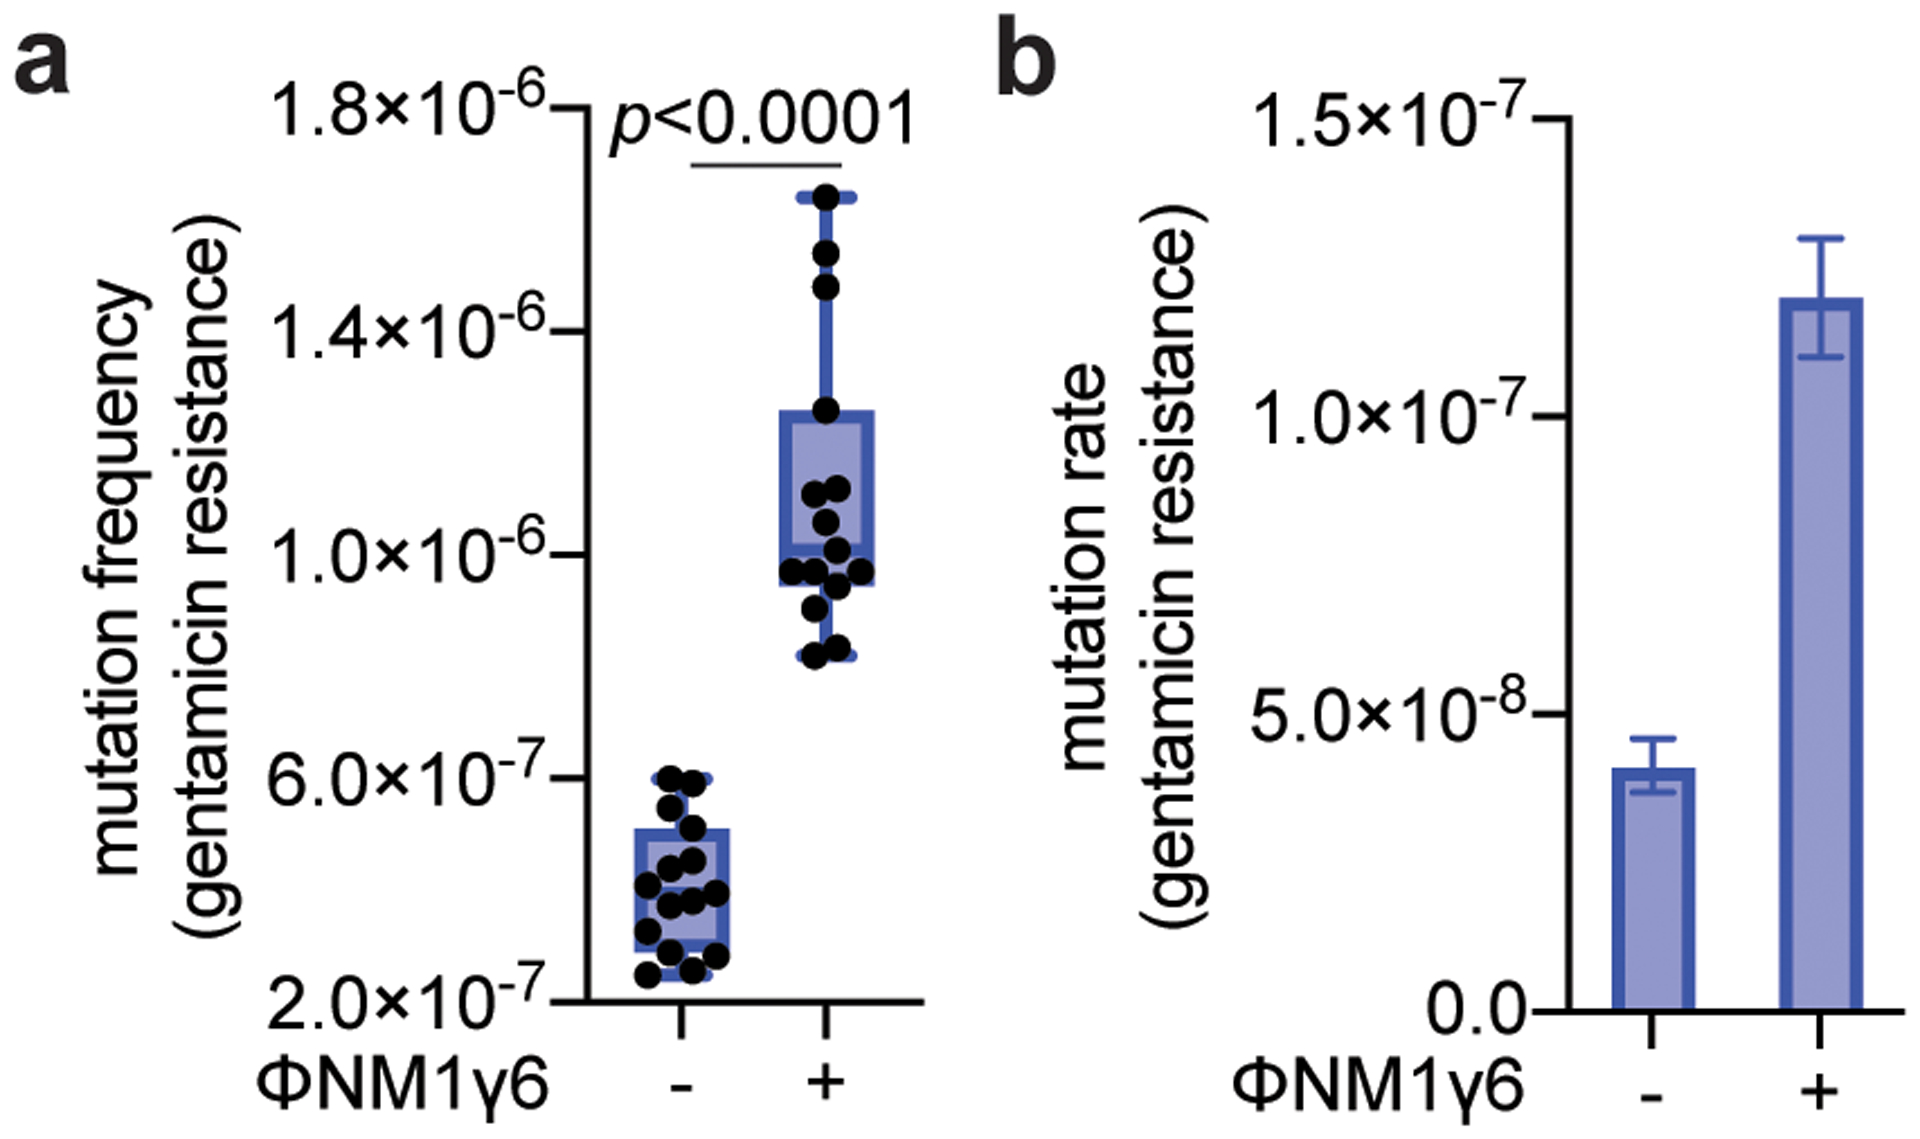
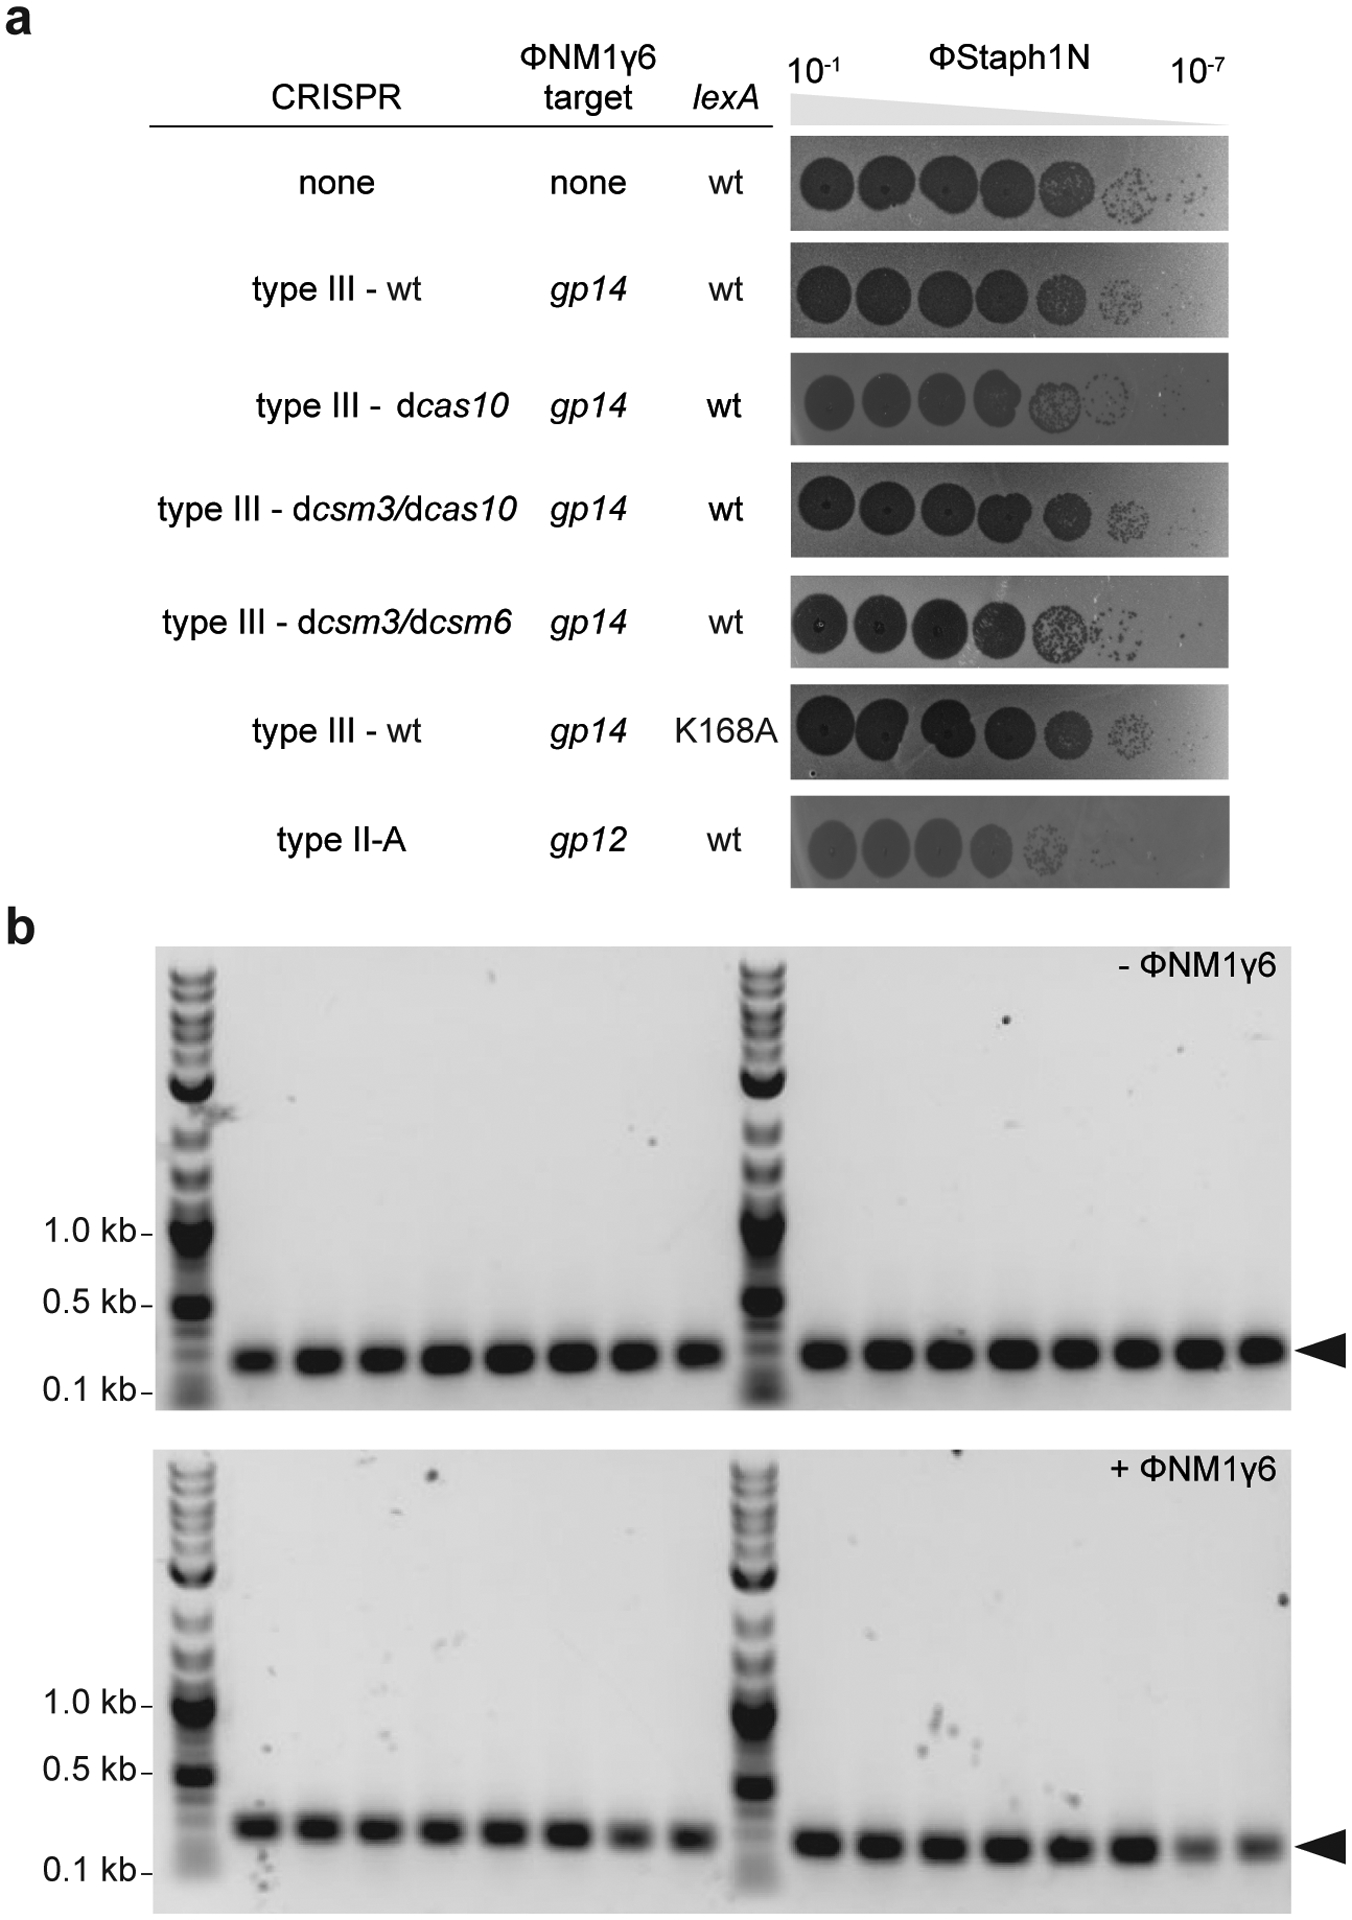
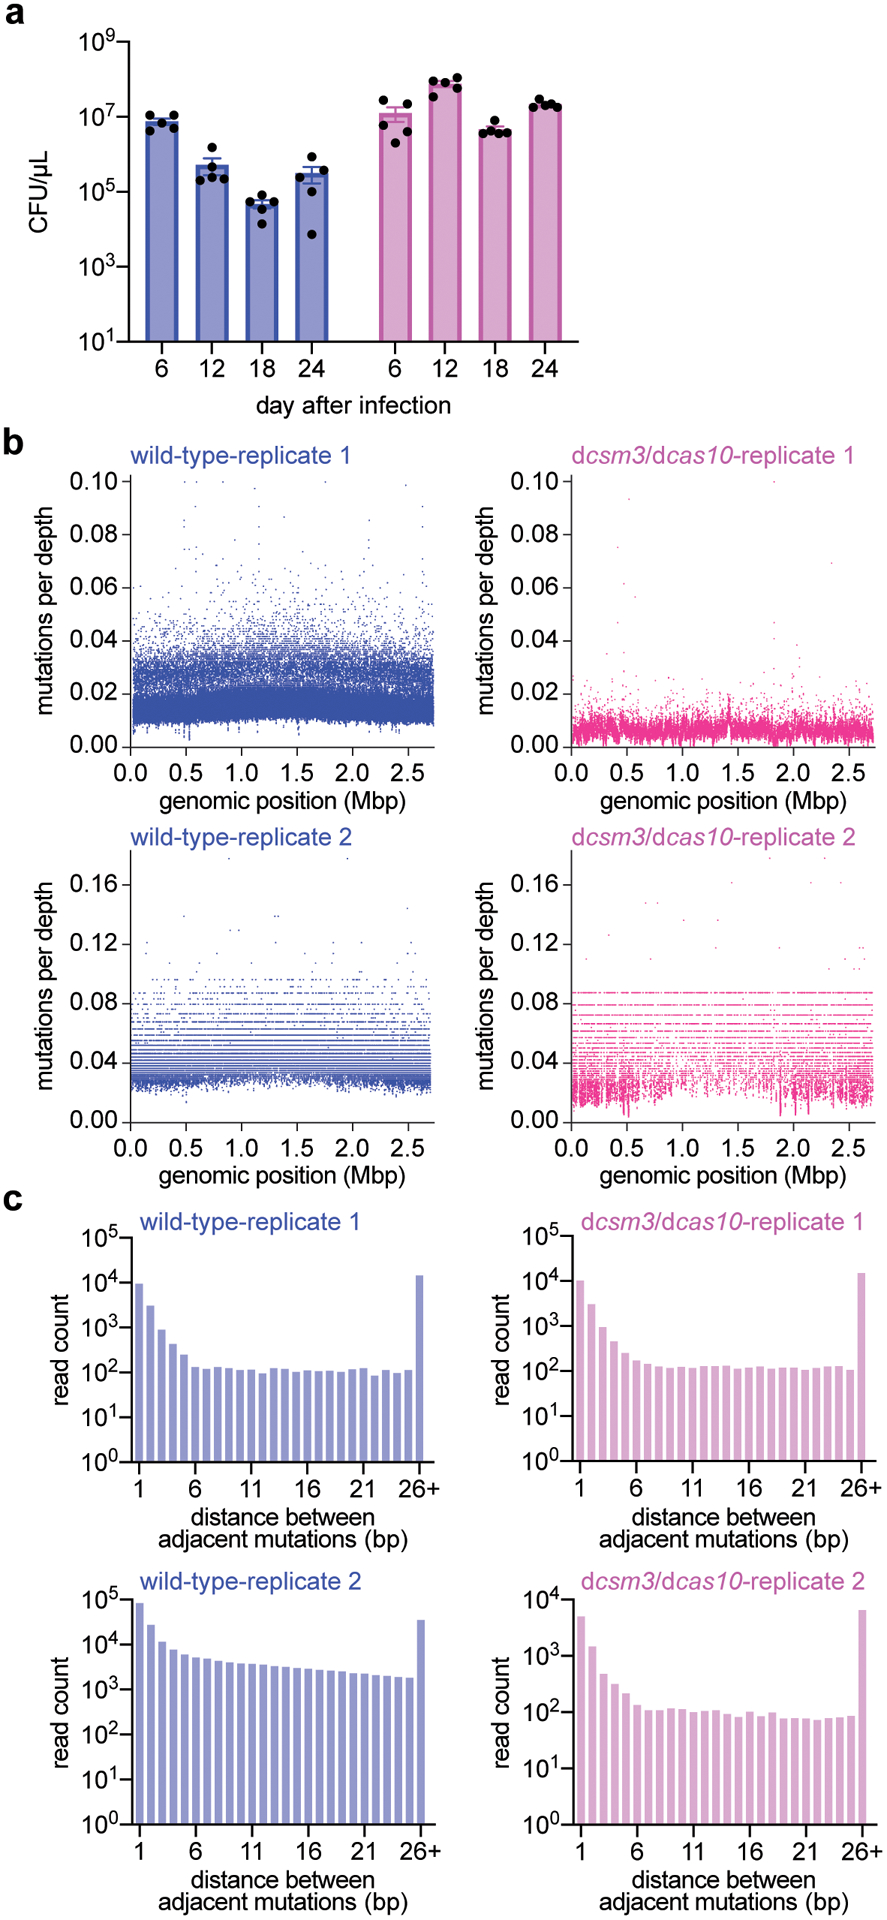
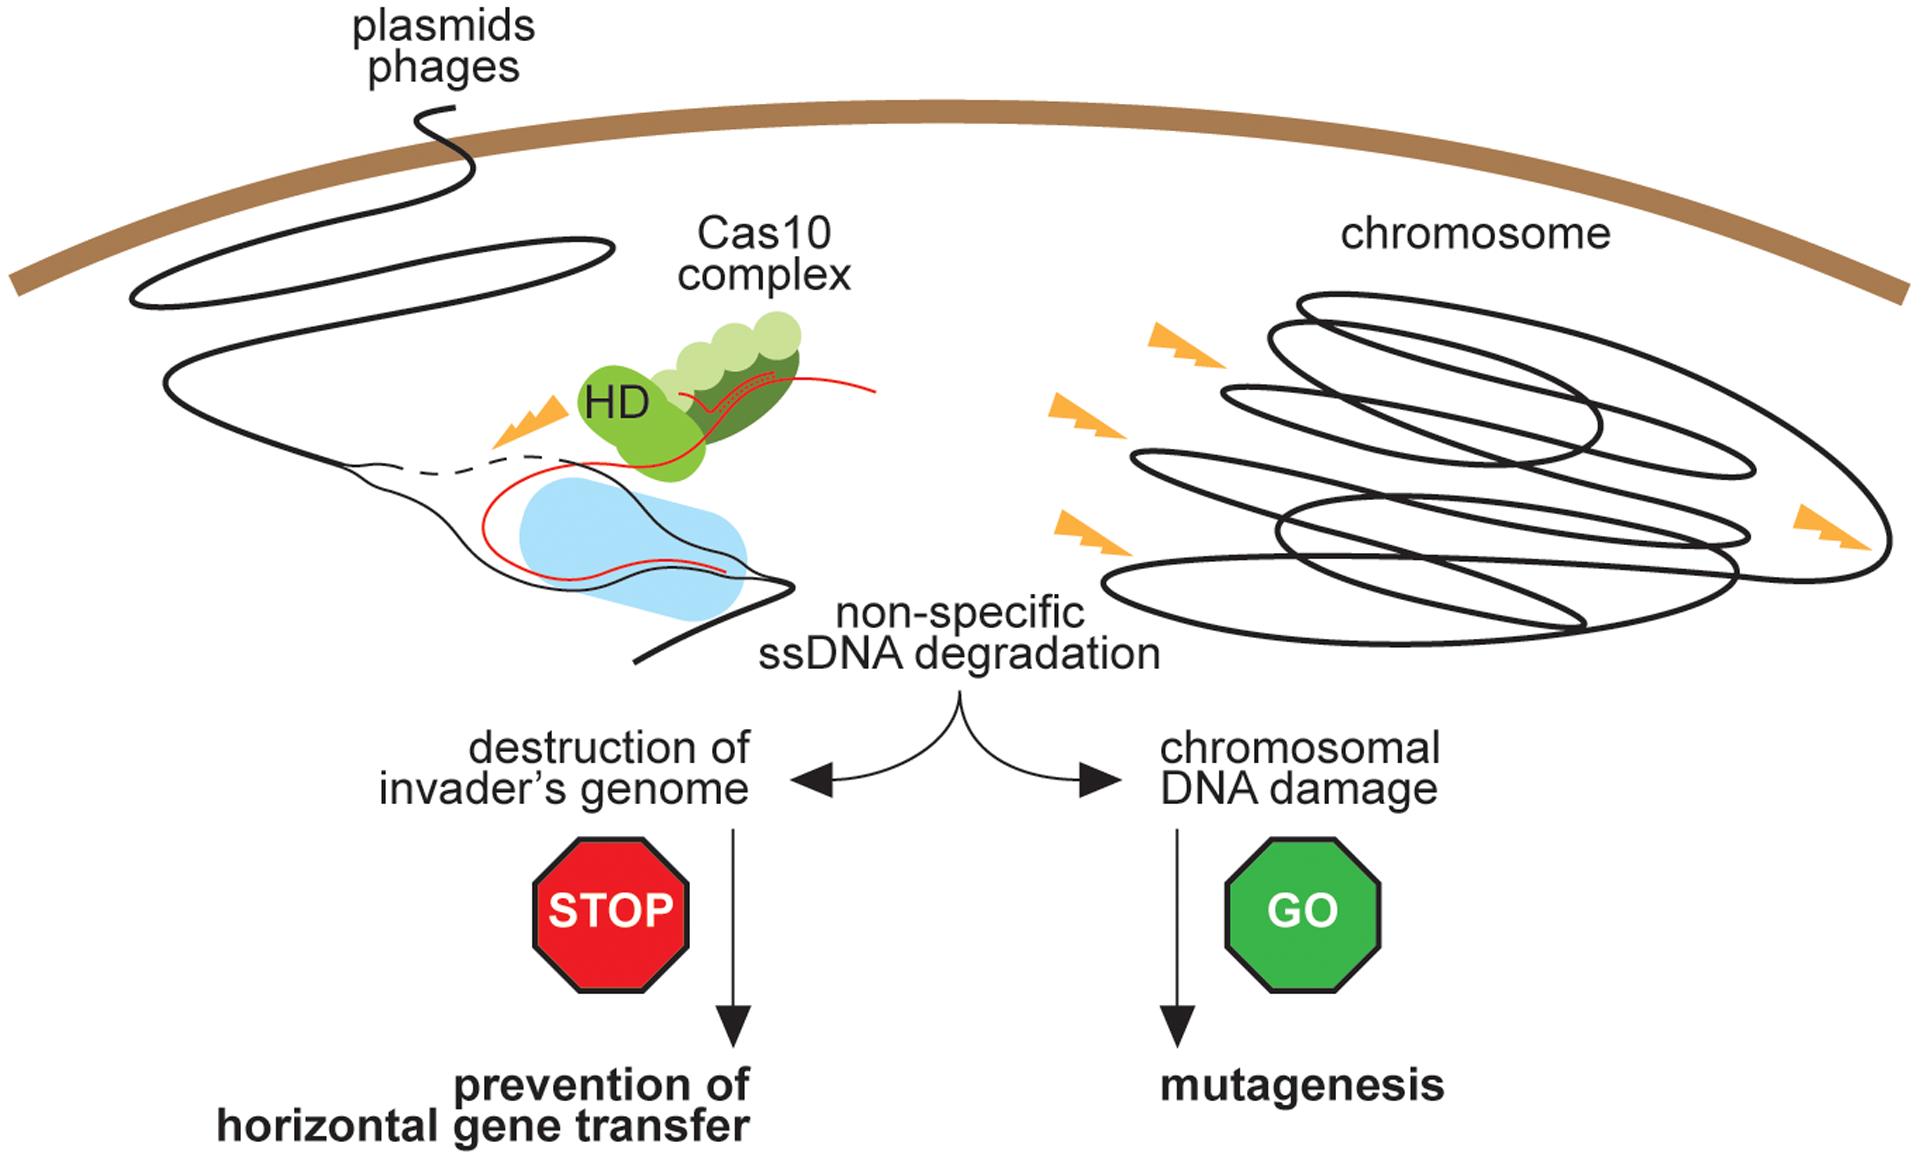
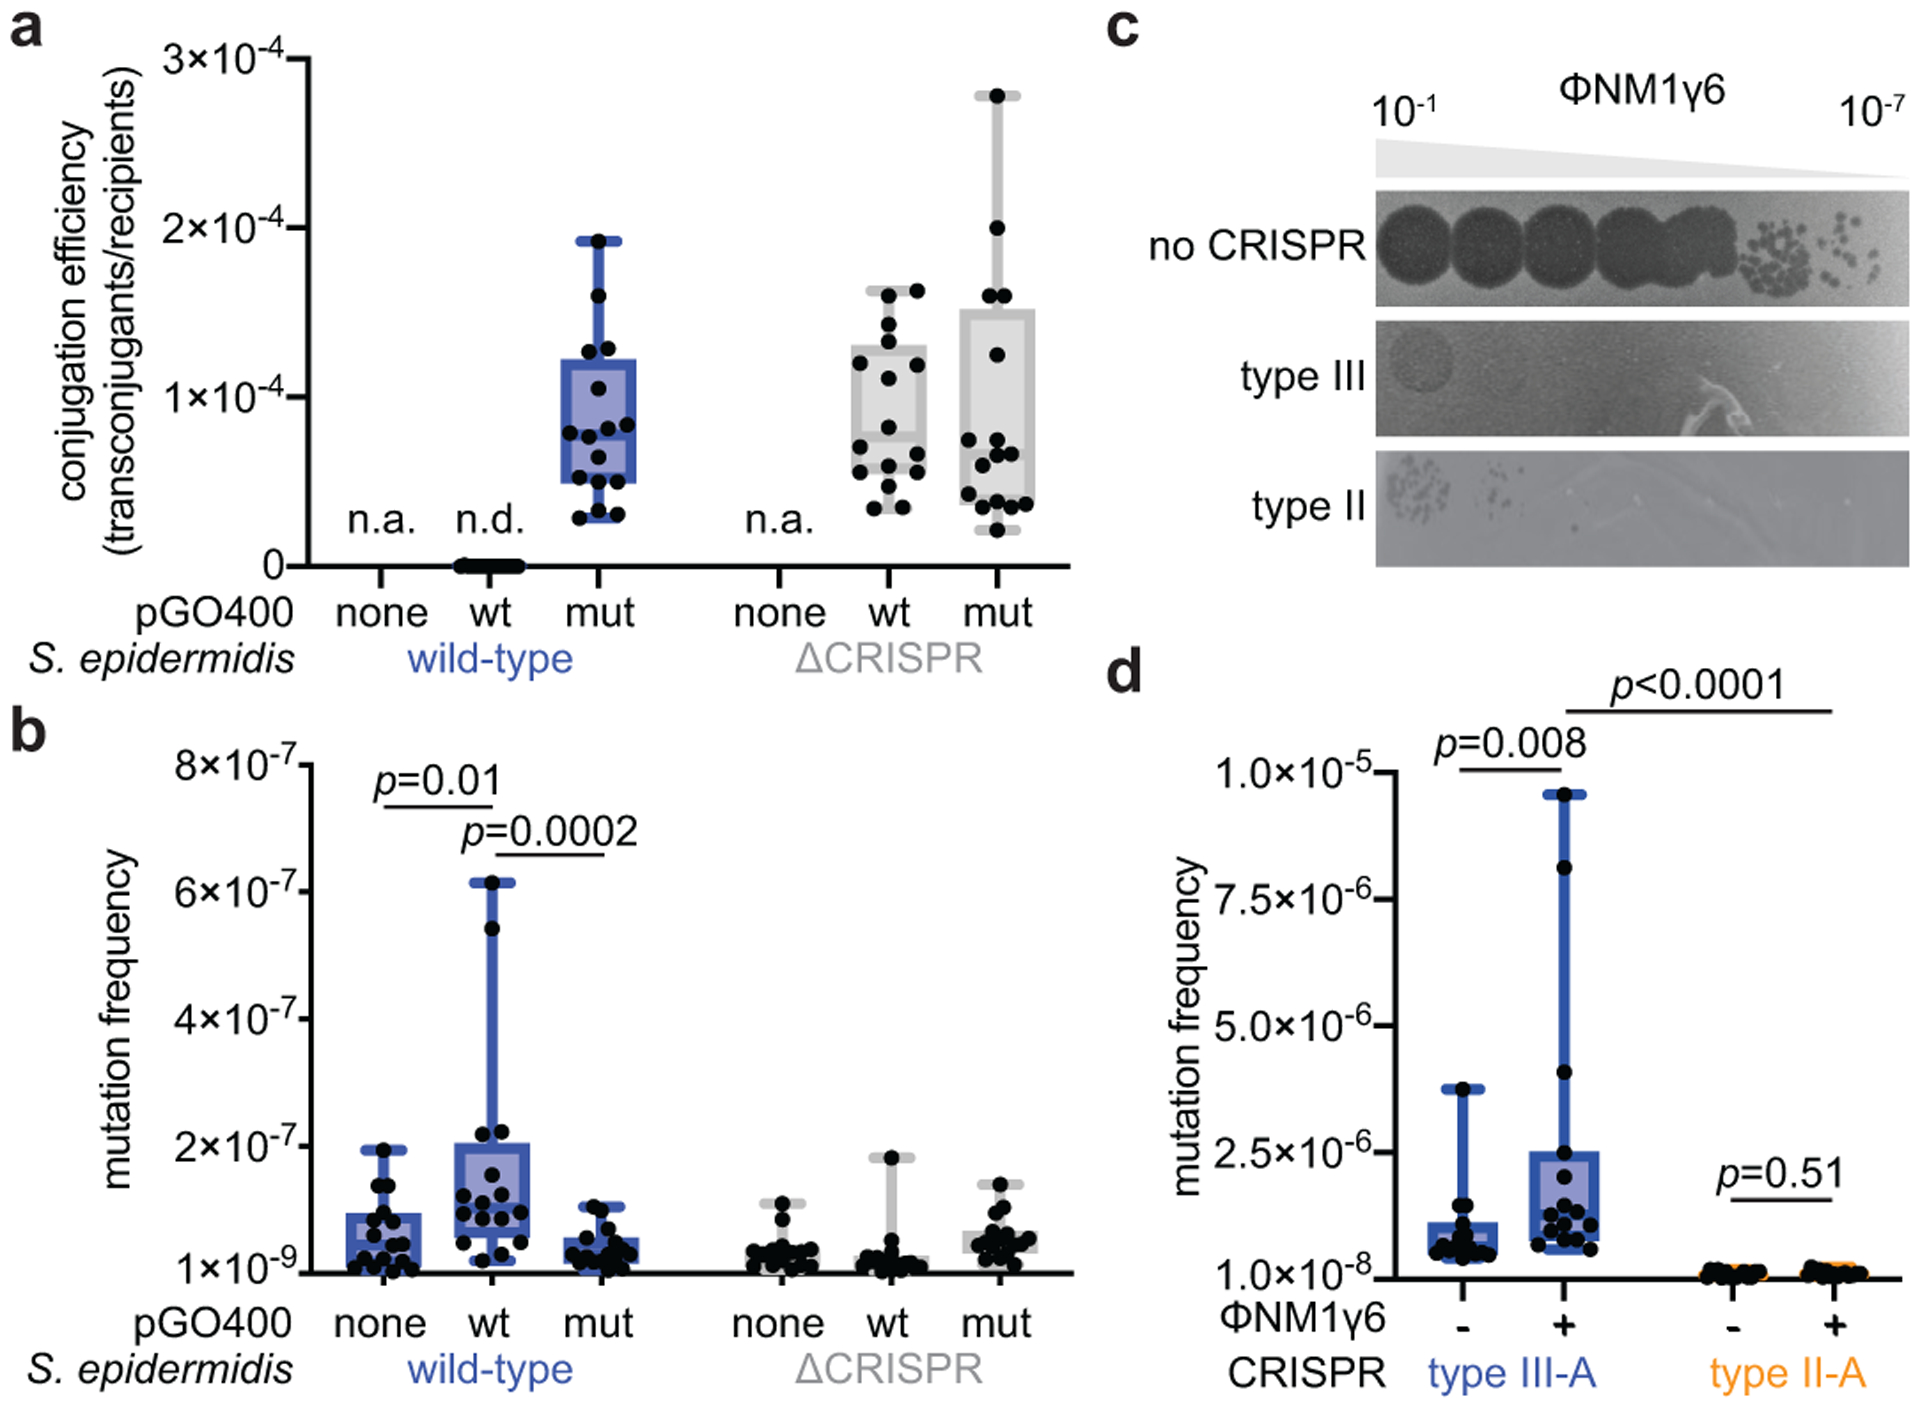
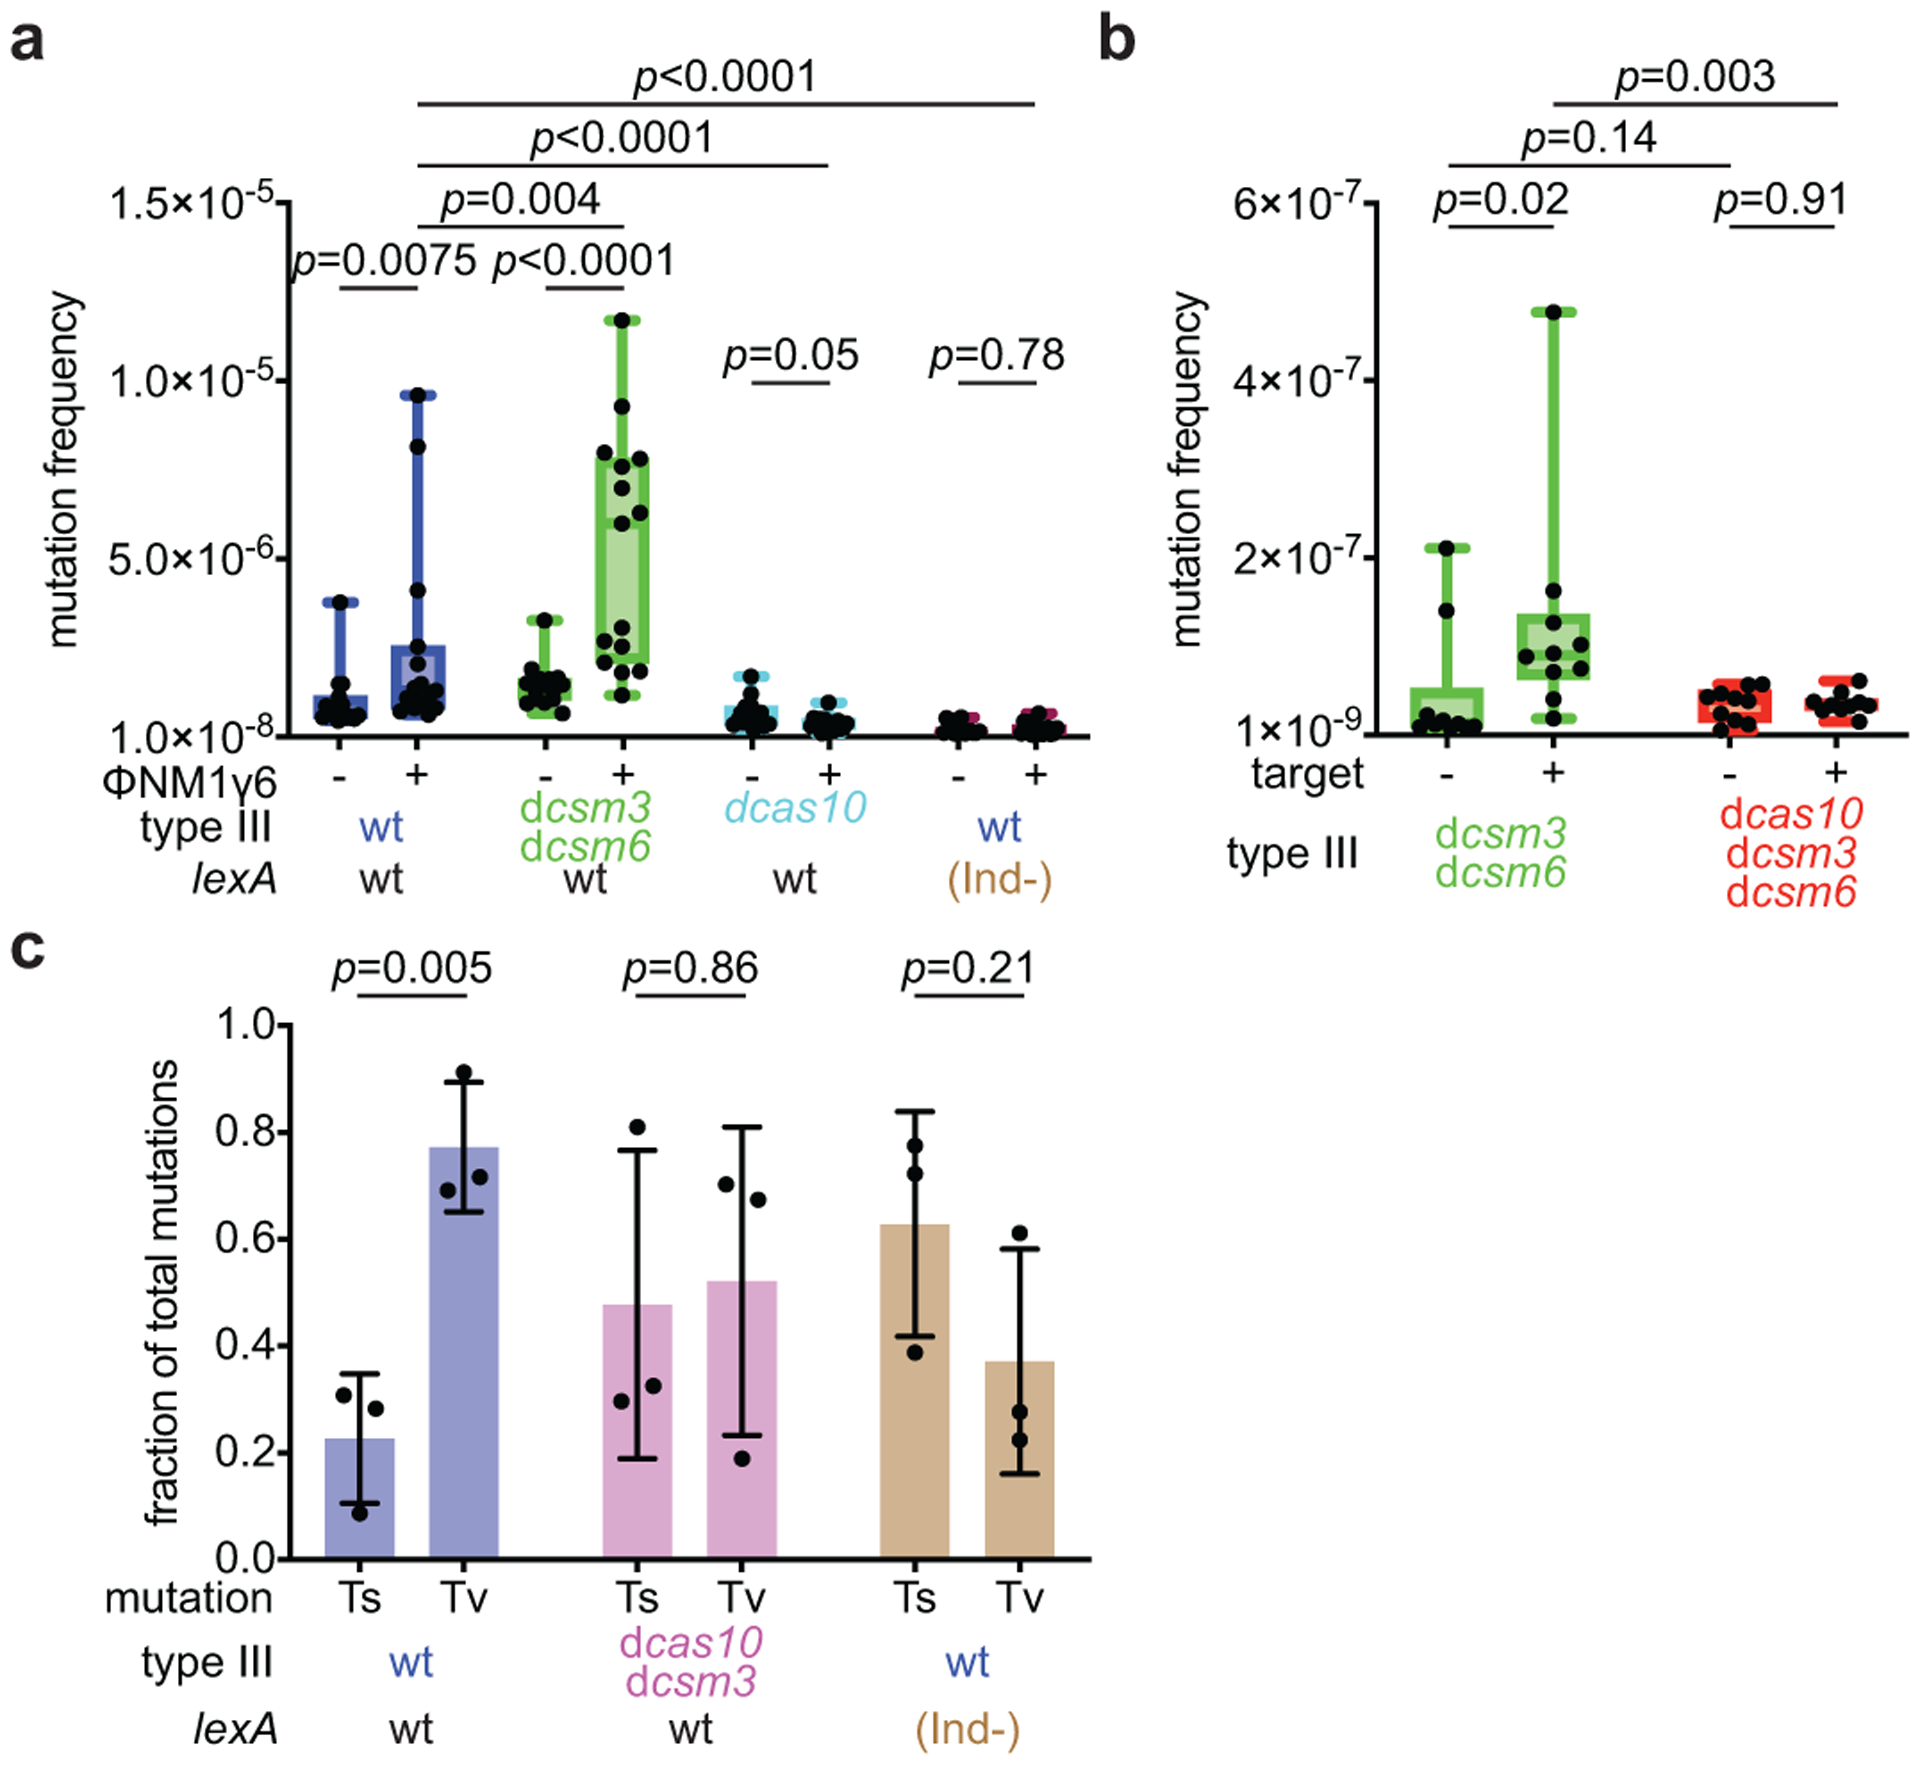
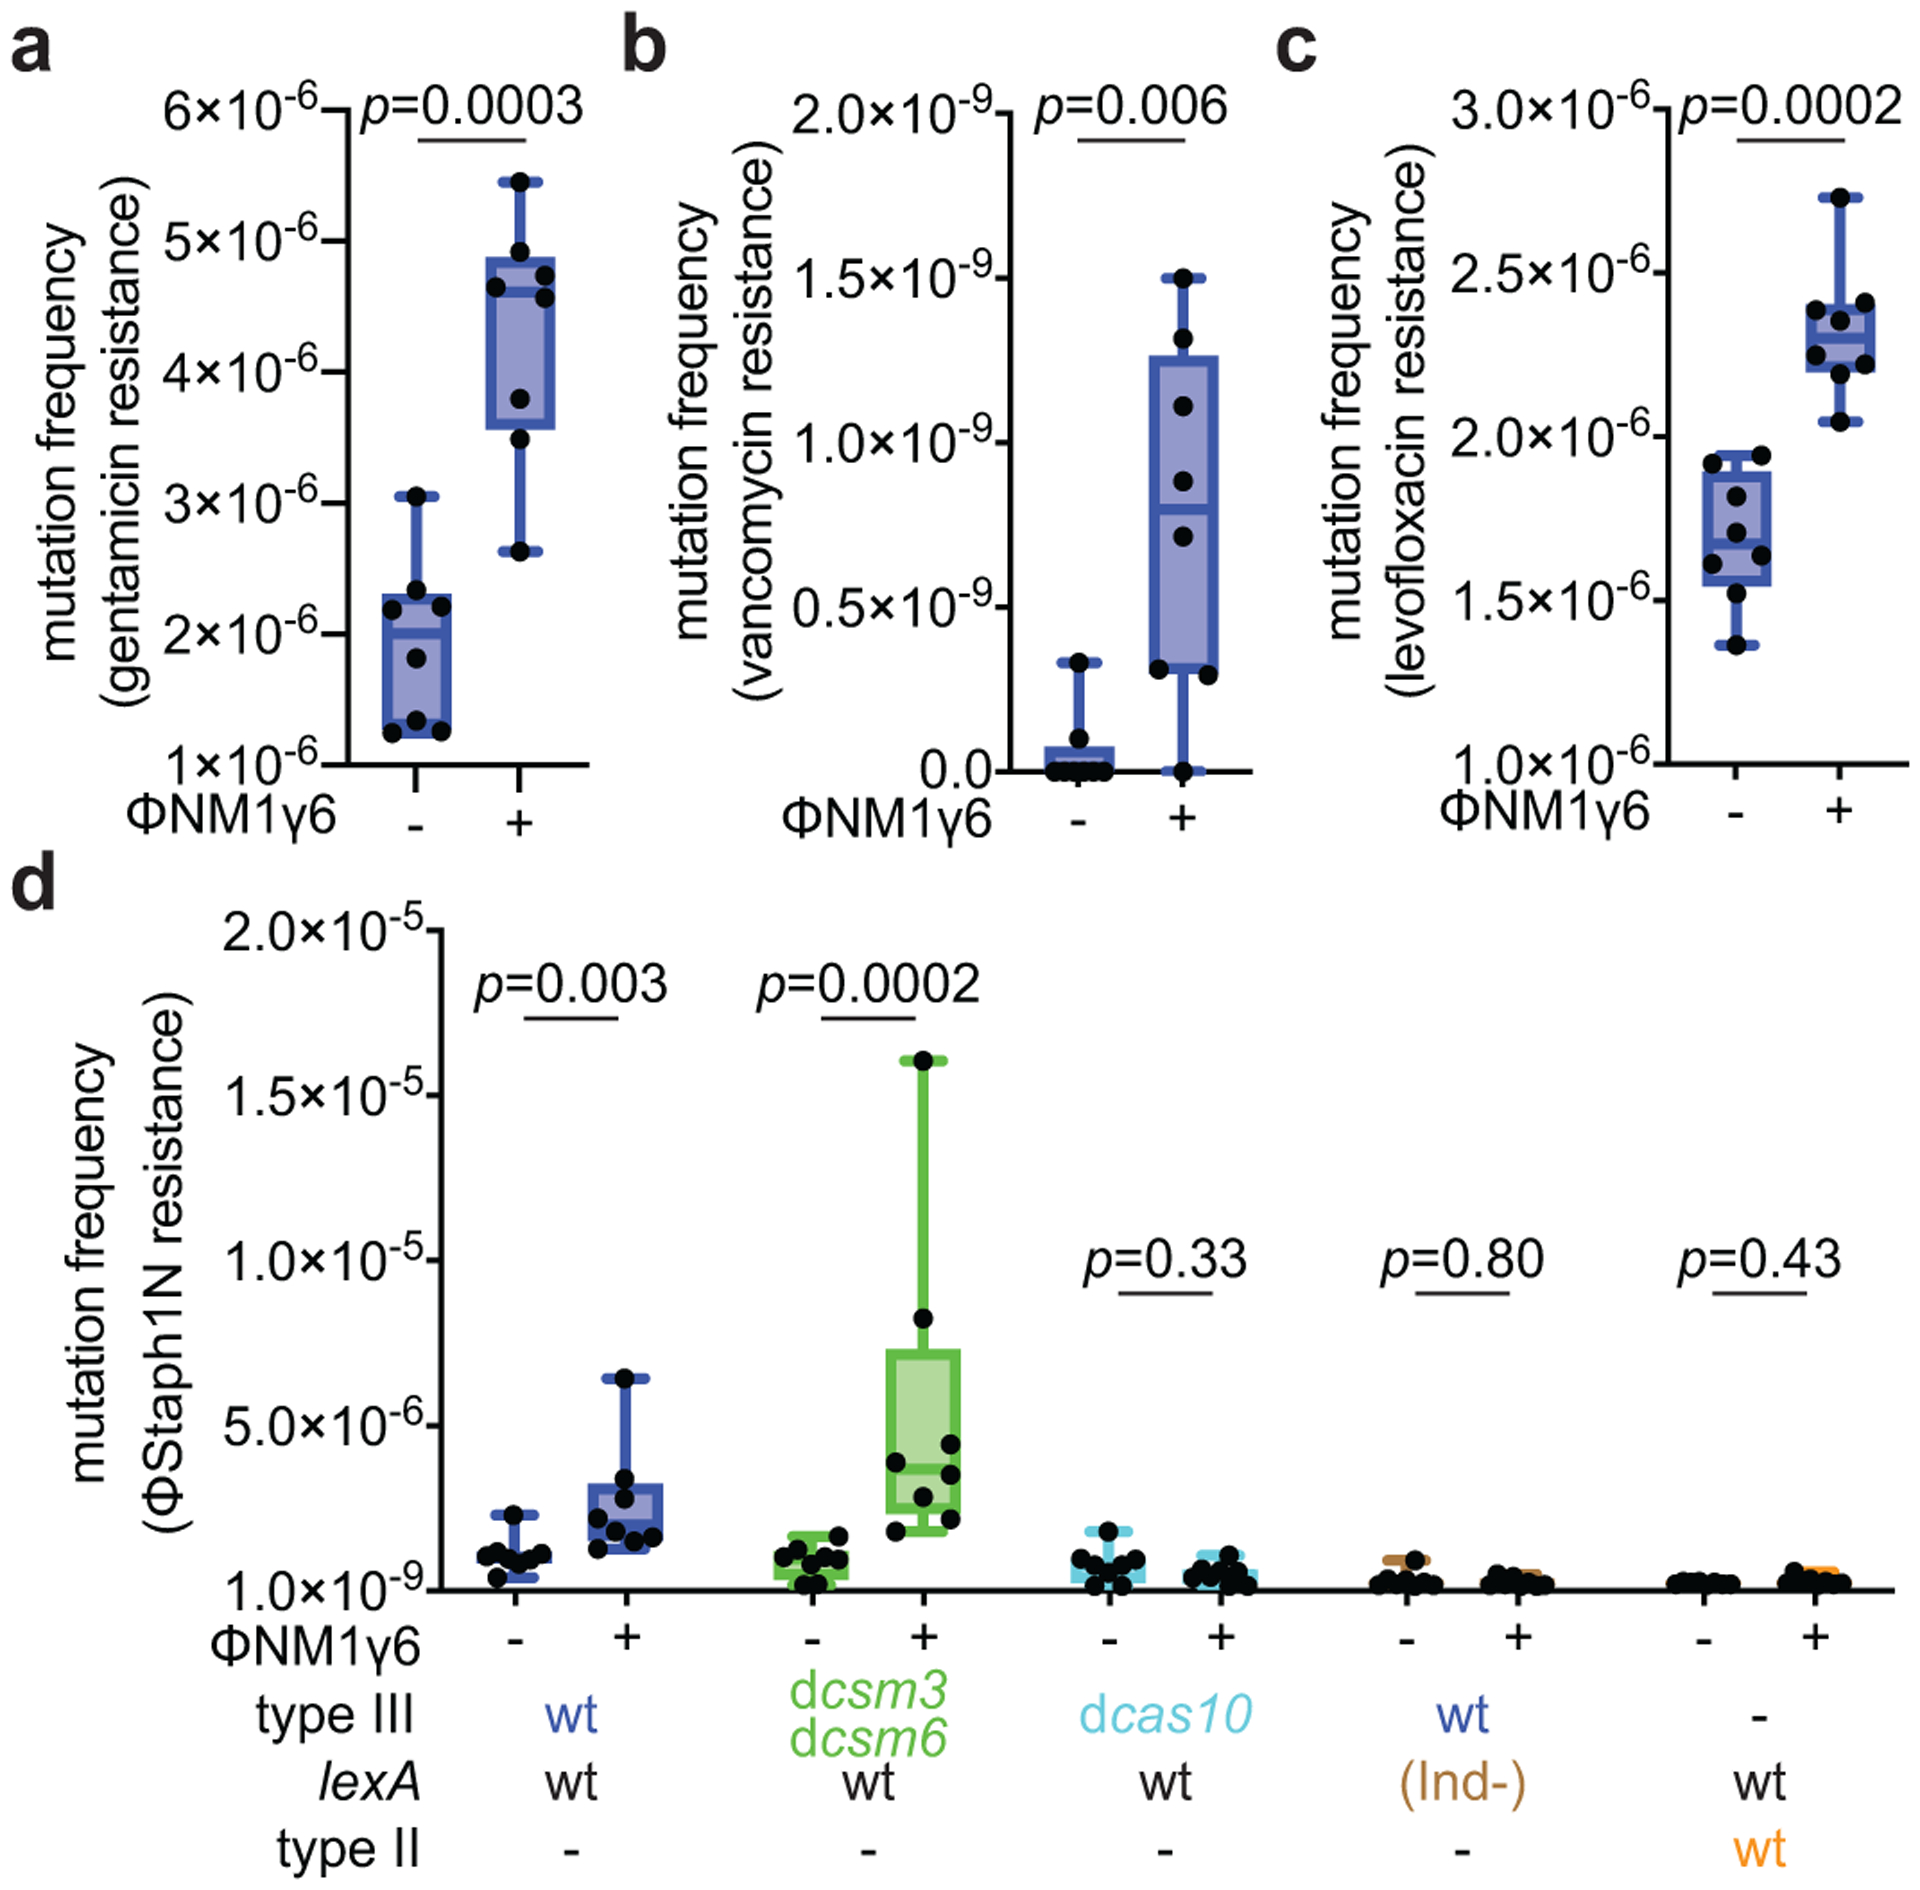
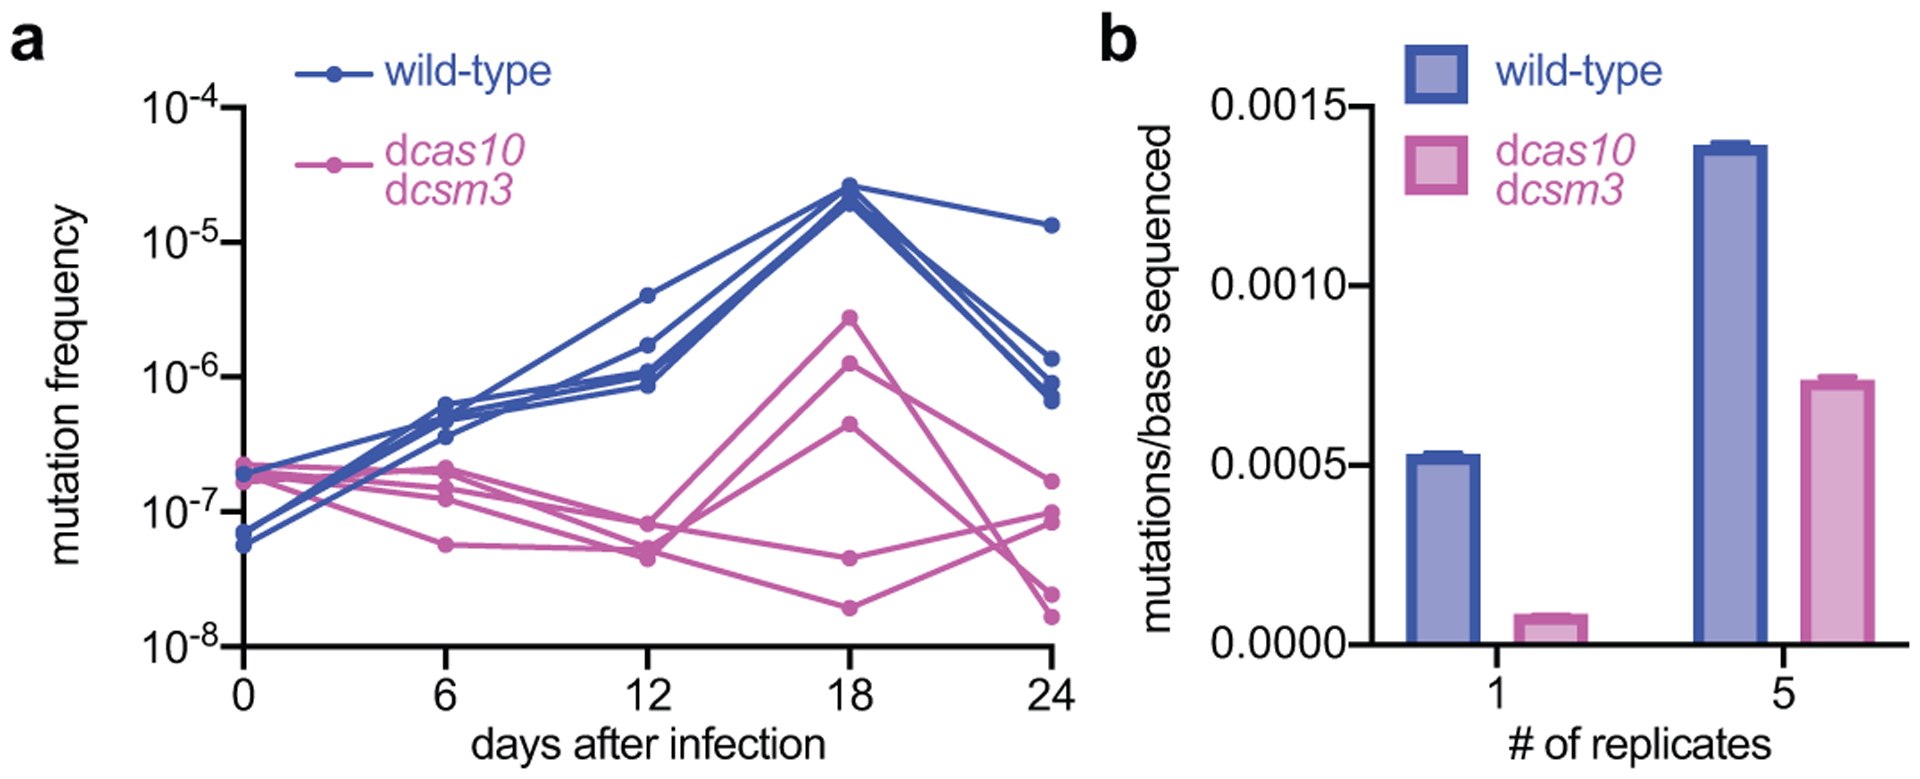
Horizontal gene transfer and mutation are the two major drivers of microbial evolution that enable bacteria to adapt to fluctuating environmental stressors1. Clustered, regularly interspaced, short palindromic repeats (CRISPR) systems use RNA-guided nucleases to direct sequence-specific destruction of the genomes of mobile genetic elements that mediate horizontal gene transfer, such as conjugative plasmids2 and bacteriophages3, thus limiting the extent to which bacteria can evolve by this mechanism. A subset of CRISPR systems also exhibit non-specific degradation of DNA4,5; however, whether and how this feature affects the host has not yet been examined. Here we show that the non-specific DNase activity of the staphylococcal type III-A CRISPR-Cas system increases mutations in the host and accelerates the generation of antibiotic resistance in Staphylococcus aureus and Staphylococcus epidermidis. These mutations require the induction of the SOS response to DNA damage and display a distinct pattern. Our results demonstrate that by differentially affecting both mechanisms that generate genetic diversity, type III-A CRISPR systems can modulate the evolution of the bacterial host.


Conflict of interest statement

Competing interests: L.A.M. is a cofounder and Scientific Advisory Board member of Intellia Therapeutics, and a co-founder of Eligo Biosciences.

Figures

Extended Data Figure 1.
Extended Data Figure 1.. Type III-A CRISPR-Cas immunity against the pG0400 conjugative plasmid and the ϕNM1γ6 phage increases the mutation frequency and rate of the staphylococcal host.
(a) Schematic of the S. epidermidis RP62a type III-A locus showing the mutants analyzed in this study. The CRISPR array shows repeats as black boxes and spacers as colored, numbered boxes. (b) Current model of the type III-A CRISPR-Cas immune response. A Cas10 complex, composed of Cas10, Csm2–5 (in different shades of green) is loaded with a crRNA guide after processing of the transcript of the CRISPR array by Cas6 (not shown). The crRNA guide is used to direct the Cas10 complex to a complementary transcript produced by the invader following infection. Target recognition triggers two activities of Cas10. The Palm domain catalyzes the conversion of ATP into a cyclic tetra- or hexa-adenosyl ring that serves as a second messenger that binds and activates Csm6, a non-specific RNase. Degradation of both cellular and invader transcripts by this nuclease generates the growth arrest of the host that is required for the clearance of plasmids and phages which targets that have mismatches with the crRNA guide or that are transcribed either weakly or late in the phage lytic cycle. In addition, the HD domain of Cas10 is activated, leading to the non-specific degradation of ssDNA. This activity is believed to be concentrated on the ssDNA generated at the invader’s transcription bubble or within R-loops such as those formed during transcription elongation by RNA polymerase. Finally, the Csm3/Cmr4 subunit of the Cas10 complex cleaves the target transcript, turning off both enzymatic activities of Cas10. In this study we show that the ssDNase activity of type III-A CRISPR-Cas immunity can also lead to an increase in the mutation frequency and rates of the host, presumably through degradation of other ssDNA regions of the host chromosome. (c) Calculation of p-values using two-sided Mann-Whitney test of the data presented in Figure 1b for the mutation frequency of wild-type S. epidermidis RP62a, without the two outlier data points in the “pG0400-wt” samples. Horizontal bars: median values; n(pG0400-wt)=14 biologically independent experiments; n(pG0400-mut, none)=16 biologically independent experiments. (d) S. aureus cells (~109) that were treated with ϕNM1γ6 phage and survived infection through the targeting of an early-expressed gene by the staphylococcal type II-A or type III-A CRISPR-Cas systems were seeded after 2 hours of outgrowth on plates with or without rifampicin to calculate their mutation frequency. Box limits, interquartile range; whiskers, minimum to maximum; centre line, median; dots, individual data points; n=15 biologically independent experiments; p-values obtained with two-sided Mann-Whitney test. (e) S. aureus cells (<1,000) that were treated with ϕNM1γ6 phage and survived infection through the targeting of an early-expressed gene (gp12 or gp14) by the staphylococcal type II-A or type III-A CRISPR-Cas systems were seeded on plates with or without rifampicin to calculate their mutation frequency. Box limits, interquartile range; whiskers, minimum to maximum; centre line, median; dots, individual data points; n=15 biologically independent experiments; p-values obtained with two-sided Mann-Whitney test. (f) Calculation of the mutation rate using the data presented in (e). The bar graphs represent the mean; the error bars represent 95% confidence intervals. (g) S. aureus cells (<1,000) that were treated with ϕNM1γ6 phage and survived infection through the targeting of a late-expressed gene (gp43) employing type III-A CRISPR-Cas immunity, were seeded on plates with or without rifampicin to calculate their mutation frequency. Box limits, interquartile range; whiskers, minimum to maximum; centre line, median; dots, individual data points; n=15 biologically independent experiments; p-values obtained with two-sided Mann-Whitney test. (h) Calculation of the mutation rate using the data presented in (g). The bar graphs represent the mean; the error bars represent 95% confidence intervals.
Extended Data Figure 2.
Extended Data Figure 2.. Mutagenesis mediated by type III-A CRISPR-Cas immunity against phage infection.
(a) Serial ten-fold dilutions of ϕNM1γ6 phage were spotted on plates seeded with different strains of staphylococci expressing a gp14- or gp43-targeting S. epidermidis type III-A systems with different mutations, wild-type or (Ind-) LexA, or the gp12-targeting S. aureus type II-A system. Plaque-forming units (PFU) were enumerated; mean ±s.e.m.; n=4 (non-targeting control) or n=6 (type II-A CRISPR immunity) biologically independent experiments. In cases where plaques were not readily visible, the limit of detection of three biologically independent experiments was reported. (b) S. aureus cells (<1,000) that were treated with ϕNM1γ6 phage and survived infection through the targeting of an early-expressed gene (gp14) by different mutant versions of the type III-A CRISPR-Cas system, in the presence of an active (wild-type, wt) or inactive (lexA(Ind-)) SOS response, were seeded on plates with or without rifampicin to calculate their mutation frequency. Box limits, interquartile range; whiskers, minimum to maximum; centre line, mesdian; dots, individual data points; n=15 biologically independent experiments; p-values obtained with two-sided Mann-Whitney test. (c) Calculation of the mutation rate using the data presented in (b). The bar graphs represent the mean; the error bars represent 95% confidence intervals. (d) S. aureus cells (~109) that were treated with ϕNM1γ6 phage and survived infection through the targeting of a late-expressed gene (gp43) by either a wild-type or a dcas10 type III-A CRISPR-Cas system, were seeded on plates with or without rifampicin to calculate their mutation frequency. Box limits, interquartile range; whiskers, minimum to maximum; centre line, median; dots, individual data points; n=15 biologically independent experiments; p-values obtained with two-sided Mann-Whitney test.
Extended Data Figure 3.
Extended Data Figure 3.. Type III-A CRISPR-Cas immunity against plasmids carrying inducible targets.
(a) S. aureus TB4 strains were transformed with pCRISPR plasmids carrying the dcsm3/dcsm6 or the dcas10/dcsm3/dcsm6 mutations in the type III-A CRISPR-Cas locus. Strains were then transformed with a plasmid expressing an inducible transcript with a target (pTarget, upper gels) or non-target (pControl, lower gels) sequence. Cultures were induced with anhydrotetracycline and samples were collected at the indicated time points. Plasmids were extracted, linearized by restriction digestion, separated and visualized with agarose gel electrophoresis. Performed once. “M”, molecular weight marker. (b) Calculation of the mutation rate of the data presented in Figure 3b. The bar graphs represent the mean; the error bars represent 95% confidence intervals. (c) Calculation of the mutation rate of S. epidermidis RP62a, wild-type and ΔCRISPR mutant. The bar graphs represent the mean; the error bars represent 95% confidence intervals; n=10 biologically independent experiments.
Extended Data Figure 4.
Extended Data Figure 4.. Abrogation of SOS induction in the lexA(Ind-) mutant.
(a) A mutation in lexA that prevents its self-cleavage and the induction of the SOS response, K156A, was previously identified in Escherichia coli. Alignment with the LexA sequence of S. aureus identified K168 as the homologous residue, which was mutated in S. aureus TB4 to alanine to generate strain JAV6. (b) Strains TB4 and JAV6 were transformed with an SOS reporter plasmid, pAV22, carrying the GFP ORF downstream of the promoter for the 4-oxalocrotonate tautomerase gene. This promoter is activated after LexA self-cleavage when the SOS response is induced with mitomycin C (MMC). Each strain was either treated or not with MMC and both the growth (OD600) and green fluorescence (arbitrary units, A.U.) were measured over time, to report the fluorescence/growth ratio. (c) qPCR of the SOS-induced polV transcript after infection (with ϕNM1γ6) of cells carrying a wild-type type III-A system in either wild-type or lexA(Ind-) hosts, as well as carrying the dcas10 mutation. RNA was collected when the cultures reached OD600 0.15 (exponential growth phase), after infection at MOI 10, and used for qPCR, using the housekeeping gene rho as an internal reference for each sample. Mean of three independent biological replicates ± s.d. are reported. p-values obtained with two-sided t-test.
Extended Data Figure 5.
Extended Data Figure 5.. Distribution of rpoB mutations detected via next-generation sequencing.
DNA from ϕNM1γ6- or rifampicin-resistant staphylococci with different genetic backgrounds was extracted and subjected to NGS. Mutations that localized to either of the two clusters known to contain amino acid substitutions that confer rifampicin resistance (cluster I: Gly462 – Gly489; cluster II: Pro515 – Leu530) were counted. The % of the total mutations in these clusters is shown for different nucleotides within codons. Different data markers indicate were used to indicate different mutations. Numerical values of data points are provided in Supplementary Data File 2.
Extended Data Figure 6.
Extended Data Figure 6.. Mutagenesis mediated by type III-A CRISPR-Cas immunity increases resistance to gentamicin but not fusidic acid.
(a) S. aureus cells (<1,000) that were treated with ϕNM1γ6 phage and survived infection through the targeting of an early-expressed gene (gp14) by the type III-A CRISPR-Cas system, were seeded on plates with or without gentamicin to calculate their mutation frequency. Box limits, interquartile range; whiskers, minimum to maximum; centre line, median; dots, individual data points; n=15 biologically independent experiments; p-values obtained with two-sided Mann-Whitney test. (b) Calculation of the mutation rate using the data presented in in panel (a). The bar graphs represent the mean; the error bars represent 95% confidence intervals.
Extended Data Figure 7.
Extended Data Figure 7.. Type III-A CRISPR-Cas immunity against ϕStaph1N phage.
(a) Serial ten-fold dilutions of ϕStaph1N phage were spotted on plates seeded with different strains of staphylococci expressing a gp14-targeting S. epidermidis type III-A system with different mutations, wild-type or (Ind-) LexA, or the S. aureus type II-A system. (b) PCR amplification of the CRISPR arrays of the wild-type pCRISPR plasmid isolated from 16 individual colonies resistant to ϕStaph1N phage that were previously exposed to or not treated with ϕNM1γ6 phage. Molecular markers (in kilobases) are shown on the left; the PCR product of the non-expanded CRISPR array is marked by the arrowhead.
Extended Data Figure 8.
Extended Data Figure 8.. Distribution of mutations generated during the type III-A CRISPR-Cas immune response against ϕNM1γ6 phage.
(a) Colony forming units per microliter (CFU/μL) of wild-type and dcas10/dcsm3 cultures after 6, 12, 18 and 24 daily infections with ϕNM1γ6 phage. Bar graphs represent the mean CFU/μL; individual black dots represent the individual values from the 5 independent cultures. (b) Distribution of mutations in the S. aureus TB4 genome of wild-type and dcas10/dcsm3 cells infected daily with ϕNM1γ6 phage after 18 days. Genomic DNA from the cultures was labeled with unique molecular barcodes in order to reduce sequencing errors, subjected to next-generation sequencing and analyzed with the appropriate software for this procedure (https://github.com/Kennedy-Lab-UW/Duplex-Sequencing). Mutations were counted if a particular genomic position possess a minimal depth of 10 reads. The x-axis represents the position within the S. aureus TB4 genome, while the y-axis represents the number of mutations divided by the sequencing depth at that particular position. Replicate 1 shows the data collected from a single wild-type or dcas10/dcsm3 culture, while replicate 2 shows data from the pooled five cultures of each strain. Based on this analysis, the samples do not show an obvious mutational hot spot in the genome. (c) Distance, in base pairs (bp), between adjacent mutations in the S. aureus TB4 genome, calculated from the data obtained in panel (b).
Extended Data Figure 9.
Extended Data Figure 9.. Effects of type III-A CRISPR-Cas immunity on self and non-self DNA.
During type III-A CRISPR-Cas immunity the ssDNase activity of Cas10 (HD domain) is activated by the recognition of a target transcript produced by the invading phage or plasmid. On one hand, destruction of foreign DNA by this activity provides immunity and restricts evolution through horizontal gene transfer. On the other hand, non-specific ssDNA degradation can also damage the host chromosome, leading to the induction of the SOS response and error-prone repair, facilitating evolution through mutagenesis.
Figure 1.
Figure 1.. Type III-A CRISPR-Cas immunity increases mutagenesis in staphylococci.
(a) Conjugation efficiency of wild-type or mutant pG0400 into S. epidermidis RP62a or ΔCRISPR. (b) Mating cultures were seeded on plates with or without rifampicin to calculate their mutation frequency. (c) Serial ten-fold dilutions of ϕNM1γ6 phage on plates seeded with staphylococci harboring type II-A or III-A CRISPR-Cas systems. (d) S. aureus cells (~109) that were treated with ϕNM1γ6 phage and survived infection through the targeting of an early-expressed gene (gp12 or gp14) by the staphylococcal type II-A or type III-A CRISPR-Cas systems were seeded on plates with or without rifampicin to calculate their mutation frequency. (a, b, d) Box limits, interquartile range; whiskers, minimum to maximum; centre line, median; dots, individual data points; n=16,16,15, respectively, biologically independent experiments; p-values obtained with two-sided Mann-Whitney test.
Figure 2.
Figure 2.. Mutagenesis requires induction of Cas10 ssDNase activity and the SOS response.
(a) S. aureus cells (~109) that were treated with ϕNM1γ6 phage and survived infection through the targeting of an early-expressed gene (gp14) by different mutant versions of the type III-A CRISPR-Cas system, in the presence of an active (wild-type, wt) or inactive (lexA(Ind-)) SOS response, were seeded on plates with or without rifampicin to calculate their mutation frequency. (b) S. aureus cells (<1,000) carrying a plasmid with or without an inducible target for the type III-A CRISPR-Cas system were treated with aTc for 48 hours and then seeded on plates with or without rifampicin to calculate their mutation frequency. (a, b) Box limits, interquartile range; whiskers, minimum to maximum; centre line, median; dots, individual data points; n=15,10, respectively, biologically independent experiments; p-values obtained with two-sided Mann-Whitney test. (c) Quantification of transversion and transition mutations in the rpoB gene of rifampicin-resistant staphylococci obtained in (a). Mean ±s.e.m.; n=3 biologically independent experiments; p-values obtained with two-sided t-test.
Figure 3.
Figure 3.. Mutagenesis increases resistance to different classes of antibiotics and phages.
(a) S. aureus cells (~109) that were treated with ϕNM1γ6 phage and survived infection through the targeting of an early-expressed gene (gp14) by the type III-A CRISPR-Cas system, were seeded on plates with or without gentamicin to calculate their mutation frequency. (b) Same as (a) but seeding on plates with vancomycin. (c) Same as (a) but seeding on plates with levofloxacin. (d) Same as (a) but mixing surviving staphylococci with top agar with or without ϕStaph1N phage to calculate their resistance frequency. (a-d) Box limits, interquartile range; whiskers, minimum to maximum; centre line, median; dots, individual data points; n=8 biologically independent experiments; p-values obtained with two-sided Mann-Whitney test.
Figure 4.
Figure 4.. Induction of mutagenesis by the type III-A CRISPR-Cas system over longer time frames.
(a) Staphylococci harboring either wild-type or dcas10/dcsm3 type III-A CRISPR-Cas systems programmed to target the early-expressed gene gp14 in ϕNM1γ6 phage were exposed daily to the phage (MOI 1) over 24 days and the rifampicin mutation frequency was calculated every six days. Five independent cultures of each strain were passaged. (b) Genomic DNA extracted from the cultures obtained after the 18th passage were analyzed with next-generation sequencing to determine the mutations per base. “1” shows the results for a single replicate culture; “5” for the pool of the five replicates. The bar graphs represent the mean number of mutations per bases sequenced and the error bars represent 95% confidence intervals.

References

    1. Polz MF, Alm EJ & Hanage WP Horizontal gene transfer and the evolution of bacterial and archaeal population structure. Trends Genet. 29, 170–175. - PMC - PubMed
    1. Marraffini LA & Sontheimer EJ CRISPR interference limits horizontal gene transfer in staphylococci by targeting DNA. Science 322, 1843–1845. - PMC - PubMed
    1. Barrangou R et al. CRISPR provides acquired resistance against viruses in prokaryotes. Science 315, 1709–1712. - PubMed
    1. Chen JS et al. CRISPR-Cas12a target binding unleashes indiscriminate single-stranded DNase activity. Science 360, 436–439. - PMC - PubMed
    1. Kazlauskiene M, Tamulaitis G, Kostiuk G, Venclovas C & Siksnys V Spatiotemporal Control of Type III-A CRISPR-Cas Immunity: Coupling DNA Degradation with the Target RNA Recognition. Mol. Cell 62, 295–306. - PubMed

Publication types

MeSH terms

LinkOut - more resources