. 2021 May;593(7858):282-288.
doi: 10.1038/s41586-021-03442-1. Epub 2021 Apr 7.

Cell-programmed nutrient partitioning in the tumour microenvironment

Affiliations

Cell-programmed nutrient partitioning in the tumour microenvironment

Bradley I Reinfeld et al. Nature. 2021 May.

Abstract

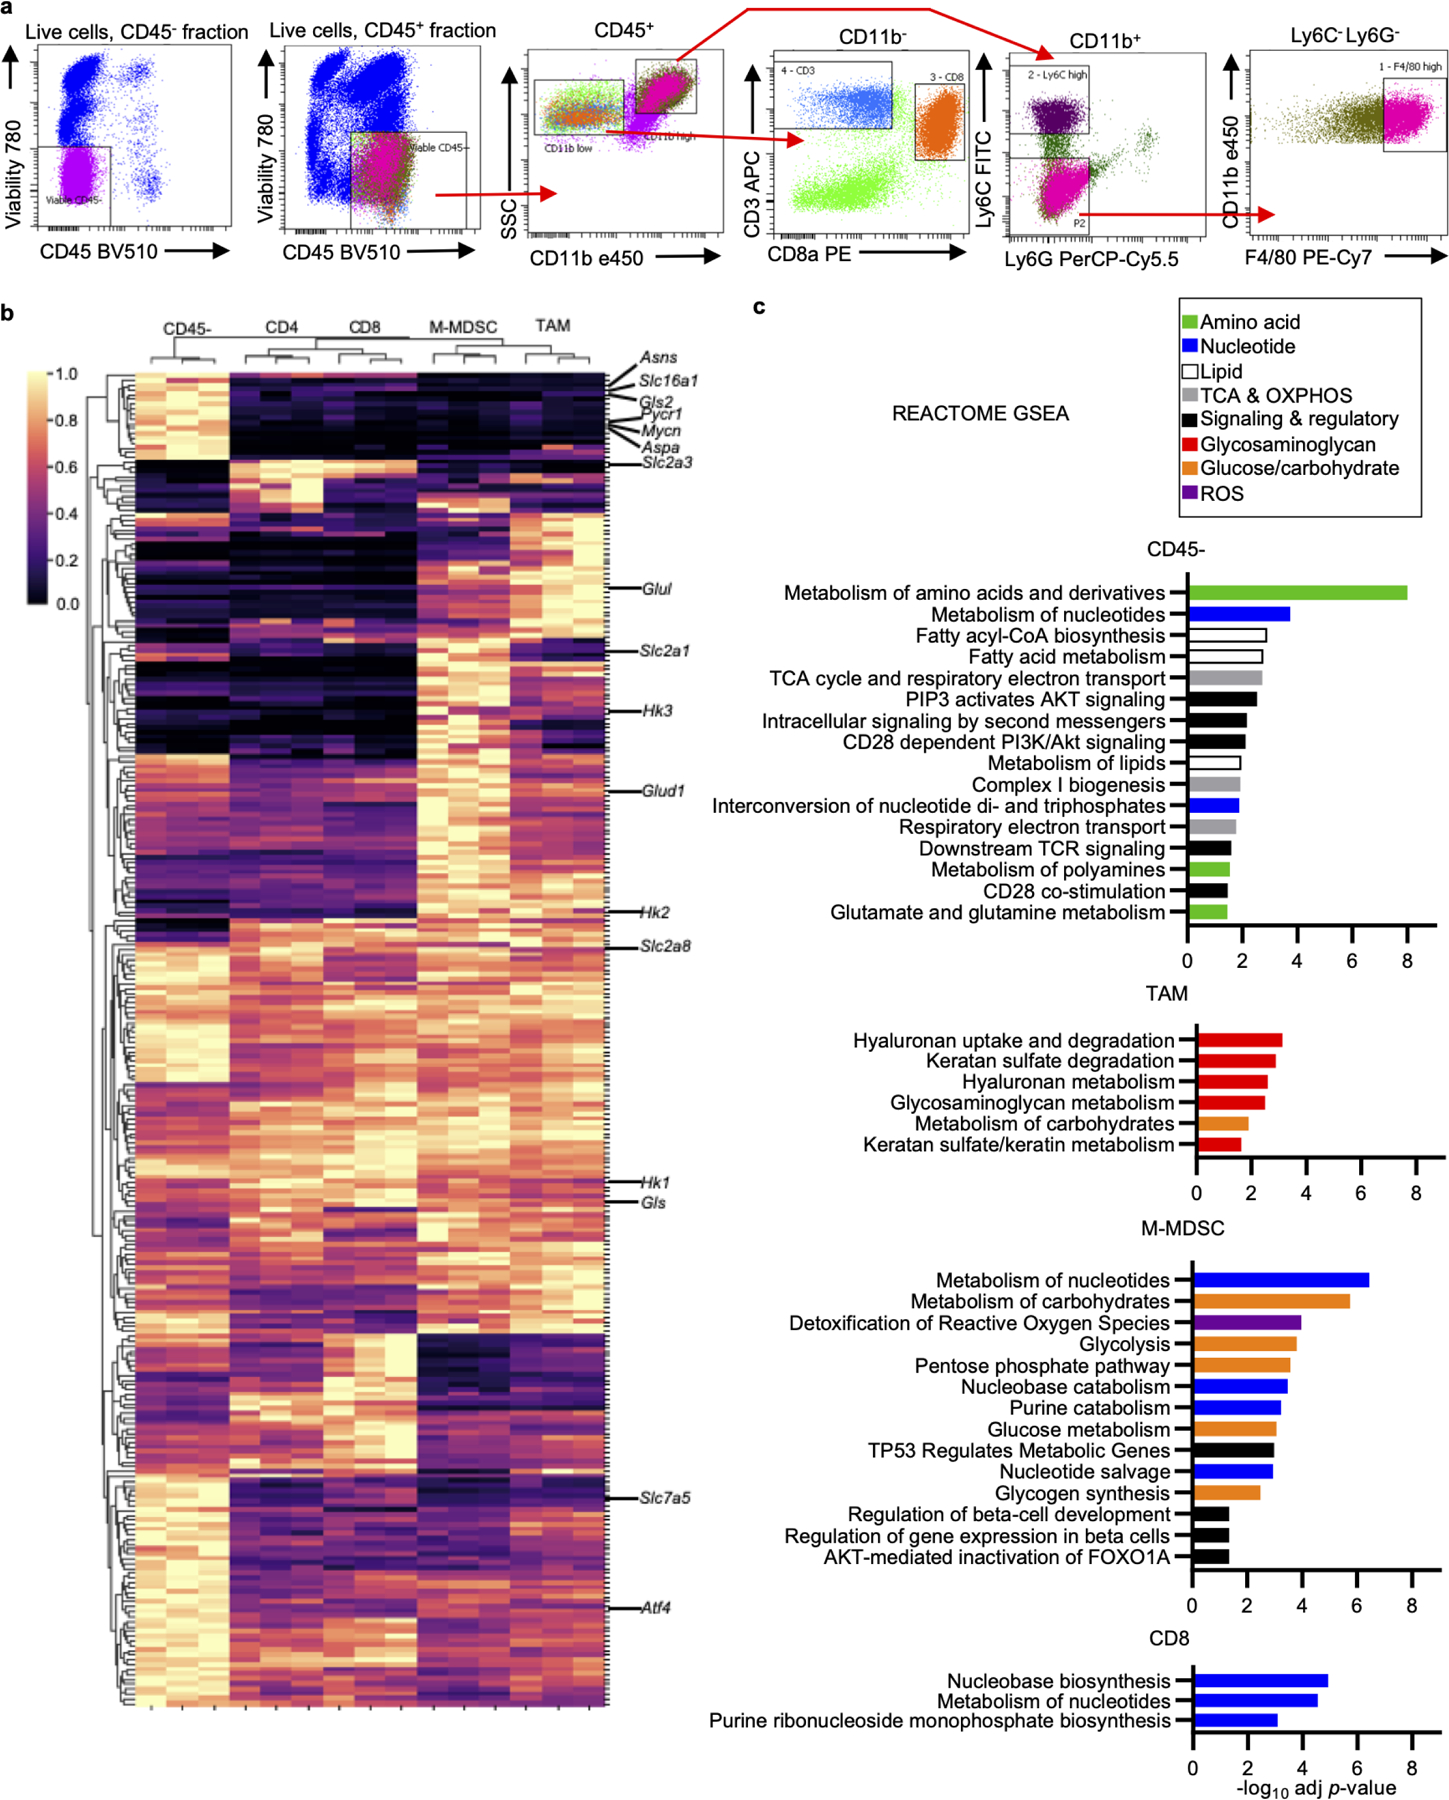
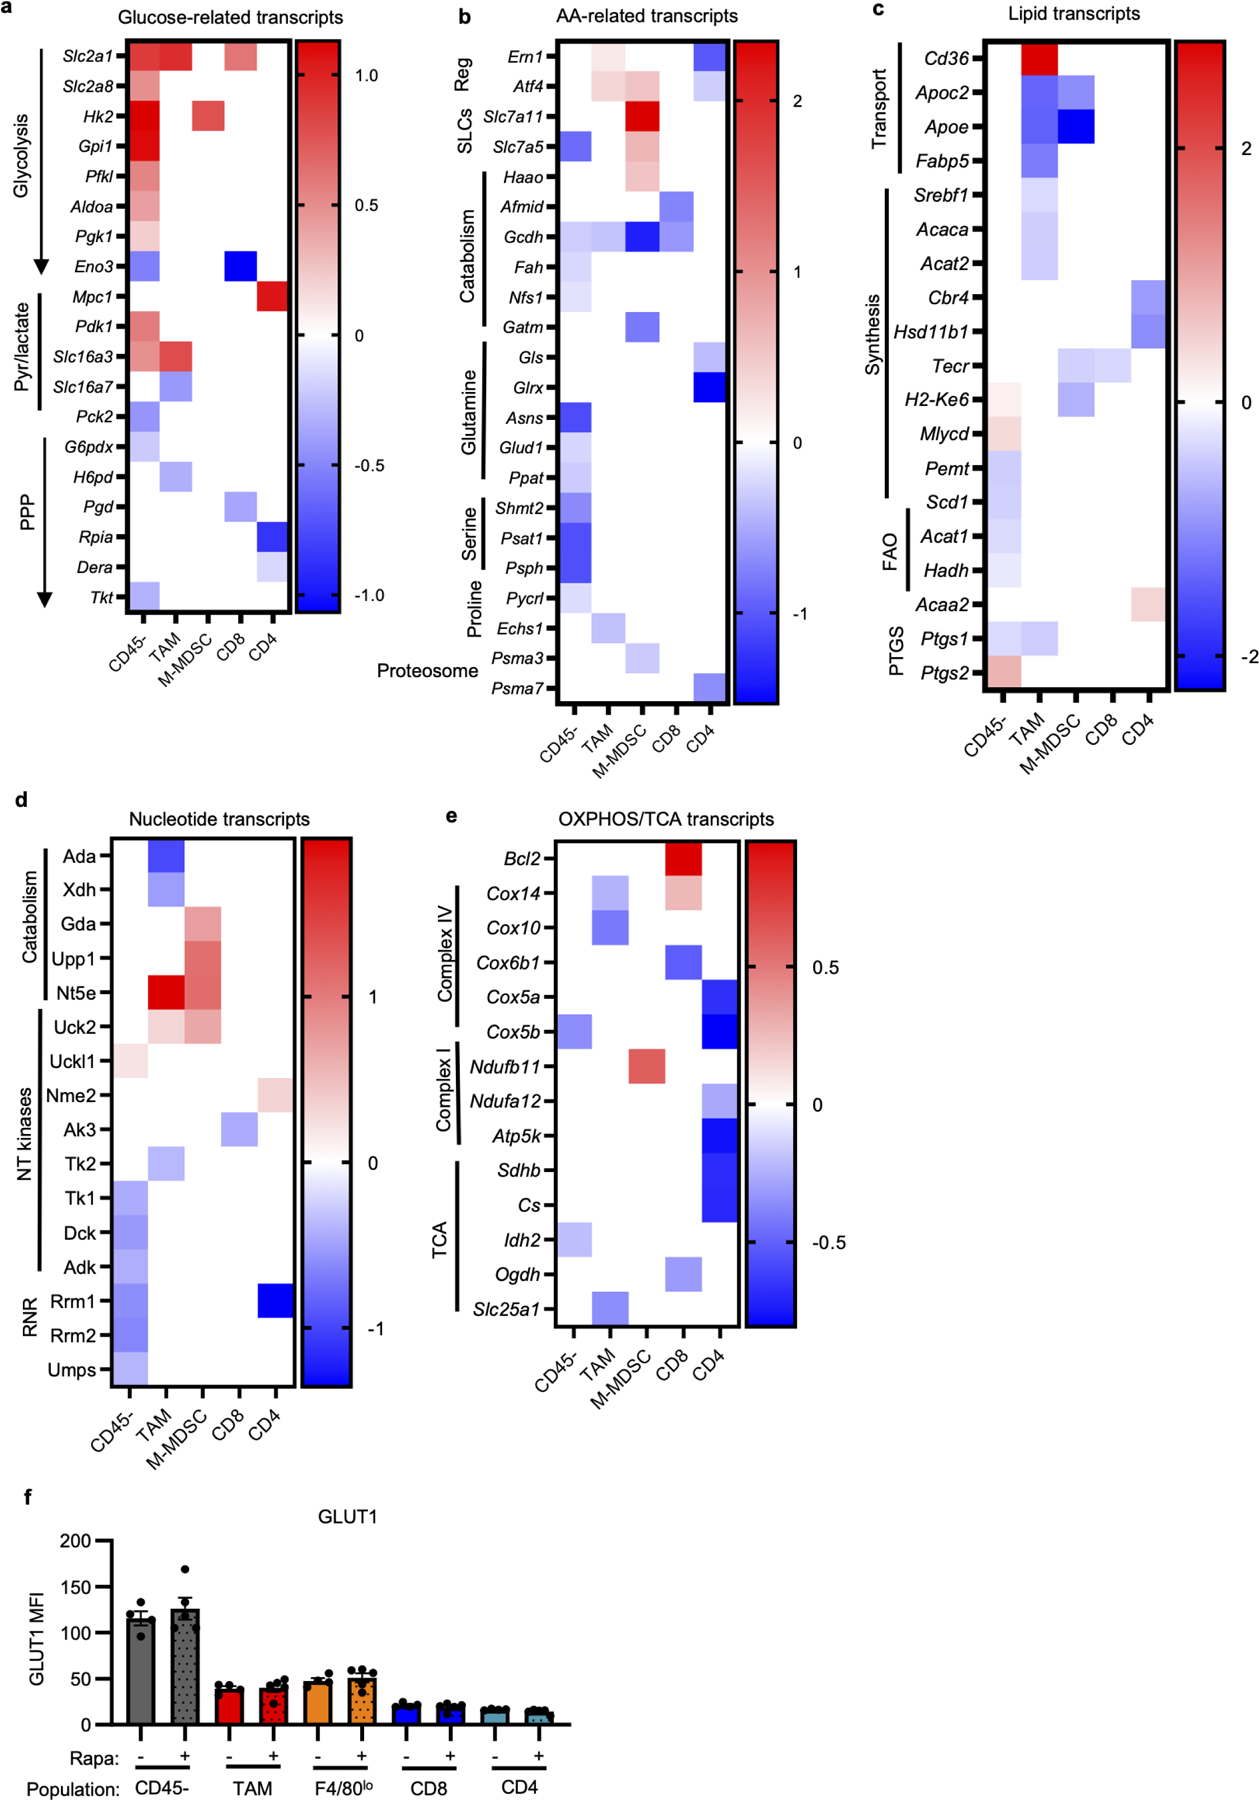
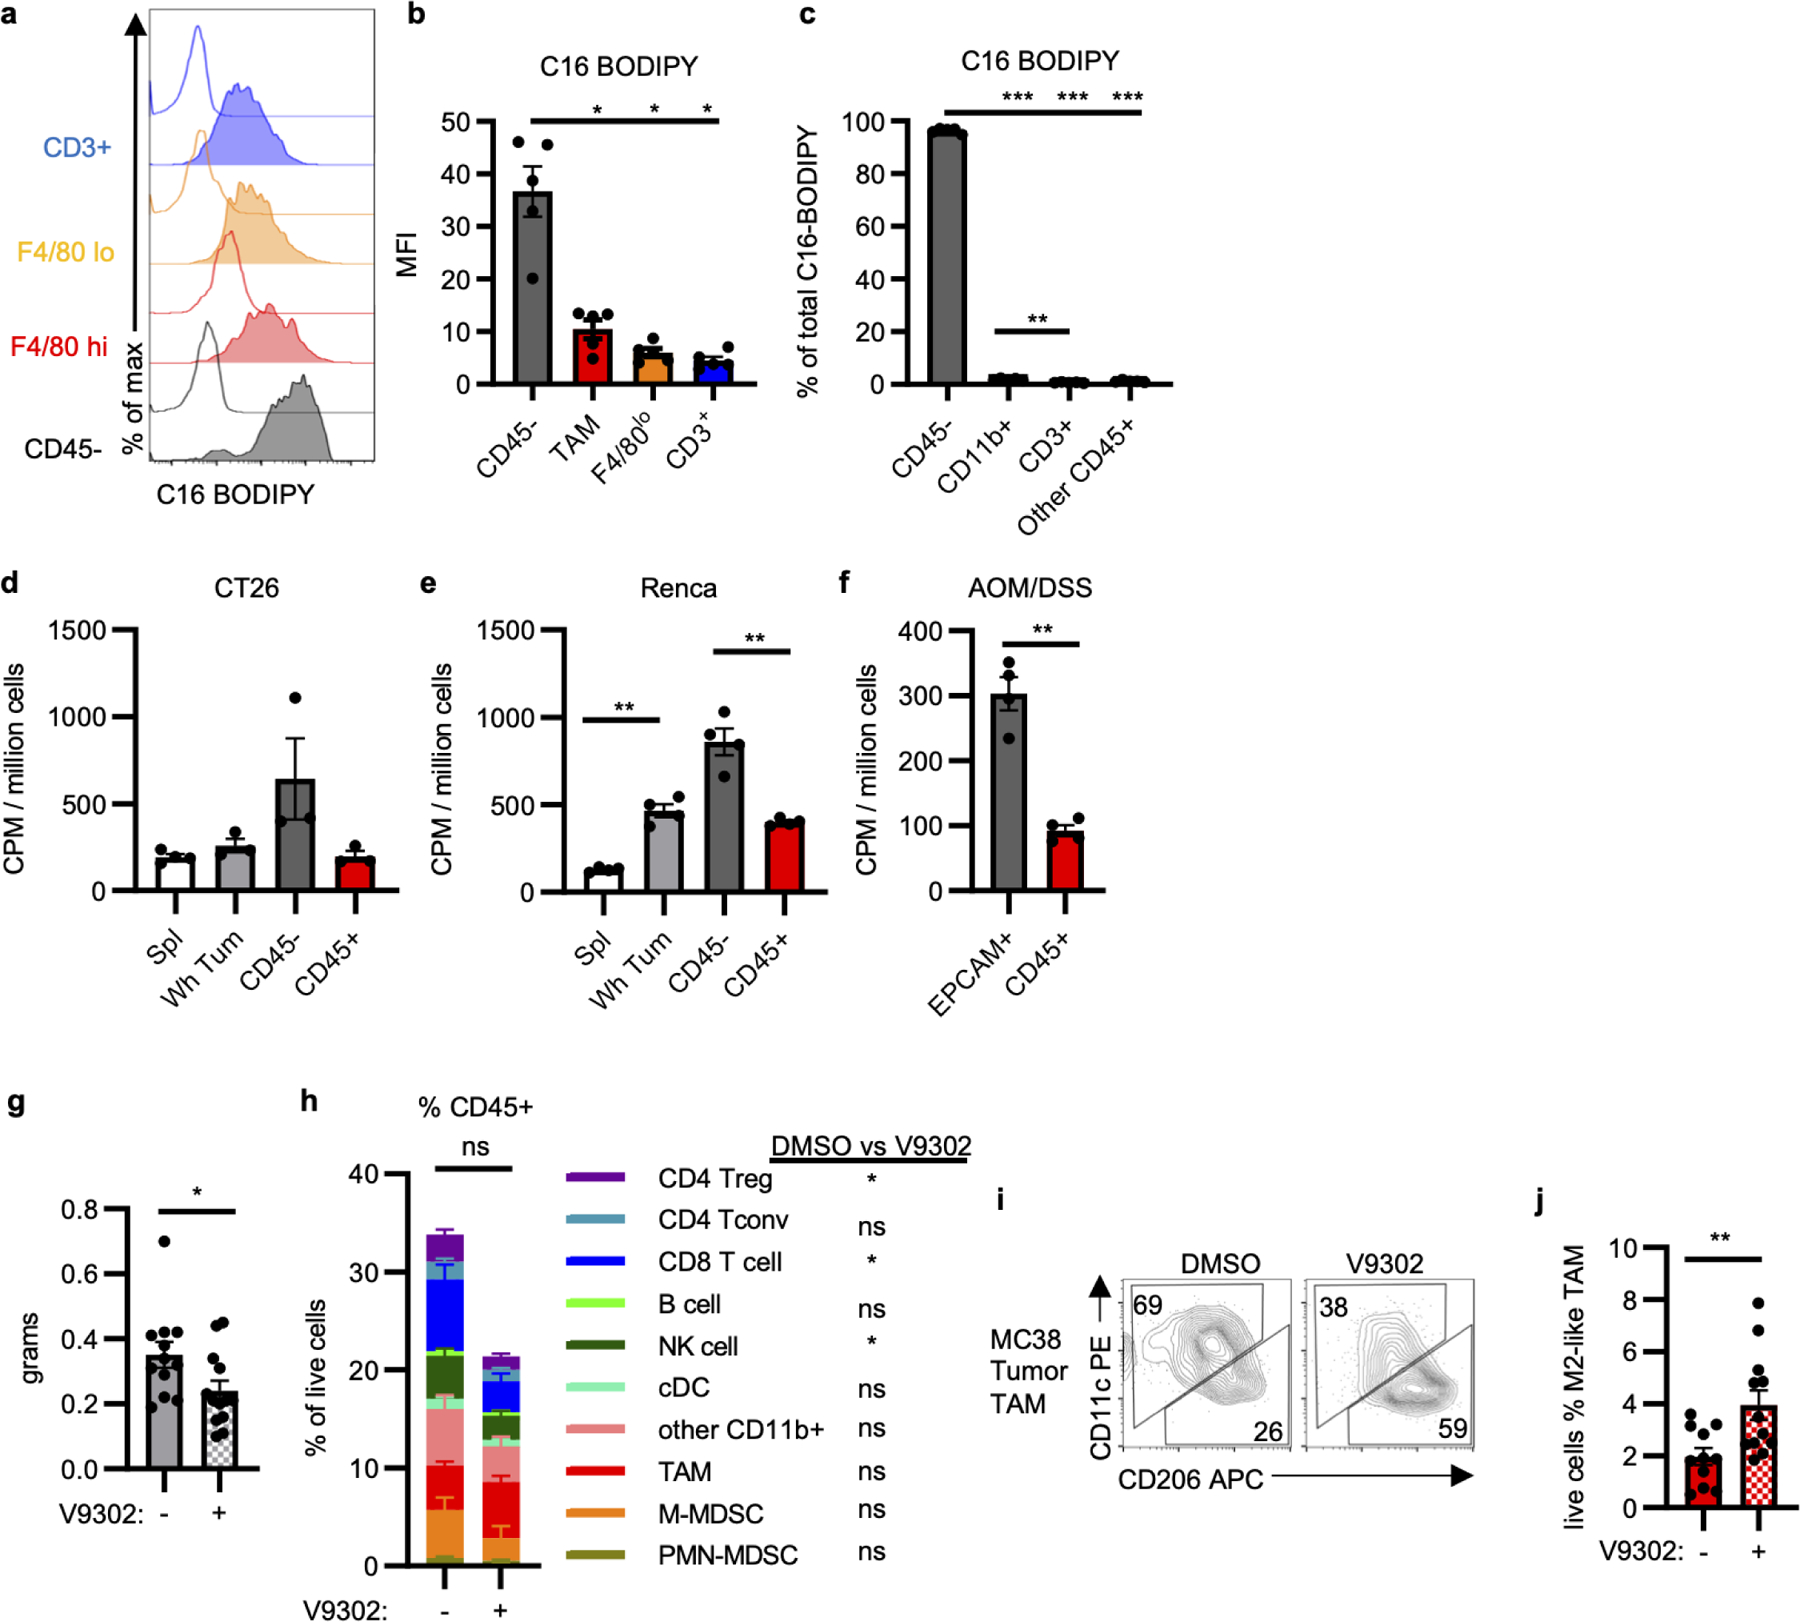
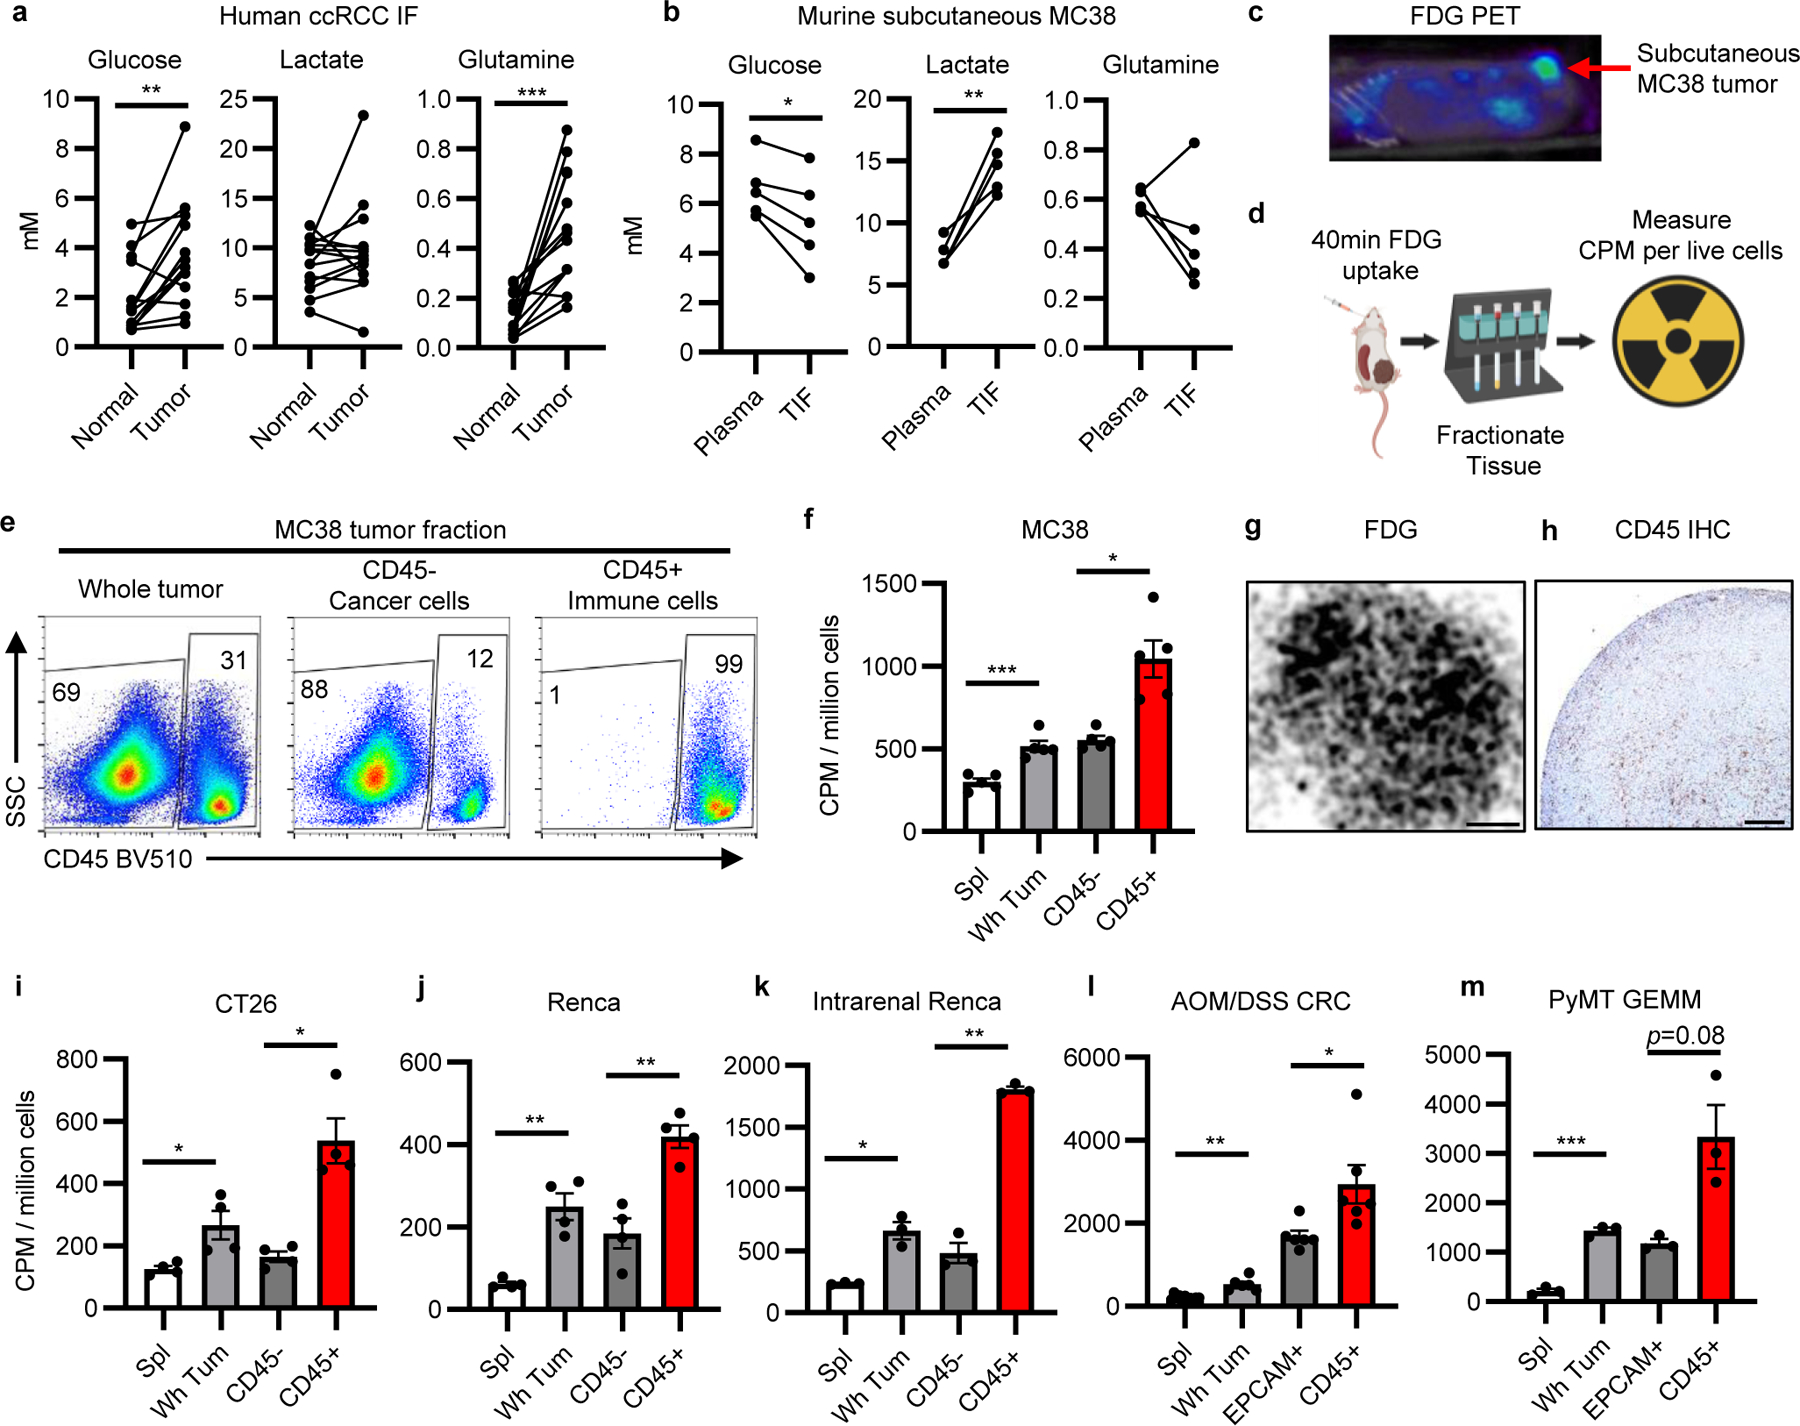
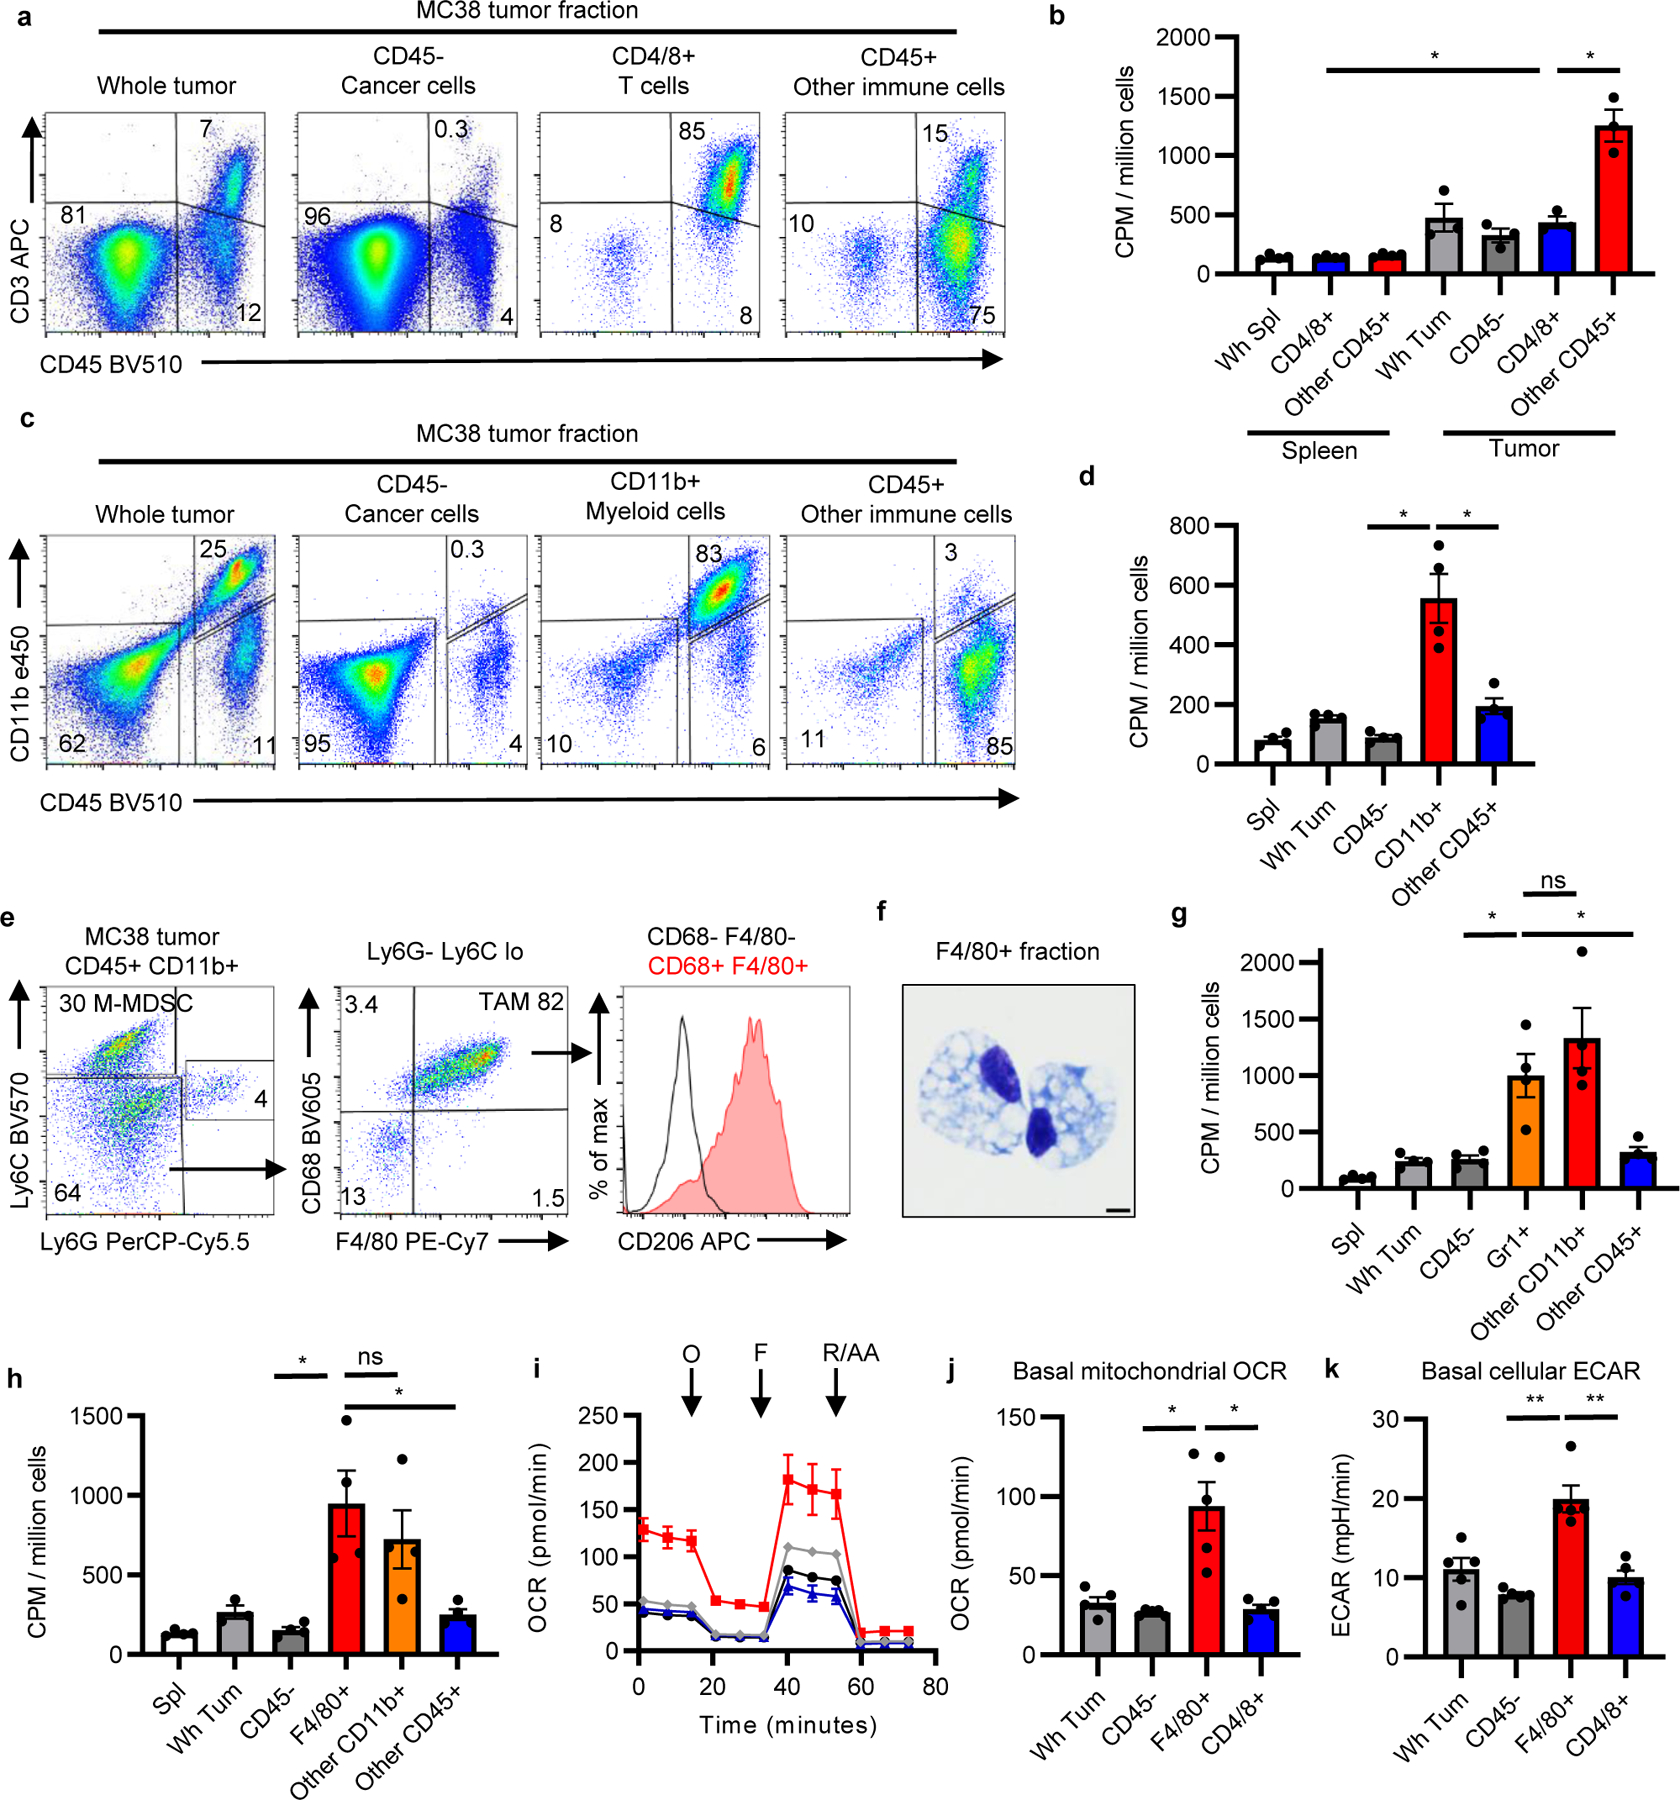
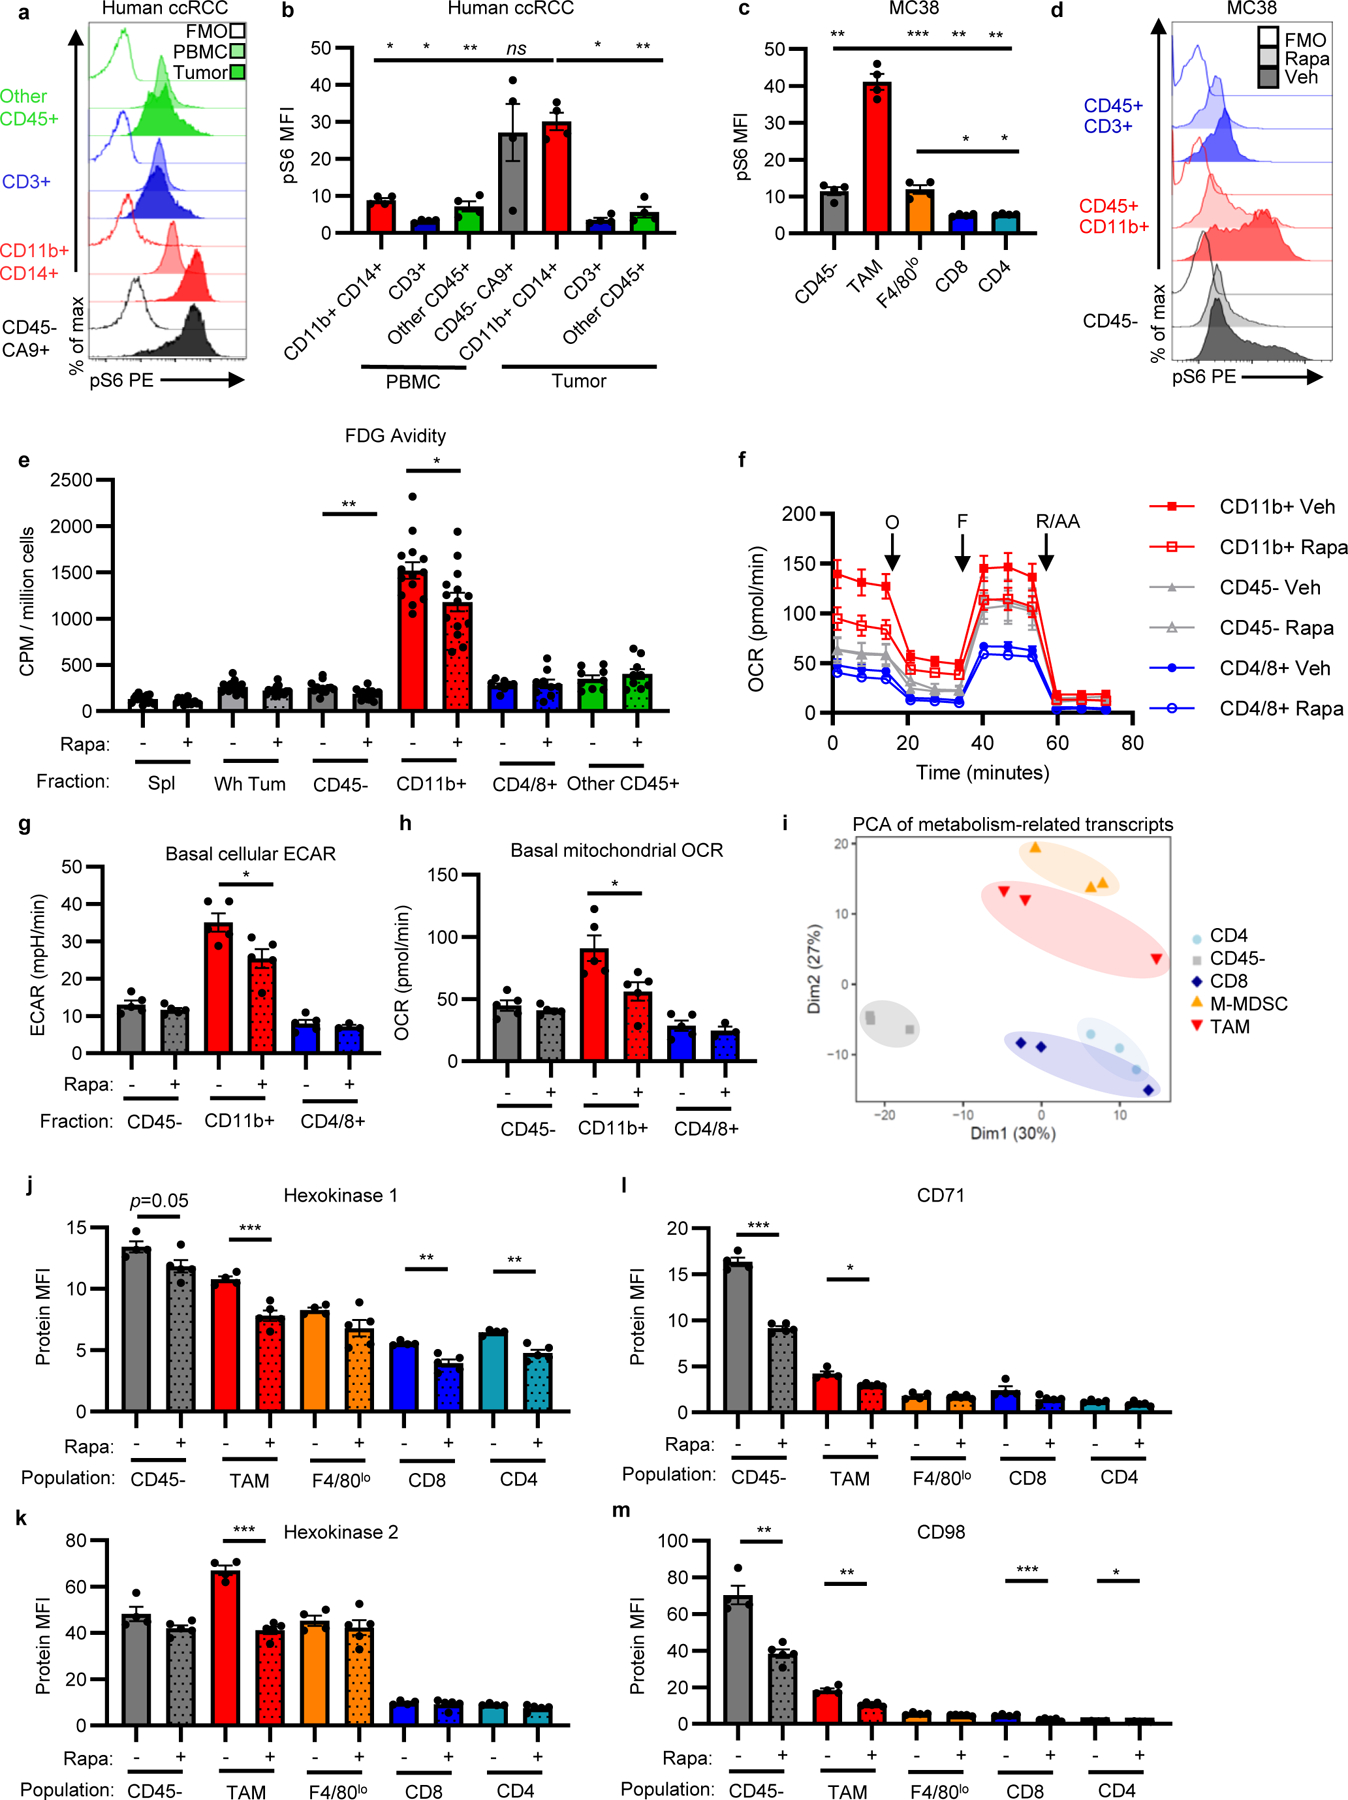
Cancer cells characteristically consume glucose through Warburg metabolism1, a process that forms the basis of tumour imaging by positron emission tomography (PET). Tumour-infiltrating immune cells also rely on glucose, and impaired immune cell metabolism in the tumour microenvironment (TME) contributes to immune evasion by tumour cells2-4. However, whether the metabolism of immune cells is dysregulated in the TME by cell-intrinsic programs or by competition with cancer cells for limited nutrients remains unclear. Here we used PET tracers to measure the access to and uptake of glucose and glutamine by specific cell subsets in the TME. Notably, myeloid cells had the greatest capacity to take up intratumoral glucose, followed by T cells and cancer cells, across a range of cancer models. By contrast, cancer cells showed the highest uptake of glutamine. This distinct nutrient partitioning was programmed in a cell-intrinsic manner through mTORC1 signalling and the expression of genes related to the metabolism of glucose and glutamine. Inhibiting glutamine uptake enhanced glucose uptake across tumour-resident cell types, showing that glutamine metabolism suppresses glucose uptake without glucose being a limiting factor in the TME. Thus, cell-intrinsic programs drive the preferential acquisition of glucose and glutamine by immune and cancer cells, respectively. Cell-selective partitioning of these nutrients could be exploited to develop therapies and imaging strategies to enhance or monitor the metabolic programs and activities of specific cell populations in the TME.


Figures

Extended Data Fig. 1 |
Extended Data Fig. 1 |. Supporting data for Fig. 1.
a-f, Fraction purity, viability, and yield for (a) MC38 (n=5 mice), (b) CT26 (n=4 mice), and (c) Renca (n=4 mice) subcutaneous tumors; (d) intrarenal Renca tumors (n=3 mice); (e) AOM/DSS-induced CRC tumors (n=6 for tumors, n=11 mice for spleens); and (f) spontaneous PyMT GEMM (n=3 mice) tumors. g, Representative flow cytometry analysis of PyMT and AOM/DSS CRC whole tumor, CD45+ immune cell, and EPCAM+ cancer cell fractions gated on live cells. Each data point represents a biological replicate and graphs show mean and SEM. Data are representative studies performed independently at least twice. AOM/DSS CRC: azoxymethane/dextran sodium sulfate-induced colorectal cancer; GEMM: genetically engineered mouse model; PyMT: polyoma virus middle T antigen.
Extended Data Fig. 2 |
Extended Data Fig. 2 |. Validation of in vivo cellular FDG uptake assay.
a, Intravenous (IV) anti-CD45 PE staining of leukocytes from designated tissues gated on live CD45+ cells. b, Demonstration of dynamic range of 18F quantification using serially diluted in vivo FDG-labelled splenocytes. c, Correlation plots of CPM/live cell versus cell viability, cells counted, and tumor mass across multiple tumor cell populations. Only “CD45” and “Other CD45+” simple linear regressions had slopes significantly different than 0 for tumor mass (n=10 mice). d, FDG-labelled digest supernatant from in vivo labelled MC38 tumors was applied to FDG-naïve MC38 tumor single cell suspensions to determine ex vivo background FDG uptake contribution to final signal. e, Cellular FDG avidity in designated ex vivo and in vivo labelled MC38 tumor cell populations (n=4 mice/group). f, Cellular FDG avidity in designated tumor cell fractions from MC38-Thy1.1 tumors (n=2 mice). g, Proportion of CD45+ and Thy1.1+ cells, cell viability, and live cell yield from MC38-Thy1.1 tumors (n=2 for tumors, n=5 mice for spleens). h, Representative flow cytometry analysis of MC38-Thy1.1 tumor fractions. Each data point represents a biological replicate and graphs show mean and SEM. (b, d-h) are data from a representative study performed independently at least twice. * p<0.05, ** p<0.01, *** p<0.001. Statistics are provided in source data. CPM: counts per minute.
Extended Data Fig. 3 |
Extended Data Fig. 3 |. In vivo 2NBDG uptake does not mirror FDG uptake.
a, Representative histograms of in vivo 2NBDG uptake in splenic and MC38 tumor cell subsets. b, MFI of in vivo 2NBDG uptake across spleen and MC38 tumor cells (n=3 mice). c-d, Representative histograms of in vivo splenic CD4 (c) and CD8 (d) T cell 2NBDG uptake. e, 2NBDG staining in splenic CD4+ and CD8+ subsets (n=3 mice). f, Schema for 2NBDG/FDG co-injection experiment. g, Representative histogram of 2NBDG hi and 2NBDG lo populations collected via flow sorting. h, Per cell FDG avidity of flow-sorted 2NBDGlo versus 2NBDGho splenic T cells (n=3 mice). Each data point represents a biological replicate and graphs show mean and SEM. Data are from representative studies performed independently at least twice. P values were calculated using the Brown-Forsythe and Welch ANOVA with Dunnett’s T3 for multiple comparison tests for (b,e), 2-tailed Welch’s t test for CD4 comparisons in (e), and a paired t-test for (h). * p<0.05, ** p<0.01, *** p<0.001. Exact p-values are provided in source data. 2NBDG: 2-(N-(7-Nitrobenz-2-oxa-1,3-diazol-4-yl)Amino)-2-Deoxyglucose); CM: central memory; CPM: counts per million; EM: effector memory; FDG: fluorodeoxyglucose; Tconv; conventional CD4 T cell; Treg: regulatory CD4 T cell
Extended Data Fig. 4 |
Extended Data Fig. 4 |. Spatial organization of immune cells in subcutaneous MC38 tumors.
Representative micrographs of H&E and indicated immunohistochemistry (IHC) stains of subcutaneous MC38 tumors. Arrows indicate positive cells on faint CD11b stain. Center column is low power overview (scale bar = 200μm). Insets demonstrate high power images from central (left) and peripheral (right) tumor locations (scale bar = 20μm). Images are representative from 5 biological replicates.
Extended Data Fig. 5 |
Extended Data Fig. 5 |. Tumor model characterizations by flow cytometry.
a-g, Spleen and tumor CD45+ immune cell populations from MC38 (a) (n=3 mice), CT26 (b) (n=4 mice), and Renca (c) (n=4 mice) subcutaneous tumors; intrarenal Renca tumors (d) (n=3 mice); spontaneous PyMT GEMM tumors (e) (n=3 mice); AOM/DSS CRC tumors (f) (n=6 for tumors, n=11 mice for spleens); and MC38 subcutaneous tumors grown in Rag1−/− mice (g) (n=6 mice). h, Gating strategy for immune cell identification using lymphocyte and myeloid-focused antibody panels. Each data point represents a biological replicate and graphs show mean and SEM. Data from a-f are representative of independent experiments performed at least twice. DC: dendritic cell; M-MDSC: monocytic myeloid-derived suppressor cell; NK cell: natural killer cell; PMN-MDSC: polymorphonuclear myeloid-derived suppressor cell; PyMT: polyoma virus middle T antigen; TAM: tumor-associated macrophage.
Extended Data Fig. 6 |
Extended Data Fig. 6 |. Supporting data for Fig. 2.
a-b, Fraction composition, viability, and live cell yield from MC38 tumor fractions isolated using CD4/8 microbeads (n=3 for tumors, n=4 mice for spleens) (a) and CD11b microbeads (n=4 mice) (b). c-d, Cellular FDG avidity in designated CT26 tumor cell fractions using CD4/8 microbeads (n=5 for Wh Spl, n=3 for Spl other CD45+ and Wh Tum, n=4 mice for all others) (c) and CD11b microbeads (n=5 for spleens, n=3 for Wh Tum, and n=4 mice for all others) (d). c-f, Fraction composition, viability, and live cell yield from MC38 tumor fractions isolated using Gr1 microbeads (e) and F4/80 microbeads (f) (n=4 mice). g, Cellular FDG avidity in designated MC38 tumor cell fractions from Rag1 KO mice (n=6 mice). h, Cellular FDG avidity in MC38 tumor cell fractions using CD11b and CD11c microbeads (n= 9 for Wh Spl, n=5 for spleen fraction, n=10 mice for all others). i, Fraction composition of CD11c purification (n= 9 for Wh Spl, n=5 for spleen fraction, n=10 mice for all others). j, Representative flow cytometry illustrating CD103 and Ly6C staining of cDC (CD45+ CD11b CD11c+ MHCII+ cells) from MC38 tumor and spleen. Each data point represents a biological replicate and graphs show mean and SEM. Data are representative of independent experiments performed at least twice. (h) includes data from two independent experiments. P values were calculated using Welch’s 2-tailed t-test. Exact p-values are provided in source data. * p<0.05. ** p<0.01, *** p<0.001. cDC1: type 1 conventional dendritic cell
Extended Data Fig. 7 |
Extended Data Fig. 7 |. Supporting data for Fig. 3.
a, pS6 levels in CT26 tumor populations (n=5 mice). b, MC38 tumor mass at study endpoint with rapamycin (n=20 for veh, n=19 mice for rapa). c, Metabolite concentrations in tumor interstitial fluid (TIF) and matched plasma from MC38 tumor-bearing mice treated with rapamycin or vehicle (n=5, except for lactate and glutamine plasma and TIF veh n=4 mice). d, Immune cell infiltration of MC38 tumors from mice treated with rapamycin or vehicle (n=15 for veh, n=19 mice for rapa). Significance between rapamycin and vehicle treatment for individual populations indicated in legend. Significant decrease in total CD45+ cell infiltration is noted. e-f, Flow cytometry quantification of Ki67 positivity (e) and cell size (forward scatter, FSC) (f) from MC38 tumor populations in mice treated with rapamycin or vehicle (n=4 for veh, n=5 mice for rapa). g-k MC38 tumor CD3+CD8a+ T cell phenotypes from rapamycin or vehicle treated mice for effector memory phenotype (g), ex vivo IFNγ production (h), PD1 and TIM3 expression (i), LAG3 expression (j) (n=5 mice/group), and ratio of CD8 T cells to CD4+FOXP3+ Treg (k) (n=15 for veh, n=19 mice for rapa). l, % M2-like TAM (CD11cloCD206hi) in MC38 tumors from mice treated with rapamycin or vehicle (n=15 for veh, n=19 mice for rapa). m-n, Myeloid suppression assay representative histogram of CD8a+ OT-I T cell dilution of CellTrace Violet (CTV) indicative of proliferation (m) and quantification of division index (n) for MC38 tumor myeloid cells isolated using CD11b microbeads from rapamycin and vehicle-treated mice (n=5 mice/group). Each data point represents a biological replicate and graphs show mean and SEM. Data in (a, e-j) are representative of independent experiments performed at least twice. (b, d, k-l) display data merged from 4 independent experiments. P values were calculated using the Brown-Forsythe and Welch ANOVA with Dunnett’s T3 for multiple comparison tests (a) and Welch’s 2-tailed t-test (b-l, n). * p<0.05. ** p<0.01, *** p<0.001. Exact p-values are provided in source data. pS6: phosphorylated ribosomal protein S6 (Ser235/236); Rapa: rapamycin; TIF: tumor interstitial fluid.
Extended Data Fig. 8 |
Extended Data Fig. 8 |. Metabolic transcriptional signatures of MC38 tumor cell populations.
a, Cell sorting scheme of MC38 tumor cell populations used for mRNA transcript analyses. b, Clustering analysis heatmap of differentially expressed metabolic genes from MC38 tumor cell populations. Select genes annotated. c, Reactome gene set enrichment analysis for genes most highly expressed in each MC38 tumor population. Significantly enriched gene sets are shown and colored according to metabolic pathway. OXPHOS; oxidative phosphorylation; TCA; tricarboxylic acid cycle
Extended Data Fig. 9 |
Extended Data Fig. 9 |. Effect of rapamycin on MC38 tumor population metabolic markers.
a-e, Heatmaps of significantly altered metabolic genes between rapamycin and vehicle-treated MC38 tumor cell populations for indicated metabolic pathways. White spaces indicate non-significant changes with rapamycin treatment for that gene and tumor cell population. Genes were grouped and classified manually. (n=3/group, except n=2 for rapamycin treated M-MDSC and CD4) f, Flow cytometry quantification of GLUT1 expression in MC38 tumor populations from mice treated with rapamycin or vehicle (n=4 for veh, n=5 mice for rapa). Each data point represents a biological replicate and graphs show mean and SEM. Exact p-values are provided in source data. AA: amino acid; FAO: fatty acid oxidation; NT: nucleotide; OXPHOS: oxidative phosphorylation; PPP: pentose phosphate pathway; PTGS: prostaglandin synthases; Reg: regulatory genes; RNR: ribonucleotide reductase; SLCs: solute carrier proteins; TCA tricarboxylic acid cycle
Extended Data Fig. 10 |
Extended Data Fig. 10 |. Supporting data for Fig. 4.
a-b, Representative histograms (a) and quantification (b) for ex vivo staining of C16 BODIPY by indicated MC38 tumor cell populations from tumor single cell suspensions (n=5 mice). c, Percent contribution to total tumor C16 BODIPY signal from indicated tumor cell populations (n=5 mice). d-f, Cellular 18F-Gln avidity in designated tumor cell fractions in CT26 (n=4 for spleen, n=3 mice for tumor) (d) and Renca (n=5 mice) (e) subcutaneous tumors and AOM/DSS spontaneous tumors (n=4 mice) (f). g, MC38 tumor mass from mice treated with V9302 or DMSO (n=13 for V9302, n=12 mice for DMSO). h, Immune cell infiltration of MC38 tumors from mice treated with V9302 or DMSO (n=13 for V9302, n=12 mice for DMSO). Significance between V9302 and DMSO treatment in distinct populations is indicated in legend. There is no significant change in total CD45+ cell infiltration (n=13 for V9302, n=12 mice for DMSO). i-j, Representative plot (i) and abundance (j) of MC38 M2-like TAM from mice treated with V9302 or DMSO (n=13 for V9302, n=12 mice for DMSO). Each data point represents a biological replicate and graphs show mean and SEM. Data are representative of at least two independent experiments. (g-j) are data combined from two experiments. P values were calculated using the Brown-Forsythe and Welch ANOVA with Dunnett’s T3 for multiple comparison tests (b,c) or Welch’s 2-tailed t-test (d-j). * p<0.05, ** p<0.01, *** p<0.001. Exact p-values are provided in source data. C16 BODIPY: C16 (4,4-Difluoro-5,7-Dimethyl-4-Bora-3a,4a-Diaza-s-Indacene-3-Hexadecanoic Acid) (fluorescent analog of palmitate); V9302: glutamine uptake inhibitor
Fig. 1 |
Fig. 1 |. Glucose is preferentially consumed by immune over cancer cells.
a,b Quantification of IF metabolites from (a) human ccRCC tumors and matched adjacent normal kidney (n=14 patients) and (b) murine MC38 subcutaneous tumor IF and matched plasma (n=5 mice). c, Representative (of n>20 mice) FDG PET image of MC38 tumor. d, Experimental schema. e, Representative flow cytometry analysis of MC38 whole tumor, CD45+, and CD45 cell fractions gated on live cells. f, FDG avidity in designated cell fractions from MC38 tumors (n=5 mice). g, Representative (of n=3 mice) tissue autoradiography of MC38 tumor (scale bar = 800μm). h, Representative (of n=5 mice) IHC for CD45 in MC38 tumor (scale bar = 200μm). i-m, FDG avidity in designated tumor cell fractions from subcutaneous CT26 (n=4 mice) (i) and Renca (n=4 mice) (j) tumors; intrarenal Renca tumors (n=3 mice) (k); AOM/DSS-induced CRC tumors (n=6 for tumor, n=11 mice for spleen) (l); and PyMT GEMM tumors (n=3 mice) (m). Each data point represents a biological replicate and graphs show mean and SEM. (b-c, e-m) are data from representative studies performed independently at least twice. P values were calculated using paired 2-tailed t-test for (a-b) and Welch’s 2-tailed t-test for (f, i-m). * p<0.05, ** p<0.01, *** p<0.001. Exact p-values are provided in source data. AOM/DSS CRC: azoxymethane/dextran sodium sulfate-induced colorectal cancer; ccRCC: clear cell renal cell carcinoma; CPM: counts per minute; FDG PET: 18-fluorodeoxyglucose positron emission tomography; GEMM: genetically engineered mouse model; IF: interstitial fluid; PyMT: Polyoma virus middle T antigen; TIF: tumor interstitial fluid; TME: tumor microenvironment
Fig. 2 |
Fig. 2 |. TME myeloid cells uptake more glucose than cancer cells.
a, Representative flow cytometry from CD4/8 microbead fractionated MC38 tumors gated on live cells. b, FDG avidity in designated cell fractions (n=3 for tumor, n=4 mice for spleen). c, Representative flow from CD11b microbead fractionated MC38 tumor gated on live cells. d, FDG avidity in designated cell fractions (n=4 mice). e, Representative flow cytometry plots of MC38 tumor CD11b+ myeloid cells. f, Representative (of n=2 mice) H&E-stained micrograph of F4/80 microbead-isolated TAM (scale bar = 5μm). g-h, FDG avidity in designated MC38 tumor cell fractions using Gr1 (n=4 except Wh Tum n=3 mice) (g) or F4/80 microbeads (n=4 mice) (h). i, Representative (of n=5 mice) OCR tracings from MC38 tumor cell fractions with oligomycin (O), FCCP (F), and rotenone and antimycin A (R/AA). j-k, Basal mitochondrial OCR (j) and cellular ECAR (k) of MC38 tumor fractions (n=5 mice). Each data point represents a biological replicate except for (i) which shows technical replicates of a single biological replicate, and graphs show mean and SEM. Independent representative studies were performed at least twice. P values were calculated using Welch’s 2-tailed t-test. * p<0.05, ** p<0.01, *** p<0.001. Exact p-values are provided in source data. ECAR: extracellular acidification rate; M-MDSC: monocytic myeloid-derived suppressor cell; OCR: oxygen consumption rate; TAM: tumor-associated macrophage
Fig. 3 |
Fig. 3 |. mTORC1 supports glucose uptake and metabolism in the TME.
a-c, Phosphorylated S6 (pS6) levels in indicated cell populations by flow cytometry in human peripheral blood mononuclear cells (PBMC) and matched ccRCC (representative histograms a, quantification b) (n=4 patients) and MC38 tumors (c) (n=4 mice). d, Representative histograms of pS6 levels in MC38 tumor cells from mice treated with rapamycin or vehicle. e, FDG avidity in designated MC38 tumor cell fractions with rapamycin treatment (n=15 for Spl Veh, n=8 for CD4/8+ veh, n=9 for CD4/8+ rapa and other CD45+, and n=14 mice for all other groups). f, Representative (of n=5 mice/group) OCR tracings from fractionated MC38 tumors from mice treated with rapamycin or vehicle with indicated injections of oligomycin (O), FCCP (F), and rotenone and antimycin A (R/AA). g-h, Basal cellular ECAR (g) and mitochondrial OCR (h) of MC38 tumor fractions from mice treated with rapamycin or vehicle (n=5 except for CD4/8+ rapa n=3 mice/group). i, PCA plot of metabolism-related mRNA transcripts from CD45, TAM, M-MDSC, CD8 T cell, and CD4 T cell flow-sorted populations from MC38 tumors (n=3 mice). j-m, Flow cytometry quantification of HK1 (j), HK2 (k), CD71 (l), and CD98 (m) in MC38 tumor cell populations from mice treated with rapamycin or vehicle (n=4 for veh, n=5 mice for rapa). c-d, i-m are representative of at least two independent experiments. (e) is the combined data of three independent experiments. Each data point represents a biological replicate except for (f) which shows technical replicates of a single biological replicate, and graphs show mean and SEM. P values were calculated using Brown-Forsythe and Welch ANOVA with Dunnett’s T3 for multiple comparison tests for (b-c) and Welch’s 2-tailed t-test for (e-m). * p<0.05, ** p<0.01, *** p<0.001. Exact p-values are provided in source data. FMO: fluorescence minus one; MFI: median fluorescence intensity; M-MDSC, monocytic myeloid derived suppressor cell; PBMC: peripheral blood mononuclear cell; pS6: phosphorylated ribosomal protein S6 (Ser235/236); Rapa: rapamycin
Fig. 4 |
Fig. 4 |. Glutamine partitions into cancer cells in the TME.
a-b, Glutamine-related transcription factor mRNA transcript levels of flow-sorted MC38 tumor cell populations (n=3 mice). c, Representative 18F-Gln image of subcutaneous MC38 tumor. d, 18F-Gln autoradiography image of subcutaneous MC38 tumor (scale bar = 800μm). e, Cellular 18F-Gln avidity in designated MC38 tumor cell fractions (n=4 mice). f-g, Cellular 18F-Gln avidity in MC38 tumor cell fractions from mice treated with vehicle or rapamycin (f) or V9302 (g) (n=5 mice/group). h, FDG avidity in MC38 tumor cell fractions from mice treated with V9302 or DMSO (n=4 for Wh Tum, CD4/8+, and other CD45+; n=8 mice for all others). i-j Contribution of cell populations to total MC38 tumor FDG (i) (n=10 mice) and 18F-Gln signal (n=5 mice) (j). k, Model for nutrient partitioning in the TME. Each data point represents a biological replicate and graphs show mean and SEM. Data are representative of at least two independent experiments. (h) shows combined data of two independent experiments. P values were calculated using Welch’s 2-tailed t-test for (e-h) and Brown-Forsythe and Welch ANOVA with Dunnett’s T3 for multiple comparison tests for (a-b, i-j). * p<0.05, ** p<0.01, *** p<0.001. Exact p-values are provided in source data. 18F-Gln: 18F-4-fluoroglutamine; DMSO: Dimethyl sulfoxide; V9302: ASCT2 inhibitor.

Comment in

References

    1. Vander Heiden MG & DeBerardinis RJ Understanding the Intersections between Metabolism and Cancer Biology. Cell 168, 657–669, doi:10.1016/j.cell.2016.12.039 (2017). - DOI - PMC - PubMed
    1. Siska PJ et al. Mitochondrial dysregulation and glycolytic insufficiency functionally impair CD8 T cells infiltrating human renal cell carcinoma. JCI Insight 2, doi:10.1172/jci.insight.93411 (2017). - DOI - PMC - PubMed
    1. Ho PC et al. Phosphoenolpyruvate Is a Metabolic Checkpoint of Anti-tumor T Cell Responses. Cell 162, 1217–1228, doi:10.1016/j.cell.2015.08.012 (2015). - DOI - PMC - PubMed
    1. Chang CH et al. Metabolic Competition in the Tumor Microenvironment Is a Driver of Cancer Progression. Cell 162, 1229–1241, doi:10.1016/j.cell.2015.08.016 (2015). - DOI - PMC - PubMed
    1. Faubert B et al. Lactate Metabolism in Human Lung Tumors. Cell 171, 358–371 e359, doi:10.1016/j.cell.2017.09.019 (2017). - DOI - PMC - PubMed

Publication types

MeSH terms