. 2021 Apr;592(7853):253-257.
doi: 10.1038/s41586-021-03335-3. Epub 2021 Apr 7.

Initial Upper Palaeolithic humans in Europe had recent Neanderthal ancestry

Affiliations

Initial Upper Palaeolithic humans in Europe had recent Neanderthal ancestry

Mateja Hajdinjak et al. Nature. 2021 Apr.

Abstract

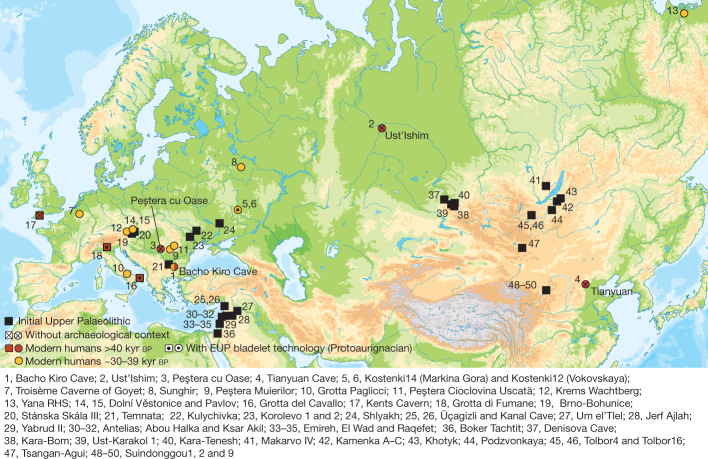
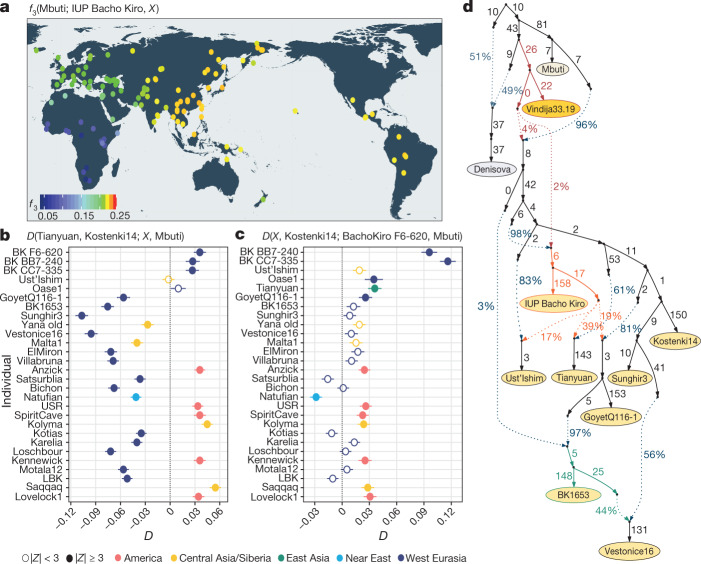
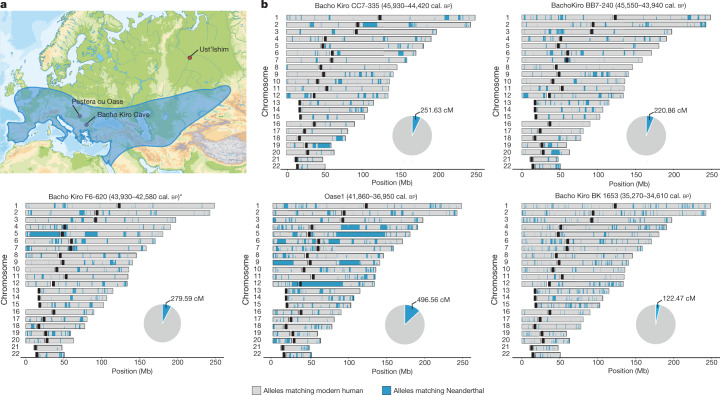
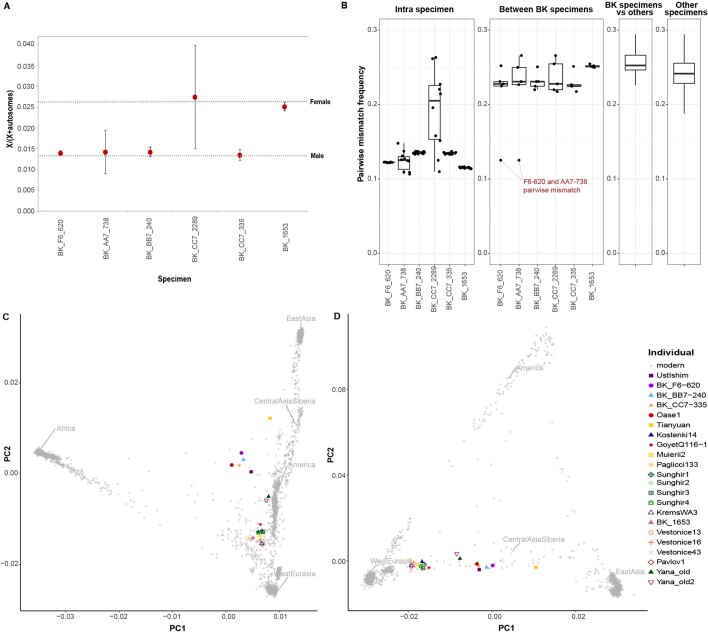
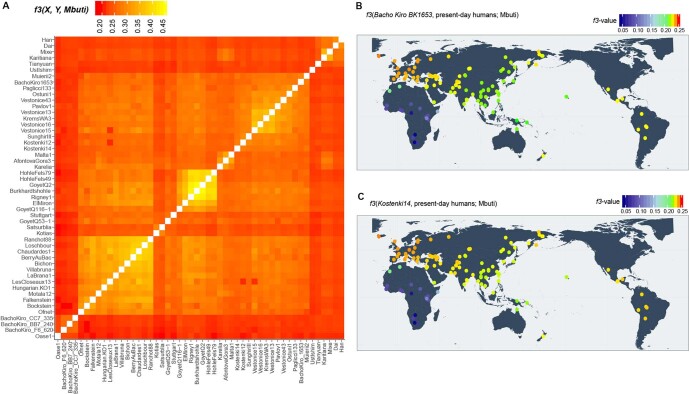
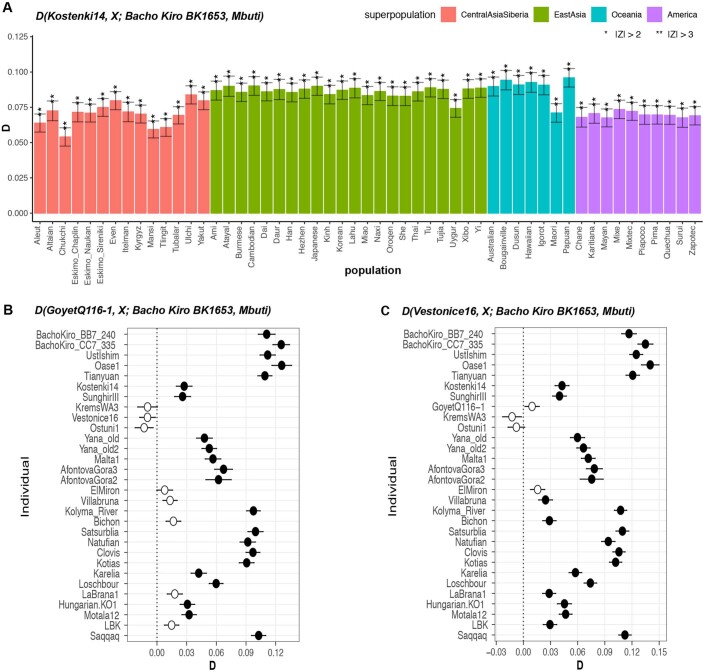
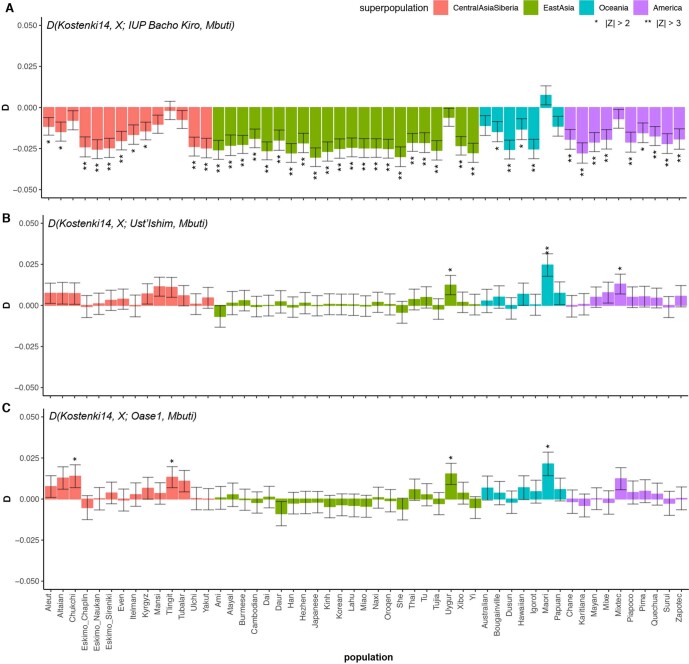
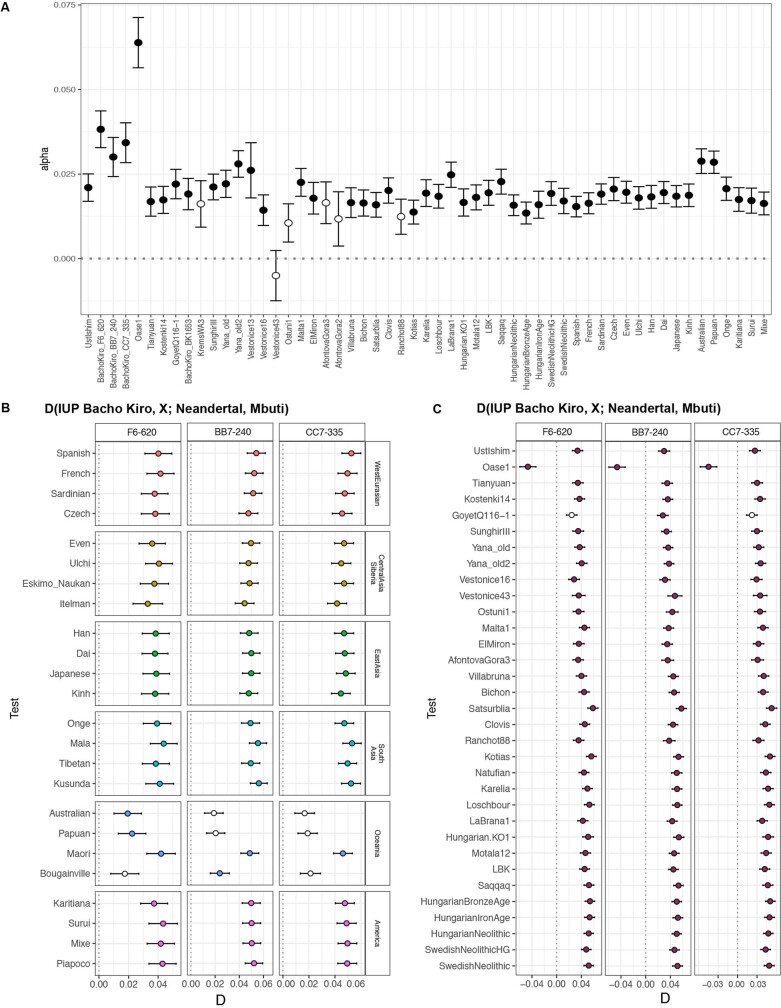
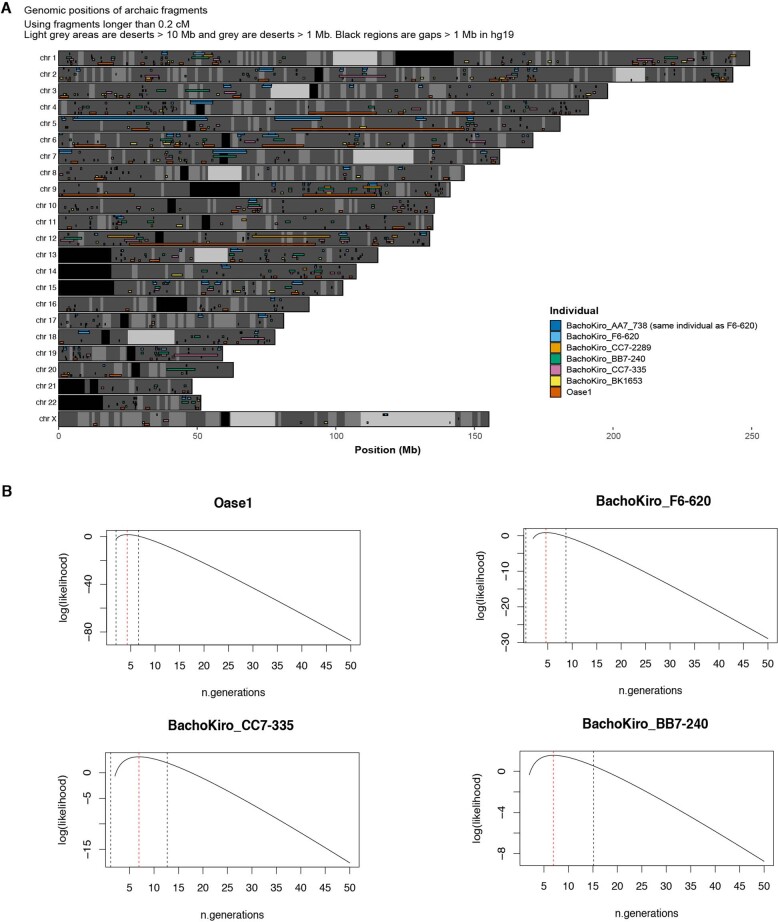
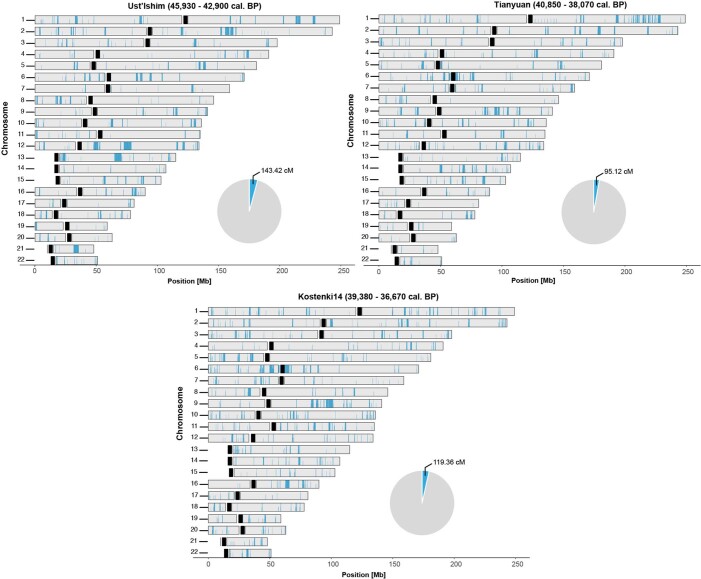
Modern humans appeared in Europe by at least 45,000 years ago1-5, but the extent of their interactions with Neanderthals, who disappeared by about 40,000 years ago6, and their relationship to the broader expansion of modern humans outside Africa are poorly understood. Here we present genome-wide data from three individuals dated to between 45,930 and 42,580 years ago from Bacho Kiro Cave, Bulgaria1,2. They are the earliest Late Pleistocene modern humans known to have been recovered in Europe so far, and were found in association with an Initial Upper Palaeolithic artefact assemblage. Unlike two previously studied individuals of similar ages from Romania7 and Siberia8 who did not contribute detectably to later populations, these individuals are more closely related to present-day and ancient populations in East Asia and the Americas than to later west Eurasian populations. This indicates that they belonged to a modern human migration into Europe that was not previously known from the genetic record, and provides evidence that there was at least some continuity between the earliest modern humans in Europe and later people in Eurasia. Moreover, we find that all three individuals had Neanderthal ancestors a few generations back in their family history, confirming that the first European modern humans mixed with Neanderthals and suggesting that such mixing could have been common.


Conflict of interest statement

The authors declare no competing interests.

Figures

Fig. 1
Fig. 1. Archaeological sites that have yielded genetic data and/or IUP assemblages.
Sites with modern human genome-wide data older than 40 kyr bp (red circles) or older than 30 kyr bp (yellow circles), sites in Europe with modern human remains older than 40 kyr bp (red squares) and sites with IUP assemblages (black squares).
Fig. 2
Fig. 2. Population affinities of the IUP Bacho Kiro Cave individuals.
a, Allele sharing (f3) between the IUP Bacho Kiro Cave individuals and present-day populations (X) from the Simons Genome Diversity Project (SGDP) after their separation from an outgroup (Mbuti) (calculated as f3(Mbuti; IUP Bacho Kiro, X). Warmer colours on the map correspond to higher f3 values (higher shared genetic drift). b, IUP Bacho Kiro Cave individuals share significantly more alleles (proportions of allele sharing or D values plotted on x axis) with the roughly 40,000-year-old Tianyuan individual than with the approximately 38,000-year-old Kostenki14 individual,. Calculated as D(Tianyuan, Kostenki14; X, Mbuti). c, F6-620 shares significantly more alleles with the Oase1 and GoyetQ116-1 individuals, ancient Siberians and Native American individuals than with the Kostenki14 individual. Calculated as D(X, Kostenki14; F6-620, Mbuti). b, c, Filled circles indicate a significant value (|Z| ≥ 3); open circles, |Z| < 3. Whiskers correspond to 1 s.e. calculated across all autosomes (1,813,821 SNPs) using a weighted block jackknife and a block size of 5 Mb. BK, Bacho Kiro. d, Admixture graph relating Bacho Kiro Cave individuals and ancient humans older than 30 kyr bp. This model uses 281,732 overlapping SNPs in all individuals and fits the data with a single outlier (Z = 3.22). Ancient non-Africans (yellow circles), Vindija 33.19 Neanderthal (orange), Denisovan (grey) and present-day African individuals (light yellow circle) are shown. Admixture edges (dotted lines) show the genetic component related to Neanderthals (red), to the IUP Bacho Kiro Cave individuals (orange) and to BK1653 (green). Numbers on solid branches correspond to the estimated drift in f2 units of squared frequency difference; labels on dotted edges give admixture proportions.
Fig. 3
Fig. 3. Geographical distribution of Neanderthal archaeological sites and genome-wide distribution of Neanderthal alleles in the genomes of ancient modern humans.
a, Neanderthal geographical range (blue) and the locations of Peştera cu Oase, Bacho Kiro Cave and where the femur of the Ust’Ishim individual was found. b, Distribution of Neanderthal DNA in ancient modern human genomes. Neanderthal DNA segments longer than 0.2 cM are indicated in blue. Pie charts indicate the total proportion of Neanderthal DNA identified in each genome. Centromeres are shown in black.
Extended Data Fig. 1
Extended Data Fig. 1. C-to-T substitution frequencies at the beginning and end of nuclear alignments for the merged libraries of the Bacho Kiro Cave and Oase1 specimens.
Only fragments of at least 35 bp that mapped to the human reference genome with a mapping quality of at least 25 (MQ ≥ 25) were used for this analysis. Solid lines depict all fragments and dashed lines the fragments that have a C-to-T substitution at the opposing end (conditional substitutions).
Extended Data Fig. 2
Extended Data Fig. 2. Sex determination, pairwise mismatch rate between specimens and principal component analyses (PCAs).
a, Sex determination for Bacho Kiro Cave specimens. Only fragments that showed C-to-T substitutions in the first three and/or last three positions and overlapping 2200k Panel SNPs were used for this analysis (for the number of deaminated fragments per specimen, see Supplementary Table 2.8). The expected ratios of X to (X + autosomal) fragments for a female and a male individual are depicted as dashed lines, and circles correspond to the calculated values for each of the Bacho Kiro Cave specimens. Whiskers correspond to 95% binomial confidence intervals. b, Pairwise mismatch rate between different libraries from the same specimen (intra-specimen), between different Bacho Kiro Cave specimens (inter-specimen) and between other ancient modern humans older than 30,000 cal. bp. The boxplots were drawn using the summary statistics geom_stat from the R-package ggplot; lower and upper hinges, first and third quartiles; whiskers, maximum value of 1.5× the interquartile range; centre line, median. SNPs across all autosomes of the 2200k Panel were used for the calculations (number of SNPs (nsnps) = 2,056,573). c, A PCA of 2,970 present-day humans genotyped on 597,573 SNPs with 22 ancient individuals older than 30,000 cal. bp projected onto the plane. d, A PCA of 1,444 present-day Eurasian and Native American individuals genotyped on 597,573 SNPs with 22 ancient individuals older than 30,000 cal. bp projected onto the plane. c, d, Grey dots denote present-day human genomes.
Extended Data Fig. 3
Extended Data Fig. 3. Heatmaps of outgroup f3-statistics corresponding to the amount of shared genetic drift between individuals and/or populations.
a, Genetic clustering of ancient individuals, including the IUP Bacho Kiro Cave, BK1653 and Oase1 individuals based on the amount of shared genetic drift and calculated as f3(ancient1, ancient2; Mbuti). Lighter colours in this panel indicate higher f3 values and correspond to higher shared genetic drift (nsnps = 2,056,573). b, c, Shared genetic drift between the approximately 35,000-year-old BK1653 (b; nsnps = 825,379) or approximately 38,000-year-old Kostenki14 individuals, (c; nsnps = 1,676,430) and present-day human populations from the SGDP calculated as f3(Bacho Kiro BK1653/Kostenki14, present-day humans; Mbuti). Three Mbuti individuals from the same panel were used as an outgroup. Higher f3 values are indicated with warmer colours and correspond to higher shared genetic drift. Plotted f3 values were calculated using ADMIXTOOLS as implemented in admixr. Coordinates for present-day humans were previously published. The heatmap scale is consistent with those in Fig. 2a, Supplementary Figs. 5.1, 5.2.
Extended Data Fig. 4
Extended Data Fig. 4. Population affinities of the approximately 35,000-year-old BK1653 individual.
a, In contrast to the IUP Bacho Kiro Cave individuals, individual BK1653 is significantly closer to the approximately 38,000-year-old Kostenki14 individual, than to present-day non-African populations from Central Asia and Siberia, East Asia, South Asia, Oceania or the Americas, as calculated by D(Kostenki14, present-day humans; BachoKiro BK1653, Mbuti). D values for each comparison, plotted as barplots, were calculated using ADMIXTOOLS as implemented in admixr. Present-day human genomes from the SGDP were used in these statistics, and three Mbuti individuals from the same panel were used as an outgroup. **|Z| ≥ 3, *|Z| ≥ 2. b, c, BK1653 shares significantly more alleles with the approximately 35,000-year-old GoyetQ116-1 (b) and approximately 31,000-year-old Vestonice16 individuals (c) than with most other ancient modern humans. D values calculated as in a. Filled circles correspond to |Z| ≥ 3, and open circles indicate a |Z|<3 (not significant). Error bars in all panels show s.e. calculated using a weighted block jackknife across all autosomes on the 2200k Panel (nsnps (Bacho Kiro BK1653) = 825,379) and a block size of 5 Mb.
Extended Data Fig. 5
Extended Data Fig. 5. D(Kostenki14, X; IUP Bacho Kiro Cave individuals/Ust’Ishim/Oase1, Mbuti) where X is a present-day non-African population from Central Asia and Siberia, East Asia, South Asia, Oceania or the Americas.
D values for each comparison, plotted as barplots, were calculated using ADMIXTOOLS as implemented in admixr. Present-day human genomes from the SGDP were used in these statistics, and three Mbuti individuals from the same panel were used as an outgroup. **|Z| ≥ 3, *|Z| ≥ 2. Error bars denote s.e. calculated using a weighted block jackknife across all autosomes on the 2200k Panel and a block size of 5 Mb. a, A pool of three IUP Bacho Kiro Cave individuals (nsnps = 1,813,821). b, Ust’Ishim (nsnps = 1,951,462). c, Oase1 (nsnps = 402,526).
Extended Data Fig. 6
Extended Data Fig. 6. Neanderthal ancestry in IUP Bacho Kiro Cave individuals.
a, The proportion of Neanderthal ancestry in Bacho Kiro Cave individuals and other ancient and present-day modern humans calculated with a direct f4 ratio that takes advantage of the two high-coverage Neanderthal genomes,,. f4 ratio (alpha) values calculated using ADMIXTOOLS as implemented in admixr. b, c, Neanderthals,, share significantly more derived alleles with the IUP Bacho Kiro Cave individuals than with most present-day (b) or ancient modern humans (c). D values calculated using ADMIXTOOLS as implemented in admixr. Filled circles correspond to |Z| ≥ 3; open circles indicate |Z| < 3 (not significant). Error bars in all panels show s.e. calculated using a weighted block jackknife across all autosomes on the 2200k Panel (nsnps = 2,056,573) and a block size of 5 Mb.
Extended Data Fig. 7
Extended Data Fig. 7. Segments of Neanderthal ancestry and estimates of the number of generations since the most recent Neanderthal ancestor.
a, A combined plot of the inferred Neanderthal segments in the genomes of the IUP Bacho Kiro Cave, BK1653 and Oase1 individuals, including chromosome X, using a hidden Markov model approach (admixfrog). b, Maximum likelihood estimates (dashed red lines) of the number of generations since a recent additional Neanderthal introgression into the IUP Bacho Kiro Cave and Oase1 individuals. Dashed black lines show 95% confidence intervals.
Extended Data Fig. 8
Extended Data Fig. 8. Spatial distribution of Neanderthal DNA in the Ust’Ishim, Tianyuan and Kostenki14 genomes.
Segments corresponding to Neanderthal ancestry inferred using a hidden Markov model approach (admixfrog) longer than 0.2 cM are indicated in blue. Centromeres are indicated in black. Pie charts indicate the total amount of Neanderthal DNA identified in each genome.

Comment in

References

    1. Hublin J-J, et al. Initial Upper Palaeolithic Homo sapiens from Bacho Kiro Cave, Bulgaria. Nature. 2020;581:299–302. - PubMed
    1. Fewlass H, et al. A 14C chronology for the Middle to Upper Palaeolithic transition at Bacho Kiro Cave. Bulgaria. Nat. Ecol. Evol. 2020;4:794–801. - PubMed
    1. Higham T, et al. The earliest evidence for anatomically modern humans in northwestern Europe. Nature. 2011;479:521–524. - PubMed
    1. Benazzi S, et al. Early dispersal of modern humans in Europe and implications for Neanderthal behaviour. Nature. 2011;479:525–528. - PubMed
    1. Hublin J-J. The modern human colonization of western Eurasia: when and where? Quat. Sci. Rev. 2015;118:194–210.

Publication types

LinkOut - more resources