

Nigral Iron Deposition Is Associated With Levodopa-Induced Dyskinesia in Parkinson's Disease
- PMID: 33828454
- PMCID: PMC8019898
- DOI: 10.3389/fnins.2021.647168
Nigral Iron Deposition Is Associated With Levodopa-Induced Dyskinesia in Parkinson's Disease
Abstract
Objective: To investigate iron deposition in the substantia nigra (SN) of Parkinson's disease (PD) patients associated with levodopa-induced dyskinesia (LID).
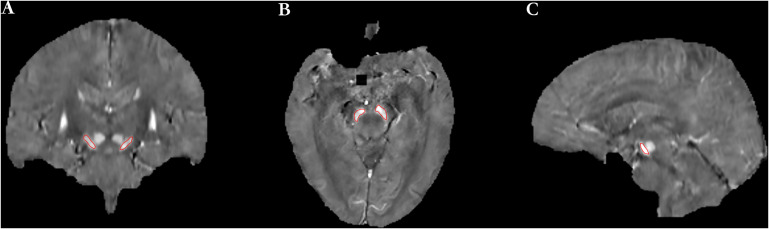
Methods: Seventeen PD patients with LID, 17 PD patients without LID, and 16 healthy controls were recruited for this study. The mean QSM values of the whole, left, and right SN were compared among the three groups. A multivariate logistic regression model was constructed to determine the factors associated with increased risk of LID. The receiver operating characteristic curve of the QSM value of SN in discriminating PD with and without LID was evaluated.
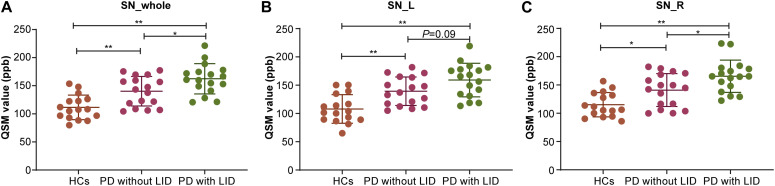
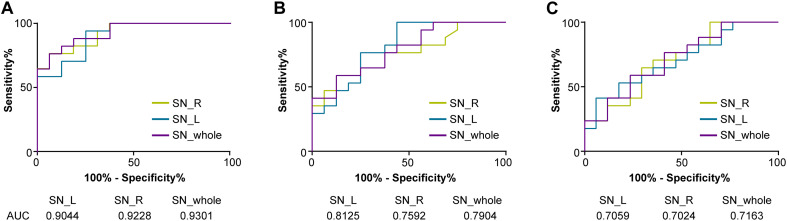
Results: The mean QSM values of the whole and right SN in the PD with LID were higher than those in the PD without LID (∗ P = 0.03, ∗ P = 0.03). Multivariate logistic regression analysis revealed that the QSM value of whole, left, or right SN was a predictor of the development of LID (∗ P = 0.03, ∗ P = 0.04, and ∗ P = 0.04). The predictive accuracy of LID in adding the QSM value of the whole, left, and right SN to LID-related clinical risk factors was 70.6, 64.7, and 67.6%, respectively. The QSM cutoff values between PD with and without LID of the whole, left, and right SN were 148.3, 165.4, and 152.7 ppb, respectively.
Conclusion: This study provides the evidence of higher iron deposition in the SN of PD patients with LID than those without LID, suggesting that the QSM value of the SN may be a potential early diagnostic neuroimaging biomarker for LID.
Keywords: Parkinsion’s disease; dyskinesia; levodopa; quantitative susceptibility mapping; substantia nigra.
Copyright © 2021 Song, Li, Mei, Jia, Yang, Ye, Yuan, Zhang and Lu.
Conflict of interest statement
YY was employed by the company UIH America. The remaining authors declare that the research was conducted in the absence of any commercial or financial relationships that could be construed as a potential conflict of interest.
Figures
Similar articles
-
Quantifying iron deposition within the substantia nigra of Parkinson's disease by quantitative susceptibility mapping.J Neurol Sci. 2018 Mar 15;386:46-52. doi: 10.1016/j.jns.2018.01.008. Epub 2018 Jan 12. J Neurol Sci. 2018. PMID: 29406966
-
Multimodal Imaging of Substantia Nigra in Parkinson's Disease with Levodopa-Induced Dyskinesia.Mov Disord. 2023 Apr;38(4):616-625. doi: 10.1002/mds.29320. Epub 2023 Feb 17. Mov Disord. 2023. PMID: 36799459
-
Increased iron in the substantia nigra pars compacta identifies patients with early Parkinson'sdisease: A 3T and 7T MRI study.Neuroimage Clin. 2024;41:103577. doi: 10.1016/j.nicl.2024.103577. Epub 2024 Feb 17. Neuroimage Clin. 2024. PMID: 38377722 Free PMC article.
-
Iron Imaging as a Diagnostic Tool for Parkinson's Disease: A Systematic Review and Meta-Analysis.Front Neurol. 2020 May 28;11:366. doi: 10.3389/fneur.2020.00366. eCollection 2020. Front Neurol. 2020. PMID: 32547468 Free PMC article.
-
Effectiveness of QSM over R2* in assessment of parkinson's disease - A systematic review.Neurol India. 2020 Mar-Apr;68(2):278-281. doi: 10.4103/0028-3886.284377. Neurol India. 2020. PMID: 32415005
Cited by
-
Brain Glucose Hypometabolism and Iron Accumulation in Different Brain Regions in Alzheimer's and Parkinson's Diseases.Pharmaceuticals (Basel). 2022 Apr 29;15(5):551. doi: 10.3390/ph15050551. Pharmaceuticals (Basel). 2022. PMID: 35631378 Free PMC article. Review.
-
Modified Iron Deposition in Nigrosomes by Pharmacotherapy for the Management of Parkinson's Disease.Front Mol Biosci. 2022 Jul 7;9:908298. doi: 10.3389/fmolb.2022.908298. eCollection 2022. Front Mol Biosci. 2022. PMID: 35874610 Free PMC article.
-
Multimodal magnetic resonance imaging studies on non-motor symptoms of Parkinson's disease.IBRO Neurosci Rep. 2025 Jan 6;18:180-190. doi: 10.1016/j.ibneur.2025.01.003. eCollection 2025 Jun. IBRO Neurosci Rep. 2025. PMID: 39896716 Free PMC article.
-
Iron Deposition in Parkinson's Disease: A Mini-Review.Cell Mol Neurobiol. 2024 Feb 23;44(1):26. doi: 10.1007/s10571-024-01459-4. Cell Mol Neurobiol. 2024. PMID: 38393383 Free PMC article. Review.
-
Correlation of brain iron deposition and freezing of gait in Parkinson's disease: a cross-sectional study.Quant Imaging Med Surg. 2023 Dec 1;13(12):7961-7972. doi: 10.21037/qims-23-267. Epub 2023 Oct 7. Quant Imaging Med Surg. 2023. PMID: 38106290 Free PMC article.
References
LinkOut - more resources
Full Text Sources
Other Literature Sources