. 2021 Mar 22:15:658343.
doi: 10.3389/fncir.2021.658343. eCollection 2021.

Transient Astrocytic Gq Signaling Underlies Remote Memory Enhancement

Affiliations

Transient Astrocytic Gq Signaling Underlies Remote Memory Enhancement

Youichi Iwai et al. Front Neural Circuits. .

Abstract

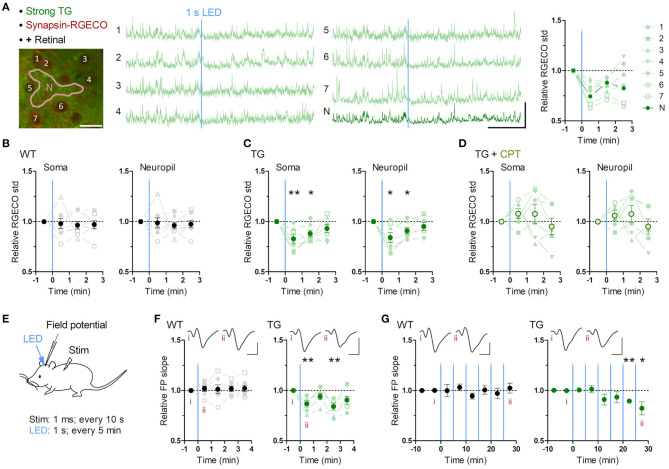
Astrocytes elicit transient Ca2+ elevations induced by G protein-coupled receptors (GPCRs), yet their role in vivo remains unknown. To address this, transgenic mice with astrocytic expression of the optogenetic Gq-type GPCR, Optoα1AR, were established, in which transient Ca2+ elevations similar to those in wild type mice were induced by brief blue light illumination. Activation of cortical astrocytes resulted in an adenosine A1 receptor-dependent inhibition of neuronal activity. Moreover, sensory stimulation with astrocytic activation induced long-term depression of sensory evoked response. At the behavioral level, repeated astrocytic activation in the anterior cortex gradually affected novel open field exploratory behavior, and remote memory was enhanced in a novel object recognition task. These effects were blocked by A1 receptor antagonism. Together, we demonstrate that GPCR-triggered Ca2+ elevation in cortical astrocytes has causal impacts on neuronal activity and behavior.

Keywords: Ca2+ signaling; G protein-coupled receptor; OptoA1AR; astrocytes; memory; optogenetic activation.


Conflict of interest statement

The authors declare that the research was conducted in the absence of any commercial or financial relationships that could be construed as a potential conflict of interest.

Figures

Figure 1
Figure 1
Cis-Retinal supplement is required for reliable Optoα1AR activation by brief illumination in vivo. (A) Optoα1AR, optically-activatable Gq-GPCR, is a chimeric molecule of mammalian rhodopsin and Gq-coupled α1 adrenergic receptor (Airan et al., 2009), which induces intracellular Ca2+ elevation upon activation. For astrocyte-selective expression, a TG vector was constructed with the BAC GLT1 DNA (Regan et al., 2007). (B) Line #941 (“Strong”) shows intense EYFP fluorescence (green) throughout the brain. High magnification view in white rectangle shows that EYFP is expressed in S100β-positive astrocytes (red). Relatively high EYFP signals are visible in astrocytic somata and endfeet. By contrast, hardly any NeuN signals (red) from neurons overlap with EYFP signals. Scale bar: 1 mm (left), 50 μm (middle and right). (C) Line #877 (“Patchy”) shows visible EYFP fluorescence (green) in a patchy pattern throughout the cortex, hippocampus and striatum. High magnification view in white rectangle shows that EYFP signals colocalize with S100β signals (red) in roughly half of the astrocytes. There are EYFP-negative but S100β-positive domains. Relatively high EYFP signals are visible in astrocytic somata and endfeet. NeuN signals (red) do not overlap with EYFP signals. Scale bar: 1 mm (left), 50 μm (middle and right). (D) Sketch of in vivo astrocytic Ca2+ imaging with LED illumination in cortical superficial layers of urethane-anesthetized patchy-TG mice. Astrocytes are loaded with the red Ca2+ indicator Rhod-2. (E–G) Example plots of in vivo astrocytic Ca2+ imaging with optical stimulation. Optoα1AR-positive and negative astrocytes (white circles and arrowheads, respectively) are analyzed based on the EYFP expression. Green and black traces correspond to EYFP-positive and -negative astrocytes, respectively. Insets: images of cells analyzed in the respective plots. Scale bars: 50 μm. (E) Astrocytic Ca2+ imaging without retinal addition. Strong blue LED illumination (1 mW, 5 s) did not induce Ca2+ elevations in all the encircled six astrocytes. (F) Astrocytic Ca2 imaging with retinal. Weak LED illumination (0.1 mW, 1 s) induced a transient Ca2+ increase in EYFP-positive astrocytes, but not in EYFP-negative astrocytes. (G) Astrocytic Ca2 imaging with retinal. Strong LED illumination (1 mW, 1 s) induced a rapid Ca2+ increase in EYFP-positive astrocytes. Delayed Ca2+ elevation was observed in EYFP-negative astrocytes. (H–L) Analysis of Ca2+ response in EYFP-positive and -negative astrocytes upon weak or strong LED illumination with retinal addition. Each symbol represents an individual imaging session (Weak LED: 35 sessions, nine patchy TG mice; Strong LED: 17 sessions, nine patchy TG mice). (H) Proportion of responsive cells. The weak-negative group was the least responsive (***p < 0.001, Tukey's test after one-way ANOVA). (I) Peak amplitude was similar for all groups (p > 0.11, one-way ANOVA). (J,K) Onset time and onset-to-peak time were shorter in the positive group for both stimulation strengths (***p < 0.001, **p < 0.01, Dunn's test after Kruskal-Wallis one-way ANOVA). (L) Peak-to-offset time was shorter in the strong-negative group (*p < 0.05, Dunn's test after Kruskal-Wallis one-way ANOVA). (M–P) Comparison of spontaneous, tail-pinch-induced, and optogenetically induced (strong illumination) Ca2+ response. (M) Mean and SEM trace of optogenetically induced (green) and tail-pinch-induced (gray) Ca2+ increase. Time 0 corresponds to onset time, when F/F0 reaches 120%. (N) Peak amplitude was similar among the 3 groups (p > 0.32, one-way ANOVA). (O,P) Onset-to-peak and peak-to-offset times of Ca2+ events were similar between the tail pinch and optogenetically induced groups (p > 0.05, Tukey's test after one-way ANOVA) and distinct from spontaneously observed Ca2+ events (***p < 0.001, **p < 0.01, *p < 0.05, Tukey's test after one-way ANOVA). Each symbol represents an individual imaging session (Spontaneous: 14 sessions, 10 TG mice; Tail-pinch: six sessions, four TG mice).
Figure 2
Figure 2
Brief astrocytic Gq activation suppresses neuronal activity. (A–D) Neuronal Ca2+ imaging from somatosensory cortex layer 2/3 in awake mice with optogenetic induction of Gq signaling in astrocytes. (A) Representative two-photon image of somatosensory cortex of a strong TG mouse expressing jRGECO1a (RGECO) in neurons by AAV-Syn-jRGECO1a (left). RGECO F/F0 from the labeled somata (1-6) and neuropil (N) decreased rapidly after 1 s LED illumination (middle). Ca2+ activity, measured as the standard deviation (std) of RGECO F/F0, decreased in the first and the second 1 min after LED illumination (right). Scale bars: 20 μm (micrograph); 100% F/F0 and 1 min (traces). (B) Ca2+ activity of neuronal somata and neuropil in WT mice did not change after LED illumination (p > 0.70 and p > 0.80, paired t-test, 1 min after LED illumination vs. 1 min before LED illumination, eight mice). (C) Ca2+ activity of neuronal somata and neuropil in TG mice decreased in the first and second minutes after LED illumination (first minute: p < 0.008 and p < 0.03; second minute: p < 0.02 and p < 0.03, paired t-test vs. 1 min before LED illumination, seven mice). (D) Adenosine A1R antagonist CPT blocked Optoα1AR-induced neuronal Ca2+ activity decrease in somata and neuropil (p > 0.18 and p > 0.25, paired t-test, 1 min after LED illumination vs. 1 min before LED illumination, six mice). (E–G) Sensory evoked field potential (FP) recording in somatosensory cortex layer 2/3 of shallowly anesthetized mice upon LED illumination. (E) FP response was evoked by sensory stimulation to the trunk (duration 1 ms, interval 10 s) before and after brief LED illumination (1 mW, duration 1 s). Six optical stimulations (5 min interval) were performed in a session. (F) LED time-triggered averaging of FP slope shows a reduction of sensory evoked response after astrocytic Gq activation in the first 1 min (p < 0.008, paired t-test vs. 1 min before LED illumination, six TG mice). WT mice did not show a significant change in FP slope (p > 0.51, paired t-test vs. 1 min before LED illumination, seven WT mice). This reduction in TG mice was detectable 3 min after LED illumination (p < 0.008, paired t-test vs. 1 min before LED illumination, six TG mice). Insets: averaged FP traces from a representative mouse, with the left and right traces averaged within 1 min before and 1 min after LED illumination, respectively. Scale-bars: 200 μV and 20 ms. (G) In the 30 min recording, evoked FP slope gradually decreased in TG mice (20–25 min and 25–30 min periods: p < 0.004 and <0.05, paired t-test vs. 0–10 min before LED illumination, six TG mice), while that in WT mice did not change throughout the 30 min period (p > 0.1, paired t-test vs. 0–10 min before LED illumination, seven WT mice). Insets: averaged FP traces from a representative mouse, with the left and right trace averaged within the 5 min period before the first LED illumination and the 5 min period after the last LED illumination, respectively. Scale bars: 200 μV and 20 ms. *p < 0.05, **p < 0.01.
Figure 3
Figure 3
Transient astrocytic Gq activation in the anterior cortex decreases locomotion in a novel open-field. (A) Anterior cortical areas of freely behaving mice were illuminated by a wireless LED device. Representative trajectories and occupancy maps during 45 min open-field behavior of a WT or a strong TG mouse. Both mice received LED illuminations (duration 3 s, interval 3 min, 15 times) with retinal pre-treatment (i.p.). The TG mouse traveled a shorter distance, while spending a similar length of time in the center zone as the WT mouse. Color bar: 15 s. (B) Time in the center zone was not significantly different between experimental conditions and between 15 min periods (p > 0.75 and p > 0.17, two-way ANOVA, 8 WT mice, 11 strong TG mice vs. four strong TG mice with DPCPX). (C) TG mice gradually exhibited shorter traveled distances (***p < 0.001, **p < 0.01, *p < 0.05, unpaired t-test, 8 WT mice vs. 11 strong TG mice). (D) Traveled distance in TG mice was significantly shorter in 15–30 min and 30–45 min, which was reinstated by DPCPX injection (**p < 0.01, ***p < 0.001, Bonferroni test after two-way ANOVA). (E) TG mice gradually increased immobile time (*p < 0.05, **p < 0.01, unpaired t-test, 8 WT mice vs. 11 strong TG mice). (F) LED-triggered averaging indicates a rapid and lasting decrease of locomotion in TG mice. Locomotion speed of TG mice was significantly reduced in 0–60 s, 60–120 s, and 120–160 s after LED illumination in comparison with that in 0-20 s before LED illumination (p < 0.03, p < 0.02, and p < 0.02, paired t-test). Locomotion speed of WT mice or TG mice with DPCPX did not change significantly after LED illumination (p > 0.2 or p > 0.4, paired t-test).
Figure 4
Figure 4
Transient astrocytic Gq activation in the anterior cortex does not affect short-term memory in a Y-maze. (A) WT and strong TG mice were pre-treated with retinal and were put in a Y-maze for 15 min with transient LED illuminations (duration 3 s, interval 3 min, five times) delivered. (B) Percentage of correct arm entries (unique triplets) was not significantly different between WT and TG mice (p > 0.30, Welch's t-test, 7 WT mice vs. 10 strong TG mice), but the variance was higher in TG mice (p < 0.02, F-test). (C–E) Number of arm entries, traveled distance and immobile time did not differ between WT and TG mice (p > 0.37, p > 0.35, and p > 0.73, Welch's t-test; p < 0.05, p < 0.02, and p < 0.02, F-test).
Figure 5
Figure 5
Transient astrocytic Gq activation in the anterior cortex enhances long-term object recognition memory. (A) Transient activation protocol. On the training day, WT or strong TG mice were placed in an open-chamber for 10 min, where two identical objects (F1 and F2) were placed apart. Mice were pre-treated with retinal. Transient LED illuminations (duration 3 s, interval 3 min, four times) were delivered during the training period. On the test day (1 day or 14 days after training), mice were exposed to one of the pre-familiarized objects (F1) and a novel object (N) for 10 min without LED illumination. In the 1-day test, both WT (black) and TG (green) mice similarly increased relative contact time to the novel object (p < 0.0002 and p < 0.08 paired t-test vs. relative contact time to F2 object in the training, 13 WT mice and 11 TG strong mice). In the 14-day test, TG mice still retained the novel object preference (p < 0.005, paired t-test, 11 strong TG mice), whereas WT mice did not (p > 0.31, paired t-test, eight WT mice). (B) Longer activation protocol. The training procedure is the same as in A, except for longer LED illuminations (30 s) delivered. In the 14-day test, TG mice showed the novel object preference (p < 0.04, paired t-test, nine strong TG mice). (C) Transient activation without retinal pre-treatment. The training procedure is the same as in A, except for pre-injection of vehicle instead of retinal. In the 14-day test, TG mice did not show the significant novel object preference (p > 0.1, paired t-test, eight strong TG mice). (D) Transient activation with DPCPX protocol. The training procedure is the same as in A, except for additional adenosine A1R antagonist DPCPX pre-treatment. In the presence of DPCPX, the transient LED illuminations did not induce the novel object preference 14 days later (p > 0.82 and p > 0.82, paired t-test, nine WT mice and nine strong TG mice), whereas novel object preference was expressed 1 day after familiarization (p < 0.02 and p < 0.04, paired t-test, 9 WT mice and nine strong TG mice). *p < 0.05, **p < 0.01, ***p < 0.001.

References

    1. Adamsky A., Kol A., Kreisel T., Doron A., Ozeri-Engelhard N., Melcer T., et al. . (2018). Astrocytic activation generates de novo neuronal potentiation and memory enhancement. Cell 174, 59–71.e14. 10.1016/j.cell.2018.05.002 - DOI - PubMed
    1. Agster K. L., Mejias-Aponte C. A., Clark B. D., Waterhouse B. D. (2013). Evidence for a regional specificity in the density and distribution of noradrenergic varicosities in rat cortex. J. Comp. Neurol. 521, 2195–2207. 10.1002/cne.23270 - DOI - PMC - PubMed
    1. Agulhon C., Boyt K. M., Xie A. X., Friocourt F., Roth B. L., McCarthy K. D. (2013). Modulation of the autonomic nervous system and behaviour by acute glial cell Gq protein-coupled receptor activation in vivo. J. Physiol. 591, 5599–5609. 10.1113/jphysiol.2013.261289 - DOI - PMC - PubMed
    1. Agulhon C., Fiacco T. A., McCarthy K. D. (2010). Hippocampal short- and long-term plasticity are not modulated by astrocyte Ca2+ signaling. Science 327, 1250–1254. 10.1126/science.1184821 - DOI - PubMed
    1. Agulhon C., Sun M.-Y., Murphy T., Myers T., Lauderdale K., Fiacco T. A. (2012). Calcium signaling and gliotransmission in normal vs. reactive astrocytes. Front. Pharmacol. 3:139. 10.3389/fphar.2012.00139 - DOI - PMC - PubMed

Publication types

LinkOut - more resources