. 2021 Mar 22:12:653100.
doi: 10.3389/fimmu.2021.653100. eCollection 2021.

Microtubules and Dynein Regulate Human Neutrophil Nuclear Volume and Hypersegmentation During H. pylori Infection

Affiliations

Microtubules and Dynein Regulate Human Neutrophil Nuclear Volume and Hypersegmentation During H. pylori Infection

Stephanie L Silva-Del Toro et al. Front Immunol. .

Abstract

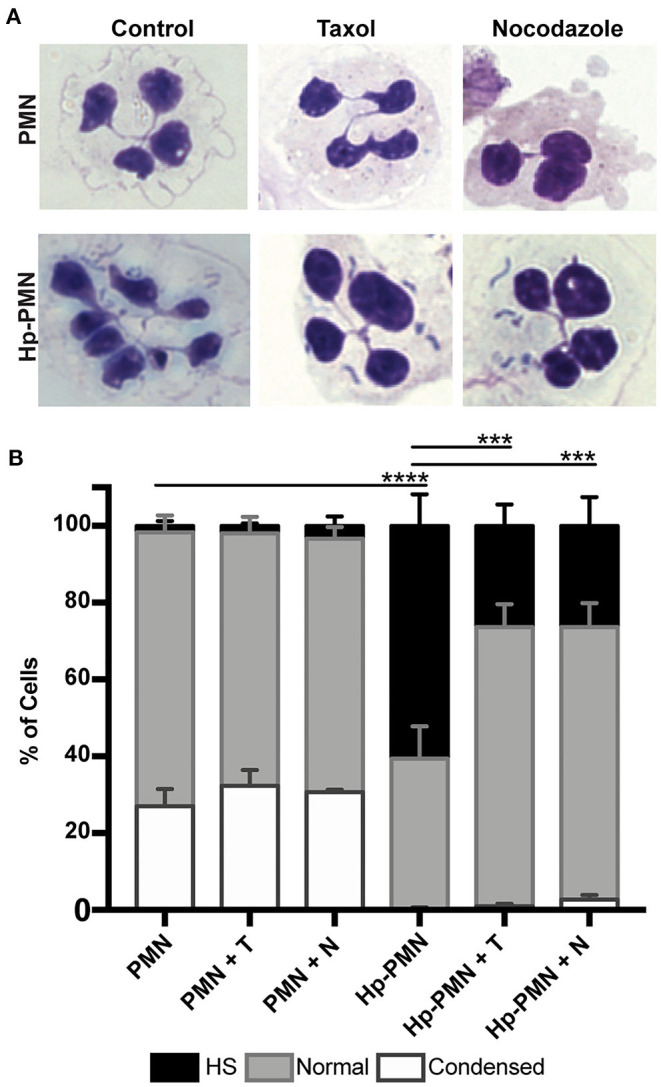
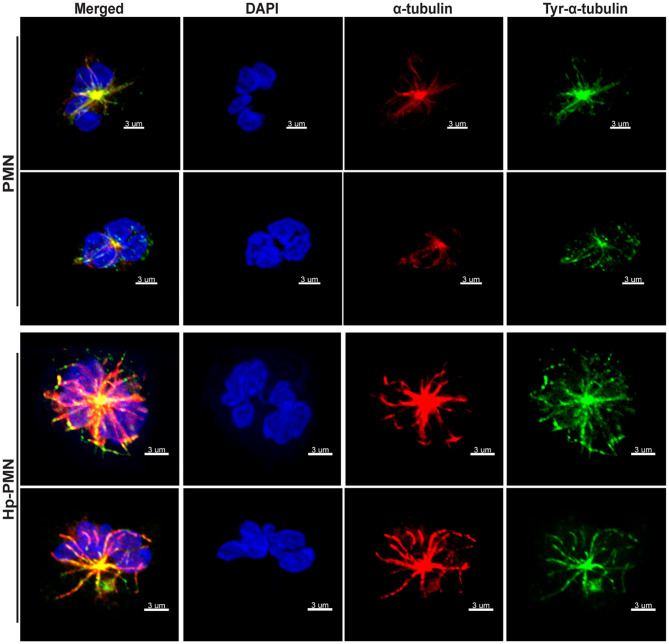
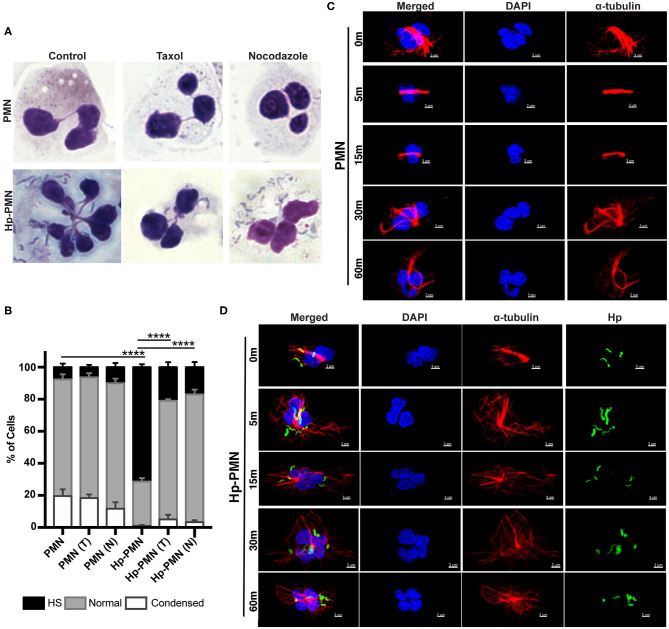
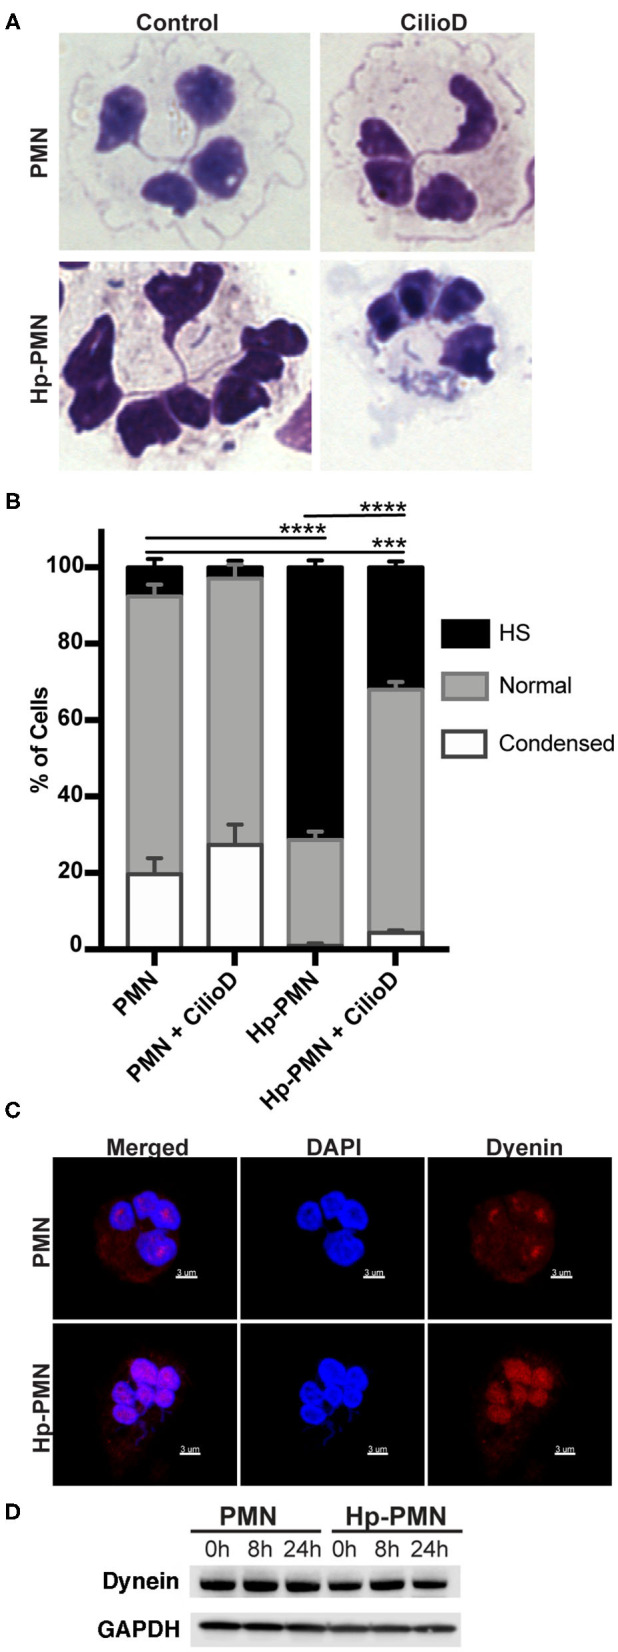
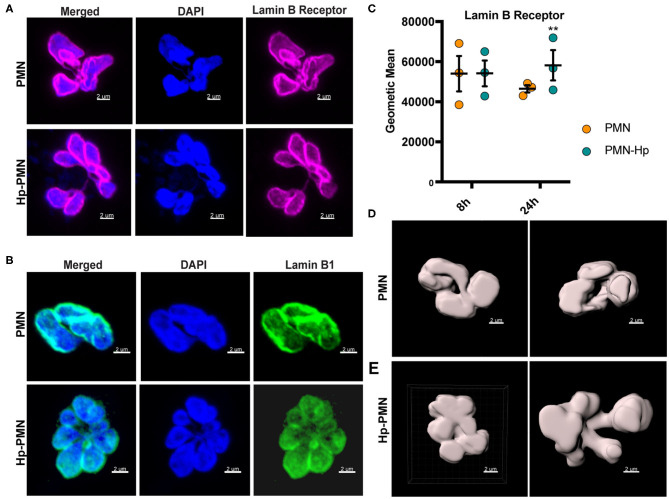
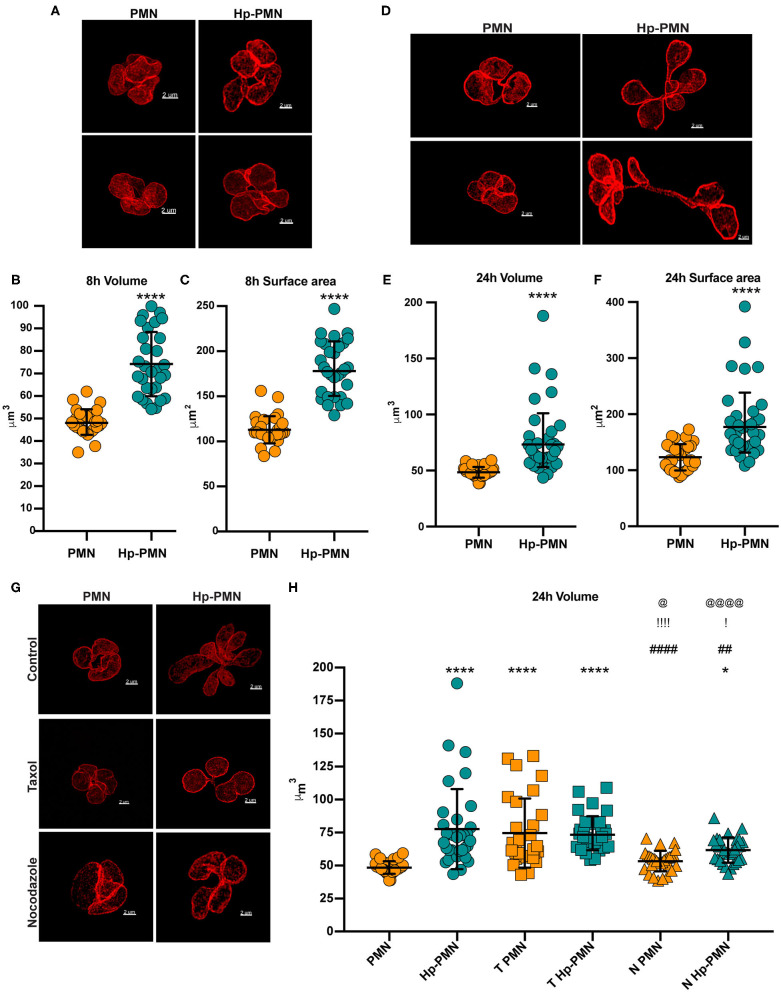
Neutrophils (also called polymorphonuclear leukocytes, PMNs) are heterogeneous and can exhibit considerable phenotypic and functional plasticity. In keeping with this, we discovered previously that Helicobacter pylori infection induces N1-like subtype differentiation of human PMNs that is notable for profound nuclear hypersegmentation. Herein, we utilized biochemical approaches and confocal and super-resolution microscopy to gain insight into the underlying molecular mechanisms. Sensitivity to inhibition by nocodazole and taxol indicated that microtubule dynamics were required to induce and sustain hypersegmentation, and super-resolution Stimulated Emission Depletion (STED) imaging demonstrated that microtubules were significantly more abundant and longer in hypersegmented cells. Dynein activity was also required, and enrichment of this motor protein at the nuclear periphery was enhanced following H. pylori infection. In contrast, centrosome splitting did not occur, and lamin B receptor abundance and ER morphology were unchanged. Finally, analysis of STED image stacks using Imaris software revealed that nuclear volume increased markedly prior to the onset of hypersegmentation and that nuclear size was differentially modulated by nocodazole and taxol in the presence and absence of infection. Taken together, our data define a new mechanism of hypersegmentation that is mediated by microtubules and dynein and as such advance understanding of processes that regulate nuclear morphology.

Keywords: dynein; hypersegmentation; lamin B receptor; microtubules; neutrophils; plasticity.


Conflict of interest statement

The authors declare that the research was conducted in the absence of any commercial or financial relationships that could be construed as a potential conflict of interest.

Figures

Figure 1
Figure 1
Microtubule dynamics are required for H. pylori-induced hypersegmentation. Human PMNs were infected with H. pylori (Hp) and/or treated with taxol (T) or nocodazole (N) for 24 h. Cells were attached to coverslips by cytocentrifugation and immediately stained with Hema-3 reagents. (A) Representative light microscopy images of treated and control PMNs (x1,000 original magnification). (B) Nuclei were scored as hypersegmented (HS, 5, or more lobes), normal (3-4 lobes), or condensed (1-2 lobes). Pooled data are the mean + standard error of the mean from three independent experiments. ***P ≤ 0.001 and ****P ≤ 0.0001 by two-way ANOVA with Tukey's multiple comparison test indicate differences in hypersegmentation.
Figure 2
Figure 2
MTs appear to be more abundant in infected PMNs and tyrosination is prevalent throughout MTs independent of infection. Control and infected PMNs were analyzed by confocal microscopy at 24 h after triple-staining to detect DNA (DAPI, blue), α-tubulin (Alexa Fluor 549, red), and tyrosinated α-tubulin (FITC, green). Images are representative 3D reconstructions of confocal Z-stacks from three independent experiments. Scale bar = 3 μm (x1,000 original magnification).
Figure 3
Figure 3
MTs are more abundant and longer in infected PMNs. Infected and control PMNs were processed for analysis by STED at 24 h. (A) Representative 3D reconstructions of STED Z-stack images. Lamin B receptor (LBR) was detected using TRITC-conjugated secondary antibodies (red) and tyrosinated α-tubulin was detected using FITC-conjugated secondary antibodies (green). Scale bar = 3 μm (x1,000 original magnification). (B–E) MT length and abundance were quantified for 10 cells per donor and condition in each experiment. Graphs show the number of MTs radiating from the MTOC (B), average filament length (C), and longest MT in each cell (D). Data for individual cells (symbols) are shown along with the mean and standard deviation (n = 3). A Welsh t-test was done to determine significance. ****P ≤ 0.0001. (E) Representation of MT analysis. The red circle denotes 1 μm from the MTOC. Tubules that intersect this circle were counted (B). MTs in each image were traced using the Autodepth Filament feature of Imaris (C,D).
Figure 4
Figure 4
MT dynamics are required to sustain H. pylori-induced hypersegmentation. (A,B) Infected and uninfected PMNs were treated with taxol (T) or nocodazole (N) at 18 h. Representative images of Hema-3-stained cells are shown in (A) and pooled data are shown in (B). Nuclei were scored as hypersegmented (HS), normal or condensed as in Figure 1. Graph shows the mean + standard error of the mean, n = 3. Significant differences in hypersegmentation were detected using two-way ANOVA and Tukey's multiple comparison test. ****P ≤ 0.0001. (C,D) PMNs were treated with taxol in the presence and absence H. pylori at time zero. Taxol was removed at 18 h and the kinetics of MT rearrangement over 5-60 min at 37°C was analyzed using confocal microscopy. Representative images of uninfected PMNs (C) and infected PMNs (D) that were stained to detect DNA (DAPI, blue) and α-tubulin (Alexa Fluor 549, red) alone or together with H. pylori (Alexa Fluor 488, green), n = 3. Scale bar = 3 μm (x1,000 original magnification).
Figure 5
Figure 5
Dynein-mediated trafficking is required for hypersegmentation. (A,B) Cells were treated with 20 μM Ciliobrevin D for 24 h in the presence and absence of H. pylori. Nuclear morphology was scored by light microscopy after Hema-3 staining. Representative images (A) and pooled data (B) are shown. Graphs indicate the mean + standard error of the mean. Significant differences in hypersegmentation (HS) were determined using two-way ANOVA and Tukey's multiple comparison test. ***P ≤ 0.001, ****P ≤ 0.0001, n = 3. (C) Dynein localization shown in reconstructed confocal Z-stacks of cells stained with DAPI (blue) and anti-dynein antibodies (Alexa Fluor 549 secondary antibody, red). Scale bar = 3μm (x1,000 original magnification). (D) Dynein immunoblot of infected and uninfected cell lysates at 0, 8, and 24 h timepoints and the loading control GAPDH.
Figure 6
Figure 6
H. pylori has no apparent effect LBR and lamin B1 localization or LBR abundance. (A,B) LBR (A) and Lamin B1 (B) confocal Z-stack reconstructions of uninfected and infected PMNs at 24 h. DAPI was used to detect DNA (blue), Alexa Fluor 647-conjugated secondary antibodies were used to visualize LBR (magenta), Alexa Fluor 488-conjugated secondary antibodies were used to visualize lamin B1 (green). (C) LBR in control and infected PMNs at 8 and 24 h was quantified using flow cytometry. Geometric mean fluorescence and standard error of the mean are shown. Two-way ANOVA and Tukey's multiple comparison test were used to determine significance. **P ≤ 0.01, n = 3. (D,E) LBR STED reconstruction and nuclear periphery tracing for surface rendering used to quantify nuclear volume in Figure 7. (D) Two views of a single uninfected PMN. (E) Two different infected cells. Scale bar = 2 μm (x1,000 original magnification).
Figure 7
Figure 7
H. pylori infection and microtubule dynamics alter nuclear volume. Uninfected and infected PMNs were stained to detect LBR (red) after 8 h (A–C) or 24 h (D–H). As indicated in (G,H), cells were also treated with taxol (T) or nocodazole (N) at time zero. (A,D,G) Representative 3D reconstructions of STED Z-stacks. Scale bar = 2μm (x1,000 original magnification). Quantification of nuclear volume (B,E,H) and surface area (C,F) were done by tracing the nuclear periphery on each stack using the volume Imaris extension as shown in Figure 6D (see also Supplementary Videos 5, 6). Ten cells were analyzed per donor, per condition. n = 3. Graphs show the mean ± SD along with data for individual cells. Statistical significance was determined by two-way ANOVA and Tukey's multiple comparison test. ****P ≤ 0.0001 and *P ≤ 0.05 vs. PMN. ####P ≤ 0.0001 and ##P ≤ 0.01 vs. Hp-PMN. !!!!P ≤ 0.0001 and !P ≤ 0.05 vs. T- PMN. @@@@P < 0.0001, @P ≤ 0.05 vs. T Hp-PMN.

Similar articles

Cited by

References

    1. Nauseef WM, Borregaard N. Neutrophils at work. Nat Immunol. (2014) 15:602–11. 10.1038/ni.2921 - DOI - PubMed
    1. Nauseef WM. Neutrophils, from cradle to grave and beyond. Immunol Rev. (2016) 273:5–10. 10.1111/imr.12463 - DOI - PMC - PubMed
    1. Kruger P, Saffarzadeh M, Weber AN, Rieber N, Radsak M, von Bernuth H, et al. . Neutrophils: Between host defence, immune modulation, tissue injury. PLoS Pathog. (2015) 11:e1004651. 10.1371/journal.ppat.1004651 - DOI - PMC - PubMed
    1. Beyrau M, Bodkin JV, Nourshargh S. Neutrophil hetergeneity in health and disease: a revitalized avenue in inflammation and immunity. Open Biol. (2012) 2:120134. 10.1098/rsob.120134 - DOI - PMC - PubMed
    1. Fridlender ZG, Sun J, Kinm S, Kapoor V, Cheng G, Ling L, et al. . Polarization of tumor-associated neutrophil phenotype by TGF-beta: “N1” versus “N2” TAN. Cancer Cell. (2009) 16:183–94. 10.1016/j.ccr.2009.06.017 - DOI - PMC - PubMed

Publication types

MeSH terms