. 2021 Mar 22:11:620295.
doi: 10.3389/fonc.2021.620295. eCollection 2021.

miR-135a Reduces Osteosarcoma Pulmonary Metastasis by Targeting Both BMI1 and KLF4

Affiliations

miR-135a Reduces Osteosarcoma Pulmonary Metastasis by Targeting Both BMI1 and KLF4

Chenglong Chen et al. Front Oncol. .

Abstract

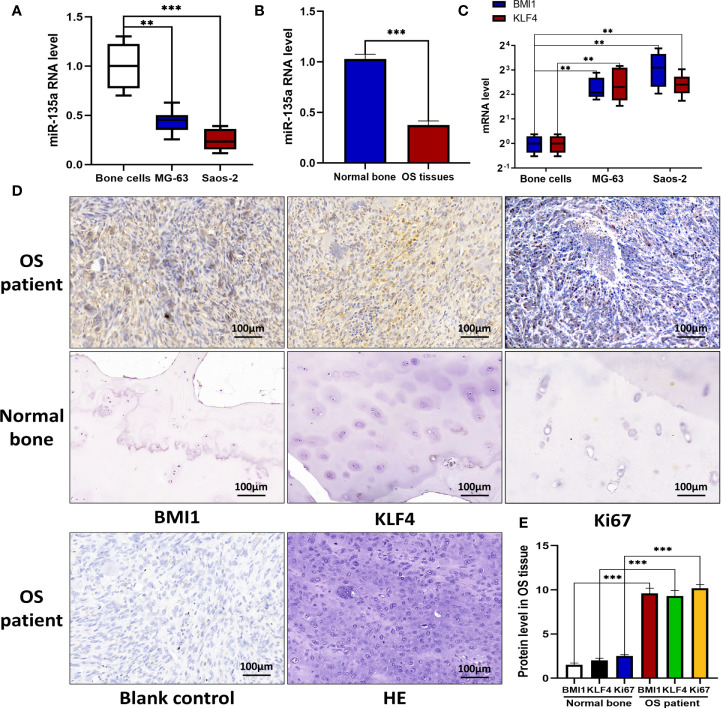
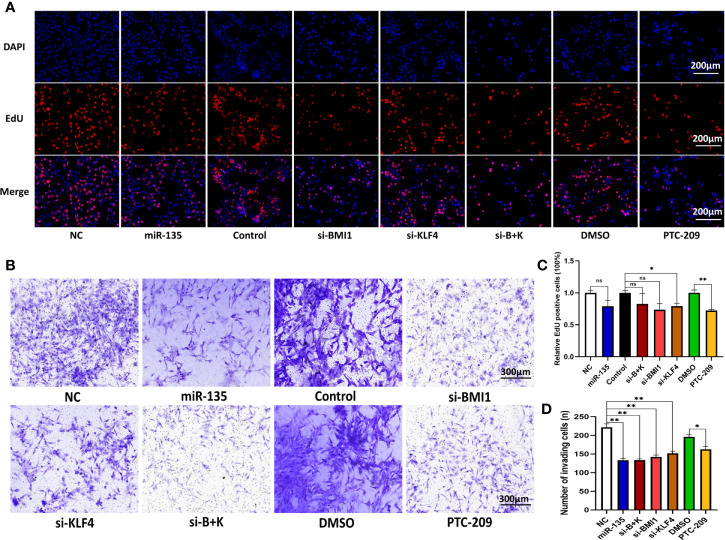
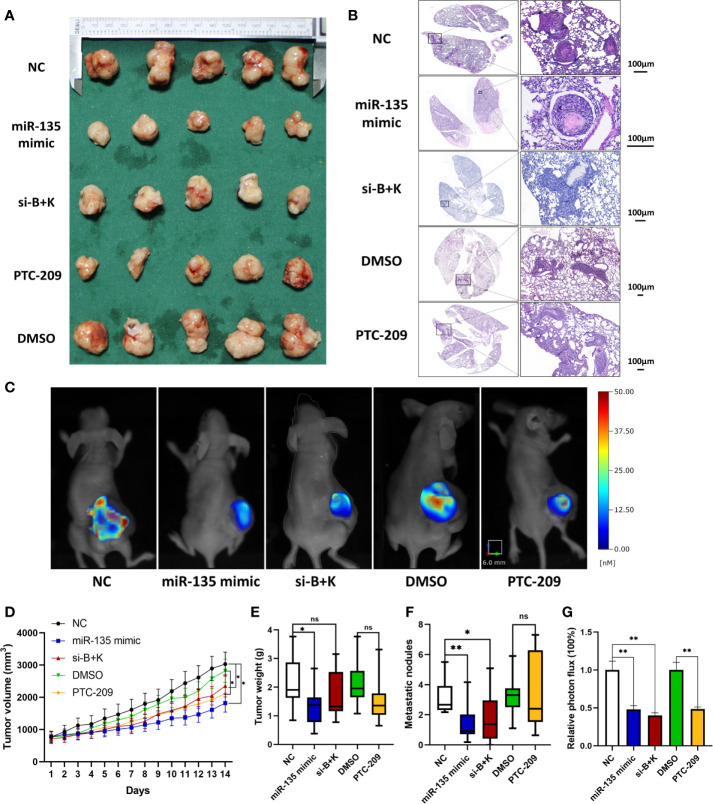
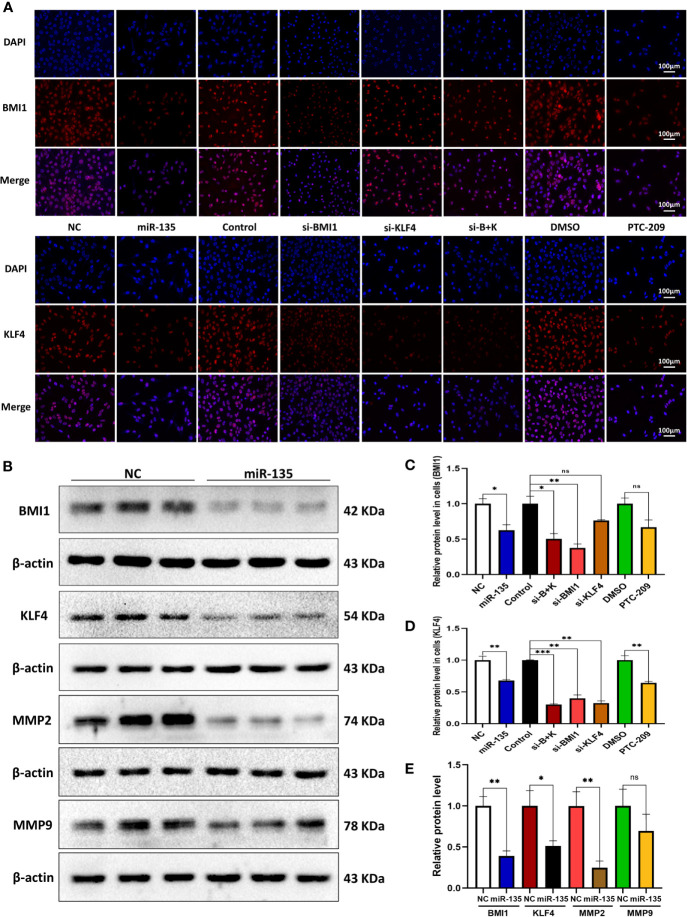
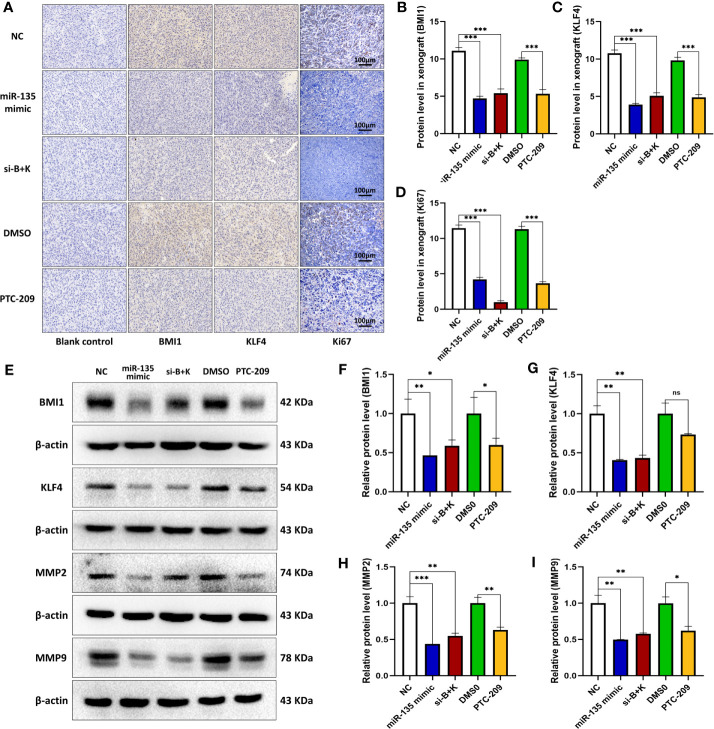
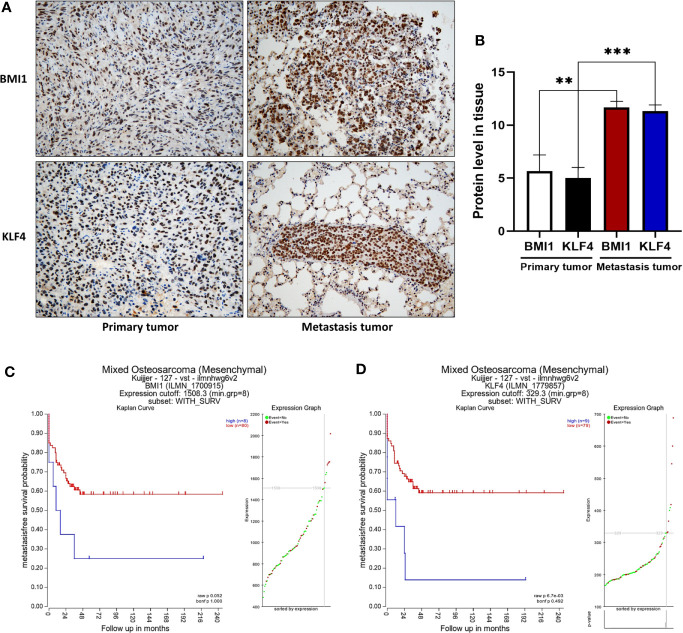
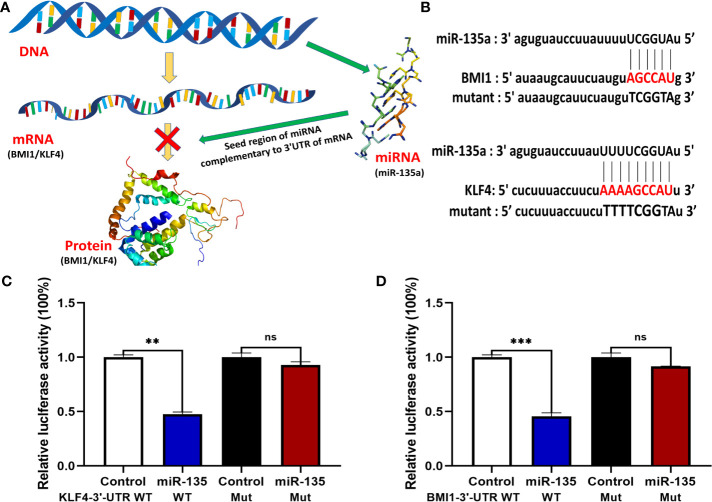
Because of the modest response rate after surgery and chemotherapy, treatment of osteosarcoma (OS) remains challenging due to tumor recurrence and metastasis. miR-135a has been reported to act as an anticarcinogenic regulator of several cancers. However, its expression and function in osteosarcoma remain largely unknown. Here, we reported that abridged miR-135a expression in OS cells and tissues, and its expression is inversely correlated with the expression of BMI1 and KLF4, which are described as oncogenes in several cancers. Ectopic expression of miR-135a inhibited cell invasion and expression of BMI1 and KLF4 in OS cells. In vivo investigation confirmed that miR-135a acts as a tumor suppressor in OS to inhibit tumor growth and lung metastasis in xenograft nude mice. BMI1 and KLF4 were revealed to be direct targets of miR-135a, and miR-135a had a similar effect as the combination of si-BMI1 and si-KLF4 on inhibiting tumor progression and the expression of BMI1 and KLF4 in vivo. Altogether, our results demonstrate that the targeting of BMI1/KLF4 with miR-135a may provide an applicable strategy for exploring novel therapeutic approaches for OS.

Keywords: BMI1; KLF4; metastasis; microRNA; osteosarcoma.


Conflict of interest statement

The authors declare that the research was conducted in the absence of any commercial or financial relationships that could be construed as a potential conflict of interest.

Figures

Figure 1
Figure 1
Downregulation of miR-135a and upregulation of BMI1 and KLF4 in OS cell lines and tissues. (A) RT-qPCR. OS cell lines Saos-2 and MG-63, and primary normal bone cells (osteoblasts) were grown and then subjected to RT-qPCR analysis. The results showed that endogenous miR-135a expression was decreased in Saos-2 and MG63 cells when compared to osteoblasts (**p < 0.01; ***p < 0.001; n=3). (B) RT-qPCR. Levels of endogenous miR-135a expression was decreased in OS tissues when compared to normal bone (***p < 0.001; n=3). (C) RT-qPCR. Levels of BMI1 and KLF4 mRNA were higher in Saos-2 and MG63 cell lines compared with osteoblasts (**p < 0.01; n=3). (D) Immunohistochemistry. Human OS and normal bone tissues were collected and subjected to immunohistochemical analysis. Scale bar, 100 μm. (E) The graph represents quantified data of the immunohistochemistry (***p < 0.001; n = 10). All the data from qPCR were expressed as the mean ± SEM.
Figure 2
Figure 2
Downregulating of KLF4 and using PTC-209 suppress the OS cell proliferation; miR-135a, si-BMI1, si-KLF4, combination therapy, and PTC-209 suppress the OS cell invasion. (A) Representative pictures from tumor cell EdU assay. Saos-2 cells were grown and transfected with Lv-miR-135a or negative controls, si-BMI1/KLF4 or their control, and treatment with PTC-209 or DMSO, and then subjected to the EdU assay. Scale bar, 200 μm. (B) Representative pictures from transwell invasion assay. The Saos-2 cells with same treatments as above were subjected to the transwell assay. Scale bar, 300 μm. (C) The graph is the quantified data of the EdU assay (ns p > 0.05; *p < 0.05; **P < 0.01; n = 3). (D) The graph is the quantified data of the transwell invasion assay (*p < 0.05; **p < 0.01; n = 3). The data were expressed as the mean ± SEM. NC (Lentivirus negative control), miR-135 (Lentivirus overexpressed miR-135a), Control (siRNA negative control), si-BMI1 (group interfered with siRNA-BMI1), KLF4 (group interfered with siRNA-KLF4), si-B+K (group interfered with siRNA-BMI1 and siRNA-KLF4). ns, not significant.
Figure 3
Figure 3
miR-135a, combination therapy, and PTC-209 suppression of mouse OS cell xenograft growth; miR-135a and combination therapy suppression of lung metastasis in vivo. (A) Xenograft photographs. Saos-2 cells were grown and injected into nude mice, and then treat mice with miR-135 mimic, si-B+K, negative control, PTC-209, and DMSO respectively. After 2 weeks, the mice were sacrificed and the xenografts were photographed. (B) HE staining of mouse lung tissues. The mice were sacrificed and the lungs were resected and subjected to tissue processing, embedding, sectioning, and HE staining to quantify tumor cell lung metastasis. Scale bar, 100 μm. (C) Bioimages. Before sacrificed, mice were subjected to bioimaging of the MMPs activity in xenograft tumors with the fluorescence molecular tomography using MMPSense 680. (D) Growth curves of mouse OS cell xenografts. (*p < 0.05; **p < 0.01; n = 10). The significance of differences among groups were analyzed by ANOVA test and the effects were corrected using the Greenhouse–Geisser method in tumor volume because the data did not meet the hypothesis of sphericity (Mauchly’s test statistic W=0.000, p < 0.001). (E) Weight of mouse OS cell xenografts. (*p < 0.05; ns p >0.05; n = 10). (F) The graph of the quantified data of metastatic nodules. (ns p > 0.05; *p < 0.05; **p < 0.01; n = 10). (G) The graph of the quantified data of MMPs activity in xenograft tumors. (**p < 0.01; n = 5). ns, not significant.
Figure 4
Figure 4
miR-135a, si-BMI1, si-KLF4, combination treatment, and PTC-209 inhibit BMI1 and KLF4 expression in OS cells. (A) Representative pictures from tumor cell immunofluorescence assay. The Saos-2 cells with same treatments as above were subjected to the immunofluorescence assay. Scale bar, 100 μm. (B) Western blot. Saos-2 cells were grown and transfected with Lv-miR-135a or negative controls and then subjected to the protein extraction and western blot. (C, D) The graphs were the quantified data of immunofluorescence staining of BMI1 and KLF4. (ns p > 0.05; *p < 0.05; **p < 0.01; n = 3). Quantitation was performed by analyzing the positive cells in relation to DAPI. (E) The graph is the quantified data of the western blot. (ns p > 0.05; *p < 0.05; **p < 0.01; n = 3). The data were expressed as the mean ± SEM. NC (Lentivirus negative control), miR-135 (Lentivirus overexpressed miR-135a), Control (siRNA negative control), si-BMI1 (group interfered with siRNA-BMI1), KLF4 (group interfered with siRNA-KLF4), si-B+K (group interfered with siRNA-BMI1 and siRNA-KLF4). ns, not significant.
Figure 5
Figure 5
miR-135a, combination therapy, and PTC-209 suppression of BMI1 and KLF4 in mouse OS cell xenografts. (A) Immunohistochemistry. The mouse OS cell xenografts were resected from the nude mice and subjected to tissue processing, embedding, sectioning, and immunohistochemistry. Scale bar, 100 μm. (B–D) The graph of the quantified data of immunohistochemical staining of BMI1, KLF4, and Ki67. (***p < 0.001; n = 10). (E) Western blot. The mouse OS cell xenografts were resected from the nude mice and subjected to protein extraction and western blot. (E–I) The graph of the quantified data of the western blots (ns p>0.05; *p <0.05; **p < 0.01; ***p < 0.001; n = 3). The data were expressed as the mean ± SEM. ns, not significant.
Figure 6
Figure 6
Positive BMI1 and KLF4 expression are associated with OS metastasis, and predicted a short survival time in patients. (A) Immunohistochemistry. The mouse OS cell xenografts and lung tissues were resected from the nude mice and subjected to tissue processing, embedding, sectioning, and immunohistochemistry (magnification, ×40). (B) The graph of the quantified data of immunohistochemical staining of BMI1 and KLF4. (**p < 0.01; ***p < 0.001; n = 3). (C, D) Kaplan-Meier analyses. BMI1 and KLF4 expression in OS was analyzed to predict the prognosis of OS patients by using Kaplan-Meier method on R2: Genomics Analysis and Visualization Platform. (p > 0.05; ** p < 0.01; C, D). The data were expressed as the mean ± SEM.
Figure 7
Figure 7
miR-135a targeting of BMI1 and KLF4 expression in OS cells. (A) A schematic diagram illustrated how miR-135a inhibited OS progression by targeting BMI1 and KLF4 pathway. (B) Bioinformatic analysis of miR-135a targeting of BMI1 and KLF4 3′-UTR. (C, D) Luciferase reporter assay. Saos-2 cells were grown and cotransfected with 10 nM of miR-135a mimic or control miR-NC and with 0.25 lg per/well of plasmids containing the 3′-UTR of BMI1 and KLF4 or their mutants using Lipofectamine 3000 for 2 days and then subjected to luciferase reporter assay. (ns p >0.05; **p < 0.01; ***p < 0.001; n = 3). The data were expressed as the mean ± SEM. ns, not significant.

Similar articles

Cited by

References

    1. Siegel RL, Miller KD, Jemal A. Cancer statistics, 2018. CA: Cancer J Clin (2018) 68:7–30. 10.3322/caac.21442 - DOI - PubMed
    1. Sakamoto A, Iwamoto Y. Current status and perspectives regarding the treatment of osteo-sarcoma: chemotherapy. Rev Recent Clin Trials (2008) 3:228–31. 10.2174/157488708785700267 - DOI - PMC - PubMed
    1. Brown HK, Tellez-Gabriel M, Heymann D. Cancer stem cells in osteosarcoma. Cancer Lett (2017) 386:189–95. 10.1016/j.canlet.2016.11.019 - DOI - PubMed
    1. Kager L, Zoubek A, Pötschger U, Kastner U, Flege S, Kempf-Bielack B, et al. . Primary metastatic osteosarcoma: presentation and outcome of patients treated on neoadjuvant Cooperative Osteosarcoma Study Group protocols. J Clin Oncol (2003) 21:2011–8. 10.1200/JCO.2003.08.132 - DOI - PubMed
    1. Berhe S, Danzer E, Meyers P, Behr G, LaQuaglia MP, Price AP. Unusual abdominal metastases in osteosarcoma. J Pediatr Surg Case Rep (2018) 28:13–6. 10.1016/j.epsc.2017.09.022 - DOI - PMC - PubMed

LinkOut - more resources