

Determining Trap Compliances, Microsphere Size Variations, and Response Linearities in Single DNA Molecule Elasticity Measurements with Optical Tweezers
- PMID: 33829038
- PMCID: PMC8019724
- DOI: 10.3389/fmolb.2021.605102
Determining Trap Compliances, Microsphere Size Variations, and Response Linearities in Single DNA Molecule Elasticity Measurements with Optical Tweezers
Abstract
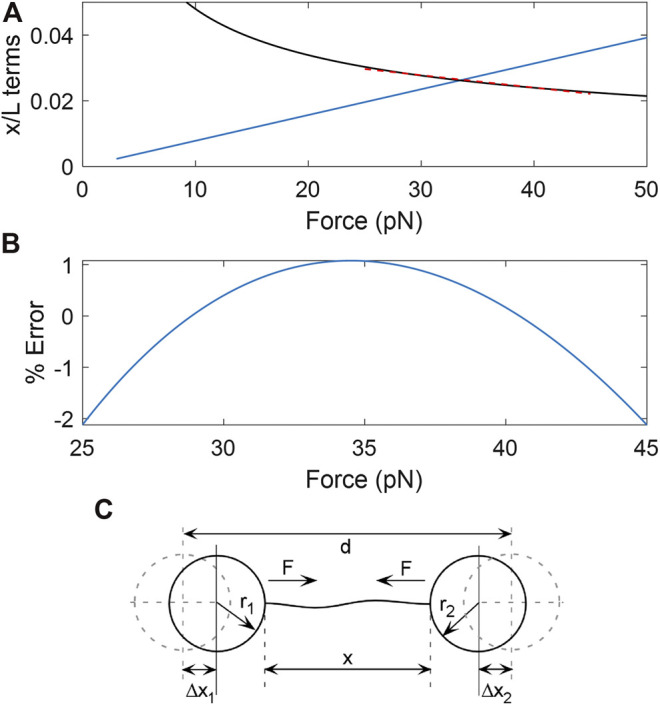
We previously introduced the use of DNA molecules for calibration of biophysical force and displacement measurements with optical tweezers. Force and length scale factors can be determined from measurements of DNA stretching. Trap compliance can be determined by fitting the data to a nonlinear DNA elasticity model, however, noise/drift/offsets in the measurement can affect the reliability of this determination. Here we demonstrate a more robust method that uses a linear approximation for DNA elasticity applied to high force range (25-45 pN) data. We show that this method can be used to assess how small variations in microsphere sizes affect DNA length measurements and demonstrate methods for correcting for these errors. We further show that these measurements can be used to check assumed linearities of system responses. Finally, we demonstrate methods combining microsphere imaging and DNA stretching to check the compliance and positioning of individual traps.
Keywords: DNA elasticity; calibration; force; laser tweezers; microsphere size; optical trap; single-molecule; trap stiffness.
Copyright © 2021 Mo, Fizari, Koharchik and Smith.
Conflict of interest statement
The authors declare that the research was conducted in the absence of any commercial or financial relationships that could be construed as a potential conflict of interest.
Figures


Similar articles
-
Force spectroscopy with dual-trap optical tweezers: molecular stiffness measurements and coupled fluctuations analysis.Biophys J. 2012 Nov 7;103(9):1919-28. doi: 10.1016/j.bpj.2012.09.022. Biophys J. 2012. PMID: 23199920 Free PMC article.
-
Stretching short sequences of DNA with constant force axial optical tweezers.J Vis Exp. 2011 Oct 13;(56):e3405. doi: 10.3791/3405. J Vis Exp. 2011. PMID: 22025209 Free PMC article.
-
Calibration of dynamic holographic optical tweezers for force measurements on biomaterials.Opt Express. 2008 Dec 8;16(25):20987-1003. doi: 10.1364/oe.16.020987. Opt Express. 2008. PMID: 19065239
-
Axial Optical Traps: A New Direction for Optical Tweezers.Biophys J. 2015 Jun 16;108(12):2759-66. doi: 10.1016/j.bpj.2015.05.014. Biophys J. 2015. PMID: 26083913 Free PMC article. Review.
-
Optical tweezers stretching of chromatin.J Muscle Res Cell Motil. 2002;23(5-6):397-407. doi: 10.1023/a:1023450204528. J Muscle Res Cell Motil. 2002. PMID: 12785093 Review.
Cited by
-
Methods for Studying Motor-Driven Viral DNA Packaging in Bacteriophages phi29, Lambda, and T4 via Single DNA Molecule Manipulation and Rapid Solution Exchange.Methods Mol Biol. 2025;2881:293-327. doi: 10.1007/978-1-0716-4280-1_15. Methods Mol Biol. 2025. PMID: 39704950
References
-
- Berg-Sørensen K., Flyvbjerg H. (2004). Power spectrum analysis for optical tweezers. Rev. Scientific Instr. 75, 594–612. 10.1063/1.1645654 - DOI
LinkOut - more resources
Full Text Sources
Other Literature Sources