. 2021 Mar 18:2021:6648182.
doi: 10.1155/2021/6648182. eCollection 2021.

L Antigen Family Member 3 Serves as a Prognostic Biomarker for the Clinical Outcome and Immune Infiltration in Skin Cutaneous Melanoma

Affiliations

L Antigen Family Member 3 Serves as a Prognostic Biomarker for the Clinical Outcome and Immune Infiltration in Skin Cutaneous Melanoma

Jingjing Song et al. Biomed Res Int. .

Abstract

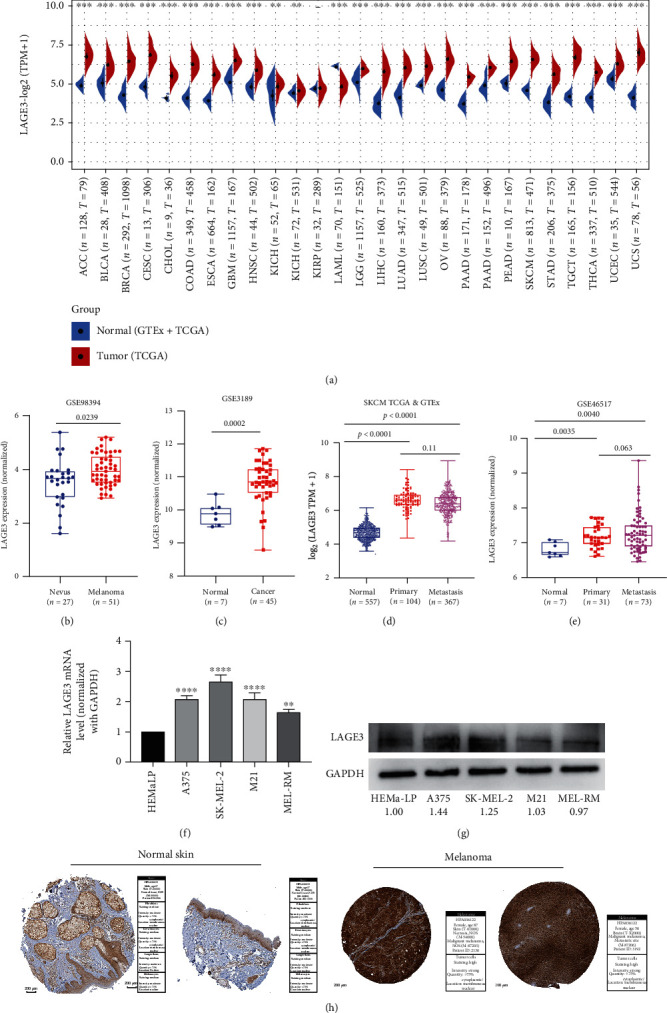
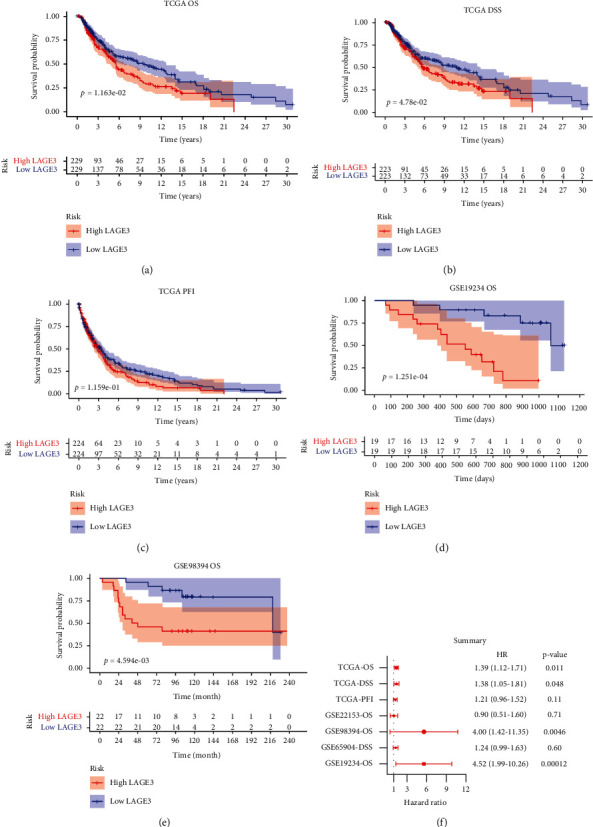
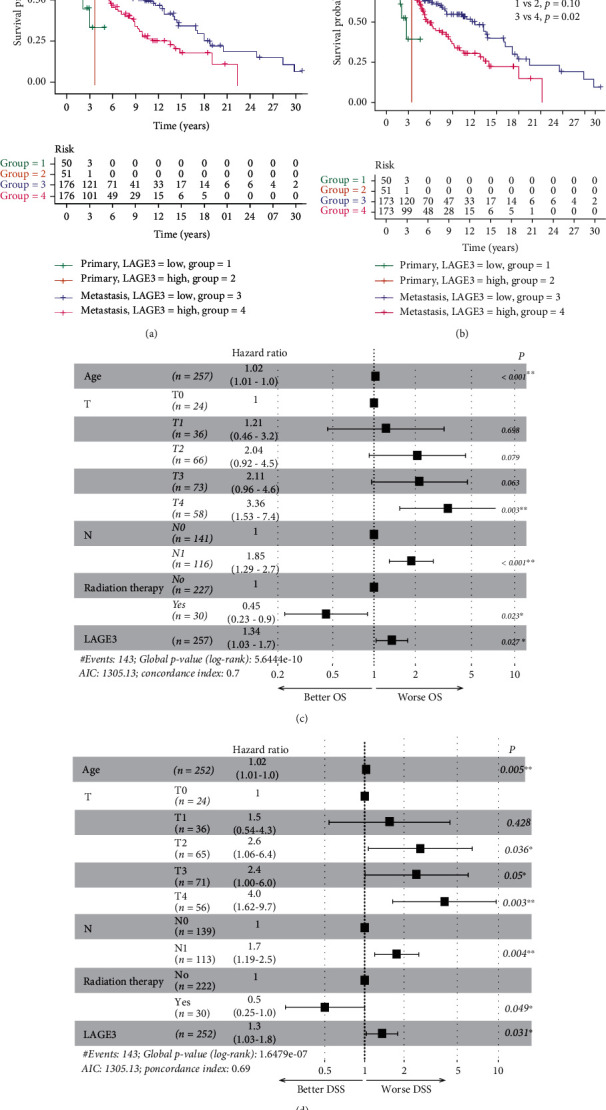
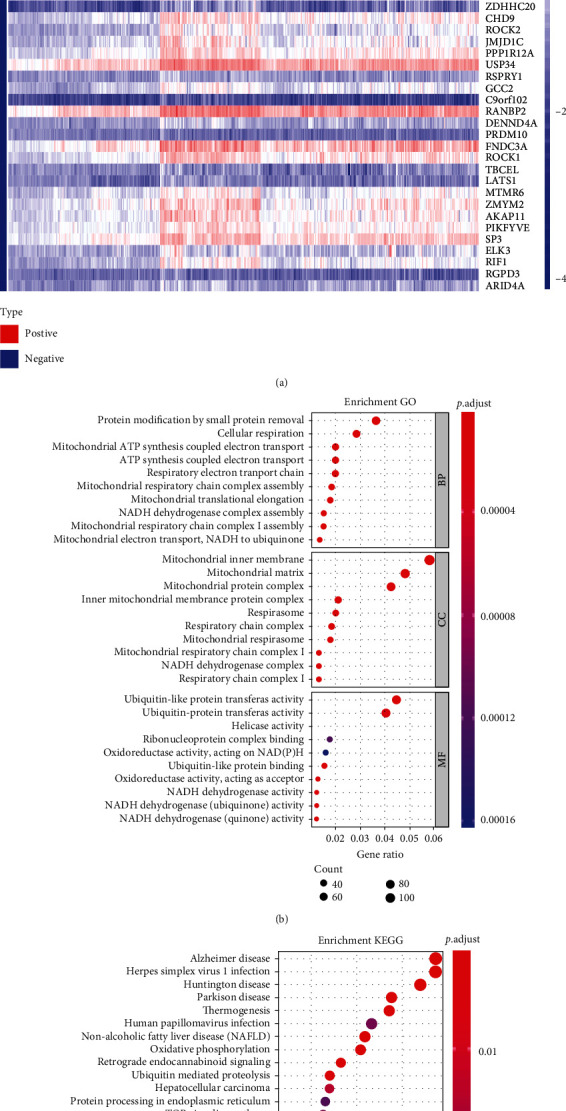
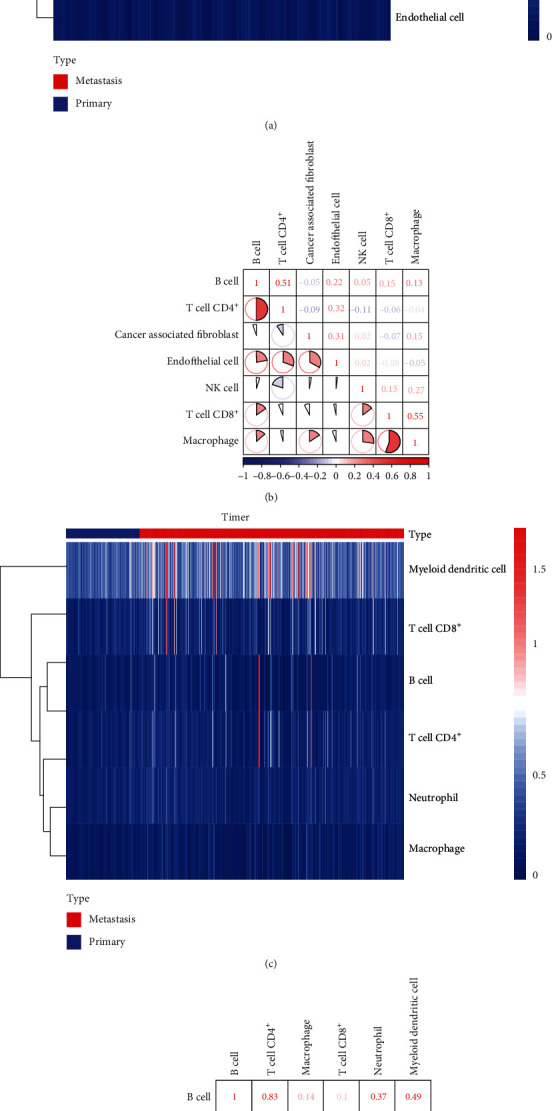
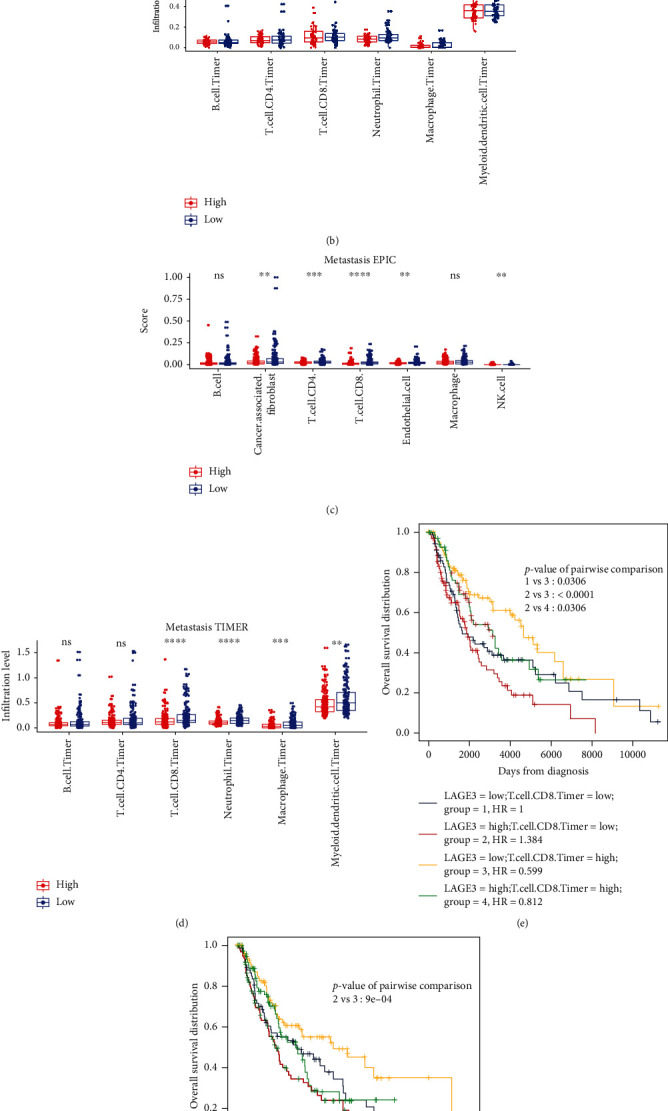
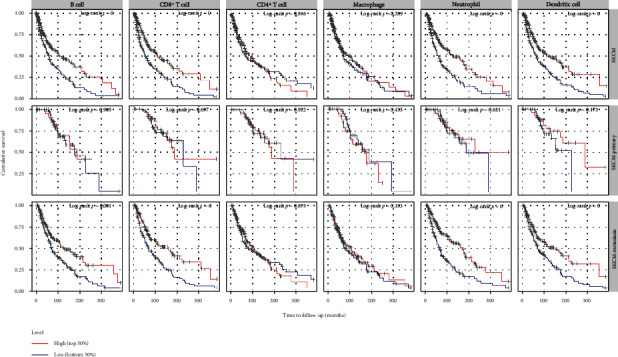
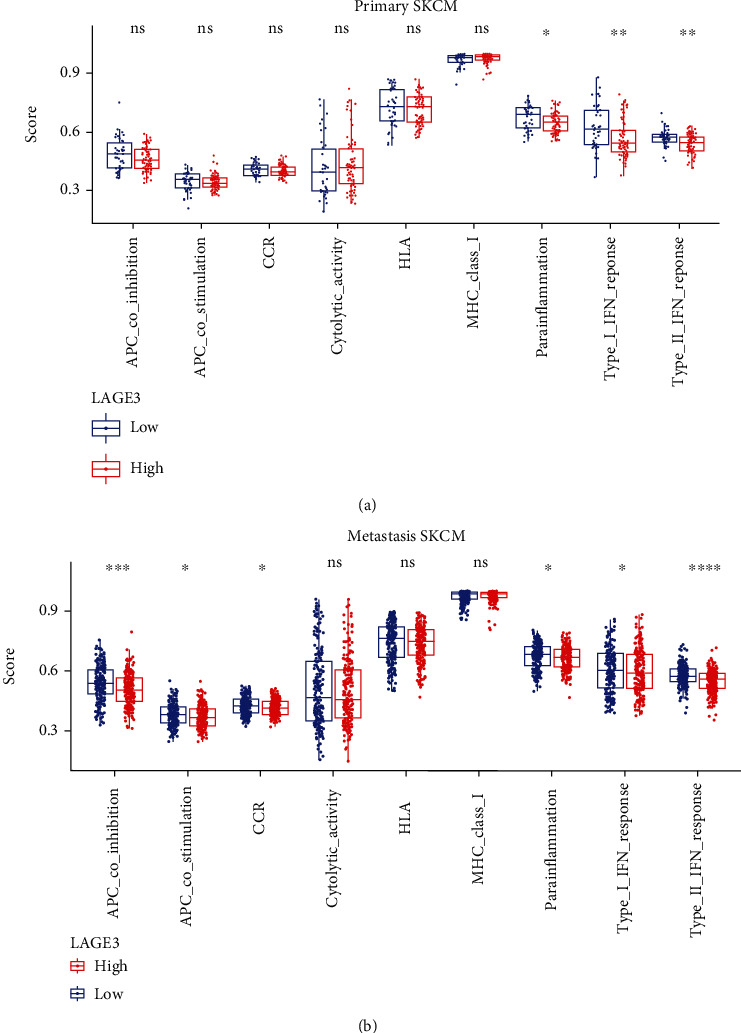
L Antigen Family Member 3 (LAGE3) is an important RNA modification-related protein. Whereas few studies have interrogated the LAGE3 protein, there is limited data on its role in tumors. Here, we analyzed and profiled the LAGE3 protein in skin cutaneous melanoma (CM) using TCGA, GTEx, or GEO databases. Our data showed an upregulation of LAGE3 in melanoma cell lines compared to normal skin cell lines. Besides, the Kaplan-Meier curves and Cox proportional hazard model revealed that LAGE3 was an independent survival indicator for CM, especially in metastatic CM. Moreover, LAGE3 was negatively associated with multiple immune cell infiltration levels in CM, especially CD8+ T cells in metastatic CM. Taken together, our study suggests that LAGE3 could be a potential prognostic biomarker and might be a potential target for the development of novel CM treatment strategies.


Conflict of interest statement

The authors declare that there is no conflict of interest regarding the publication of this paper.

Figures

Figure 1
Figure 1
Expression analysis of LAGE3. (a) The mRNA expression of LAGE3 between the tumor and normal tissues (ACC, BLCA, BRCA, CESC, CHOL, COAD, ESCA, GBM, HNSC, KICH, KIRC, KIRP, LAML, LGG, LIHC, LUAD, LUSC, OV, PAAD, PRAD, READ, SKCM, STAD, TGCT, THCA, UCEC, and UCS) was assessed using tissues from TCGA and GTEx. (b–e) LAGE3 mRNA expression levels by (b) GSE98394, (c) GSE3189, (d) TCGA combined with GTEx, and (e) GSE46517. ANOVA was used for comparisons between the different groups. (f, g) LAGE3 mRNA expression levels and protein expression levels in normal human epidermal melanocytes (HEMa-LP) and melanoma cell lines (A375, SK-MEL-2, M21, and MEL-RM). The numbers were the expression of LAGE3 protein relative to GAPDH, and the normal epidermal cell expression was set as 1. (h) Representative immunohistochemistry images and detailed information about LAGE3 in melanoma tissues and normal tissues using HPA. ACC: adrenocortical carcinoma; BLCA: bladder urothelial carcinoma; BRCA: breast invasive carcinoma; CESC: cervical squamous cell carcinoma and endocervical adenocarcinoma; CHOL: cholangiocarcinoma; COAD: colon adenocarcinoma; ESCA: esophageal carcinoma; GBM: glioblastoma multiforme; HNSC: head and neck squamous cell carcinoma; KICH: kidney chromophobe; KIRC: kidney renal clear cell carcinoma; KIRP: kidney renal papillary cell carcinoma; LAML: acute myeloid leukemia; LGG: brain lower grade glioma; LIHC: liver hepatocellular carcinoma; LUAD: lung adenocarcinoma; LUSC: lung squamous cell carcinoma; OV: ovarian serous cystadenocarcinoma; PAAD: pancreatic adenocarcinoma; PRAD: prostate adenocarcinoma; READ: rectum adenocarcinoma; SKCM: skin cutaneous melanoma; STAD: stomach adenocarcinoma; TGCT: testicular germ cell tumors; THCA: thyroid carcinoma; UCEC: uterine corpus endometrial carcinoma; UCS: uterine carcinosarcoma.
Figure 2
Figure 2
Kaplan–Meier plotter (log-rank test) and Cox regression analysis of the prognostic significance of LAGE3 in CM patients. (a–c) OS, DSS, and PFI survival curves between the LAGE3low and LAGE3high groups based on TCGA cohort. (d, e) OS curves between the LAGE3low and LAGE3high groups in the GSE19234 and GSE98394 cohorts. (f) Summary of multivariate Cox regression analysis of LAGE3 in different cohorts. OS: overall survival; DSS: disease-specific survival; PFI: progression-free interval.
Figure 3
Figure 3
Prognostic significance of LAGE3 in metastatic CM. (a) OS and (b) DSS curves by primary and metastatic TCGA-CM samples between the LAGE3low and LAGE3high groups. (c, d) Multivariate Cox regression analysis of OS and DSS in metastatic TCGA-CM samples.
Figure 4
Figure 4
Coexpressed genes and functional enrichment analysis of the LAGE3. (a) Upregulated and downregulated coexpressed genes significantly associated with LAGE3 expression (FDR < 0.001 and Cor > 0.4 or Cor < −0.4). (b) The top 10 enrichment GO results of the BP, CC, and MF categories. (c) The top 30 enrichment results of the KEGG signal pathway.
Figure 5
Figure 5
Correlation between TIICs in CM based on EPIC and TIMER. (a) The heat map shows the immune infiltration levels of the TIICs from the primary and metastatic TCGA-CM samples by EPIC. (b) The proportions of different TIIC subpopulations had a weak to medium correlation in tumor tissues by EPIC. (c) The heat map shows the immune infiltration levels of the TIICs from the primary and metastatic TCGA-CM samples by TIMER. (d) The proportions of different TIIC subpopulations had a weak to medium correlation in tumor tissues by TIMER. The redder color indicates a higher correlation, and the bluer color indicates a lower correlation.
Figure 6
Figure 6
Correlation between LAGE3 and TIICs in primary and metastatic CM. (a, b) The immune infiltration levels of the TIICs from the primary CM samples by EPIC and TIMER. The Mann–Whitney test was used in group analysis. (c, d) The immune infiltration levels of the TIICs from the metastatic CM samples by EPIC and TIMER. The Mann–Whitney test was used in group analysis. (e, f) Survival analysis for the high/low LAGE3-expression groups (metastatic melanoma) and high/low infiltration of CD8 T cell groups by EPIC and TIMER.
Figure 7
Figure 7
Correlation between expression levels plotted above or below the median of B cells, CD8+ T cells, CD4+ T cells, macrophages, neutrophils, and dendritic cells and primary, metastatic, and all CM patient cumulative survival.
Figure 8
Figure 8
Correlation between LAGE3 and immune-related functions in CM. (a, b) Immune gene sets show lower enrichment levels in the LAGE3high group than in the LAGE3low group in (a) primary and (b) metastatic CM. The Mann–Whitney test was used in group analysis.

Similar articles

Cited by

References

    1. Siegel R. L., Miller K. D., Jemal A. Cancer statistics, 2020. CA: a Cancer Journal for Clinicians. 2020;70(1):7–30. doi: 10.3322/caac.21590. - DOI - PubMed
    1. Schadendorf D., van Akkooi A. C. J., Berking C., et al. Melanoma. Lancet. 2018;392(10151):971–984. doi: 10.1016/s0140-6736(18)31559-9. - DOI - PubMed
    1. Patel A., Moyers J., Nagaraj G. Immunotherapy in metastatic melanoma: a sociodemographic analysis of the National Cancer Database. Journal of Clinical Oncology. 2020;38(5_Supplement):p. 87. doi: 10.1200/JCO.2020.38.5_suppl.87. - DOI
    1. Luke J. J., Flaherty K. T., Ribas A., Long G. V. Targeted agents and immunotherapies: optimizing outcomes in melanoma. Nature Reviews. Clinical Oncology. 2017;14(8):463–482. doi: 10.1038/nrclinonc.2017.43. - DOI - PubMed
    1. Weber J., Mandala M., del Vecchio M., et al. Adjuvant nivolumab versus ipilimumab in resected stage III or IV melanoma. New England Journal of Medicine. 2017;377(19):1824–1835. doi: 10.1056/NEJMoa1709030. - DOI - PubMed

MeSH terms