Process-property correlations in laser-induced graphene electrodes for electrochemical sensing
- PMID: 33829346
- PMCID: PMC8026455
- DOI: 10.1007/s00604-021-04792-3
Process-property correlations in laser-induced graphene electrodes for electrochemical sensing
Erratum in
-
Correction to: Process-property correlations in laser-induced graphene electrodes for electrochemical sensing.Mikrochim Acta. 2021 Jul 10;188(8):248. doi: 10.1007/s00604-021-04904-z. Mikrochim Acta. 2021. PMID: 34247304 Free PMC article. No abstract available.
Abstract
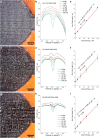
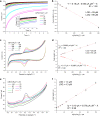
Laser-induced graphene (LIG) has emerged as a promising electrode material for electrochemical point-of-care diagnostics. LIG offers a large specific surface area and excellent electron transfer at low-cost in a binder-free and rapid fabrication process that lends itself well to mass production outside of the cleanroom. Various LIG micromorphologies can be generated when altering the energy input parameters, and it was investigated here which impact this has on their electroanalytical characteristics and performance. Energy input is well controlled by the laser power, scribing speed, and laser pulse density. Once the threshold of required energy input is reached a broad spectrum of conditions leads to LIG with micromorphologies ranging from delicate irregular brush structures obtained at fast, high energy input, to smoother and more wall like albeit still porous materials. Only a fraction of these LIG structures provided high conductance which is required for appropriate electroanalytical performance. Here, it was found that low, frequent energy input provided the best electroanalytical material, i.e., low levels of power and speed in combination with high spatial pulse density. For example, the sensitivity for the reduction of K3[Fe(CN)6] was increased almost 2-fold by changing fabrication parameters from 60% power and 100% speed to 1% power and 10% speed. These general findings can be translated to any LIG fabrication process independent of devices used. The simple fabrication process of LIG electrodes, their good electroanalytical performance as demonstrated here with a variety of (bio)analytically relevant molecules including ascorbic acid, dopamine, uric acid, p-nitrophenol, and paracetamol, and possible application to biological samples make them ideal and inexpensive transducers for electrochemical (bio)sensors, with the potential to replace the screen-printed systems currently dominating in on-site sensors used.
Keywords: Chemical sensor; Fabrication parameters; Laser-induced graphene; Porous carbon; Voltammetry.
Conflict of interest statement
The authors declare no competing interests.
Figures


Similar articles
-
Disposable Paper-Based Biosensors: Optimizing the Electrochemical Properties of Laser-Induced Graphene.ACS Appl Mater Interfaces. 2022 Jul 13;14(27):31109-31120. doi: 10.1021/acsami.2c06350. Epub 2022 Jun 29. ACS Appl Mater Interfaces. 2022. PMID: 35767835 Free PMC article.
-
Graphene Nanocomposite Ink Coated Laser Transformed Flexible Electrodes for Selective Dopamine Detection and Immunosensing.ACS Appl Bio Mater. 2024 May 20;7(5):3143-3153. doi: 10.1021/acsabm.4c00166. Epub 2024 Apr 25. ACS Appl Bio Mater. 2024. PMID: 38662615
-
Electrochemical multi-analyte point-of-care perspiration sensors using on-chip three-dimensional graphene electrodes.Anal Bioanal Chem. 2021 Jan;413(3):763-777. doi: 10.1007/s00216-020-02939-4. Epub 2020 Sep 28. Anal Bioanal Chem. 2021. PMID: 32989512 Free PMC article.
-
Laser-induced graphene (LIG)-driven medical sensors for health monitoring and diseases diagnosis.Mikrochim Acta. 2022 Jan 10;189(2):54. doi: 10.1007/s00604-021-05157-6. Mikrochim Acta. 2022. PMID: 35001163 Free PMC article. Review.
-
Laser-induced graphene-based electrochemical biosensors for environmental applications: a perspective.Environ Sci Pollut Res Int. 2023 Mar;30(15):42643-42657. doi: 10.1007/s11356-022-21035-x. Epub 2022 May 27. Environ Sci Pollut Res Int. 2023. PMID: 35622288 Review.
Cited by
-
Optimizing Carbon Structures in Laser-Induced Graphene Electrodes Using Design of Experiments for Enhanced Electrochemical Sensing Characteristics.ACS Appl Mater Interfaces. 2024 Nov 27;16(47):65489-65502. doi: 10.1021/acsami.4c13124. Epub 2024 Nov 14. ACS Appl Mater Interfaces. 2024. PMID: 39539231 Free PMC article.
-
Carbon nanomaterial hybrids via laser writing for high-performance non-enzymatic electrochemical sensors: a critical review.Anal Bioanal Chem. 2021 Oct;413(24):6079-6099. doi: 10.1007/s00216-021-03382-9. Epub 2021 May 12. Anal Bioanal Chem. 2021. PMID: 33978780 Free PMC article. Review.
-
Improving high throughput manufacture of laser-inscribed graphene electrodes via hierarchical clustering.Sci Rep. 2024 Apr 5;14(1):7980. doi: 10.1038/s41598-024-57932-z. Sci Rep. 2024. PMID: 38575717 Free PMC article.
-
Flash-Induced High-Throughput Porous Graphene via Synergistic Photo-Effects for Electromagnetic Interference Shielding.Nanomicro Lett. 2023 Aug 2;15(1):191. doi: 10.1007/s40820-023-01157-8. Nanomicro Lett. 2023. PMID: 37532956 Free PMC article.
-
Fabrication and Characterization of a Flexible Non-Enzymatic Electrochemical Glucose Sensor Using a Cu Nanoparticle/Laser-Induced Graphene Fiber/Porous Laser-Induced Graphene Network Electrode.Sensors (Basel). 2025 Apr 7;25(7):2341. doi: 10.3390/s25072341. Sensors (Basel). 2025. PMID: 40218852 Free PMC article.
References
-
- Taleat Z, Khoshroo A, Mazloum-Ardakani M. Screen-printed electrodes for biosensing: a review (2008–2013) Microchim Acta. 2014;181:865–891. doi: 10.1007/s00604-014-1181-1. - DOI
-
- da Silva ETSG, Souto DEP, Barragan JTC, et al. Electrochemical biosensors in point-of-care devices: recent advances and future trends. ChemElectroChem. 2017;4:778–794. doi: 10.1002/celc.201600758. - DOI
-
- Barton J, García MBG, Santos DH, Fanjul-Bolado P, Ribotti A, McCaul M, Diamond D, Magni P. Screen-printed electrodes for environmental monitoring of heavy metal ions: a review. Microchim Acta. 2016;183:503–517. doi: 10.1007/s00604-015-1651-0. - DOI
Publication types
MeSH terms
Substances
LinkOut - more resources
Full Text Sources
Other Literature Sources
