. 2021 Apr 8:10:e65894.
doi: 10.7554/eLife.65894.

CEM500K, a large-scale heterogeneous unlabeled cellular electron microscopy image dataset for deep learning

Affiliations

CEM500K, a large-scale heterogeneous unlabeled cellular electron microscopy image dataset for deep learning

Ryan Conrad et al. Elife. .

Abstract

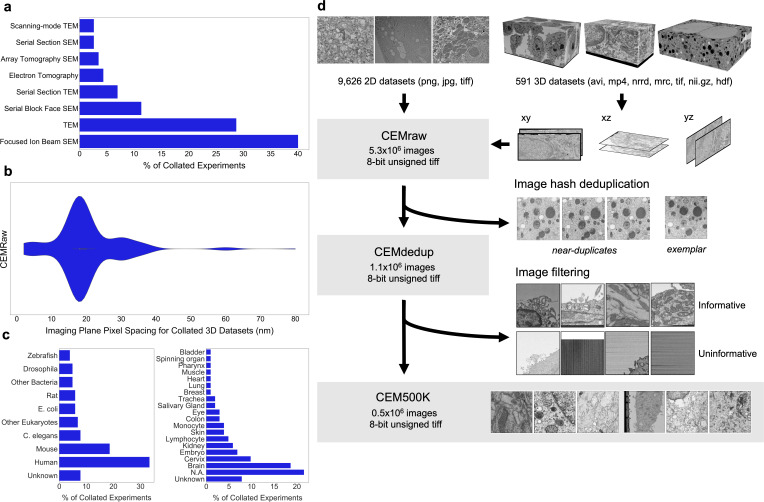
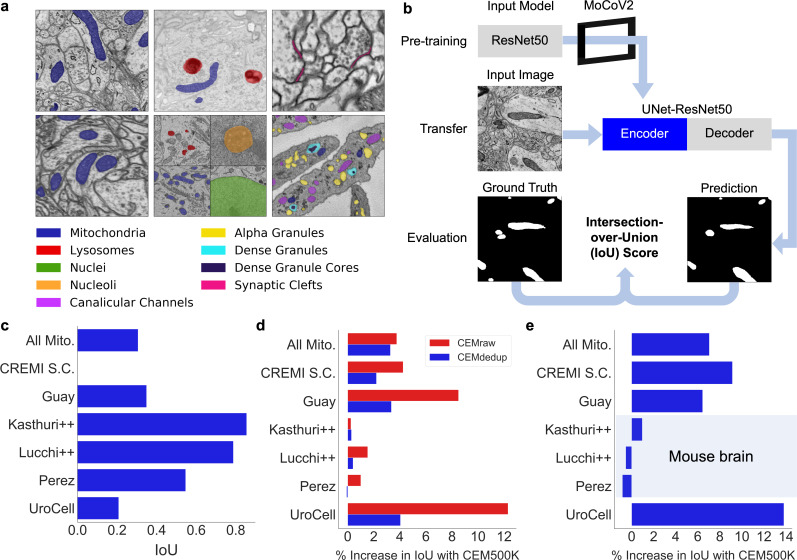
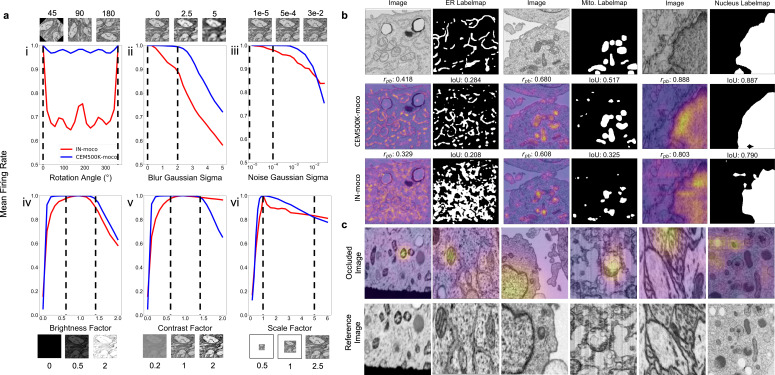
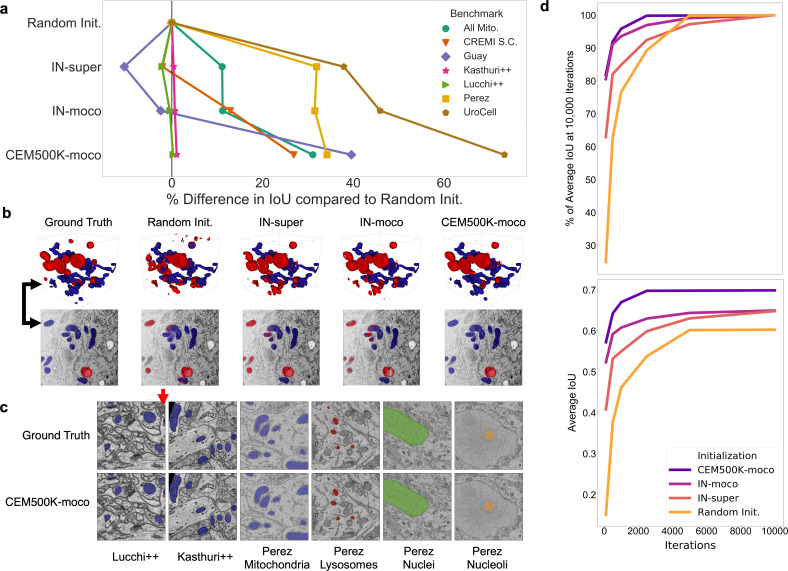
Automated segmentation of cellular electron microscopy (EM) datasets remains a challenge. Supervised deep learning (DL) methods that rely on region-of-interest (ROI) annotations yield models that fail to generalize to unrelated datasets. Newer unsupervised DL algorithms require relevant pre-training images, however, pre-training on currently available EM datasets is computationally expensive and shows little value for unseen biological contexts, as these datasets are large and homogeneous. To address this issue, we present CEM500K, a nimble 25 GB dataset of 0.5 × 10⁶ unique 2D cellular EM images curated from nearly 600 three-dimensional (3D) and 10,000 two-dimensional (2D) images from >100 unrelated imaging projects. We show that models pre-trained on CEM500K learn features that are biologically relevant and resilient to meaningful image augmentations. Critically, we evaluate transfer learning from these pre-trained models on six publicly available and one newly derived benchmark segmentation task and report state-of-the-art results on each. We release the CEM500K dataset, pre-trained models and curation pipeline for model building and further expansion by the EM community. Data and code are available at https://www.ebi.ac.uk/pdbe/emdb/empiar/entry/10592/ and https://git.io/JLLTz.

Keywords: cell biology; computational biology; deep learning; electron microscopy; image dataset; neural network; none; segmentation; systems biology; vEM.


Conflict of interest statement

RC, KN No competing interests declared

Figures

Figure 1.
Figure 1.. Preparation of a deep learning appropriate 2D EM image dataset rich with relevant and unique features.
(a) Percent distribution of collated experiments grouped by imaging technique: TEM, transmission electron microscopy; SEM, scanning electron microscopy. (b) Distribution of imaging plane pixel spacings in nm for volumes in the 3D corpus. (c) Percent distribution of collated experiments by organism and tissue origin. (d) Schematic of our workflow: 2D electron microscopy (EM) image stacks (top left) or 3D EM image volumes sliced into 2D cross-sections (top right) were cropped into patches of 224 × 224 pixels, comprising CEMraw. Nearly identical patches excepting a single exemplar were eliminated to generate CEMdedup. Uninformative patches were culled to form CEM500K.
Figure 2.
Figure 2.. CEM500K pre-training improves the transferability of learned features.
(a) Example images and colored label maps from each of the six publicly available benchmark datasets: clockwise from top left: Kasthuri++, UroCell, CREMI Synaptic Clefts, Guay, Perez, and Lucchi++. The All Mitochondria benchmark is a superset of these benchmarks and is not depicted. (b) Schematic of our pre-training, transfer, and evaluation workflow. Gray blocks denote trainable models with randomly initialized parameters; blue block denotes a model with frozen pre-trained parameters. (c) Baseline Intersection-over-Union (IoU) scores for each benchmark achieved by skipping MoCoV2 pre-training. Randomly initialized parameters in ResNet50 layers were transferred directly to UNet-ResNet50 and frozen during training. (d) Measured percent difference in IoU scores between models pre-trained on CEMraw vs. CEM500K (red) and on CEMdedup vs. CEM500K (blue). (e) Measured percent difference in IoU scores between a model pre-trained on CEM500K over the mouse brain (Bloss) pre-training dataset. Benchmark datasets comprised exclusively of electron microscopy (EM) images of mouse brain tissue are highlighted.
Figure 3.
Figure 3.. Features learned from CEM500K pre-training are more robust to image transformations and encode for semantically meaningful objects with greater selectivity.
(a) Mean firing rates calculated between feature vectors of images distorted by (i) rotation, (ii) Gaussian blur, (iii) Gaussian noise, (iv) brightness v. contrast, (vi) scale. Dashed black lines show the range of augmentations used for CEM500K + MoCoV2 during pre-training. For transforms in the top row, the undistorted images occur at x = 0; bottom row, at x = 1. (b) Evaluation of features corresponding to ER (left), mitochondria (middle), and nucleus (right). For each organelle, the panels show: input image and ground truth label map (top row), heatmap of CEM500K-moco activations of the 32 filters most correlated with the organelle and CEM500K-moco binary mask created by thresholding the mean response at 0.3 (middle row), IN-moco activations and IN-moco binary mask (bottom row). Also included are Point-Biserial correlation coefficients (rpb) values and Intersection-over-Union scores (IoUs) for each response and segmentation. All feature responses are rescaled to range [0, 1]. (c) Heatmap of occlusion analysis showing the region in each occluded image most important for forming a match with a corresponding reference image. All magnitudes are rescaled to range [0, 1].
Figure 4.
Figure 4.. Models pre-trained on CEM500K yield superior segmentation quality and training speed on all segmentation benchmarks.
(a) Plot of percent difference in segmentation performance between pre-trained models and a randomly initialized model. (b) Example segmentations on the UroCell benchmark in 3D (top) and 2D (bottom). The black arrows show the location of the same mitochondrion in 2D and in 3D. (c) Example segmentations from all 2D-only benchmark datasets. The red arrow marks a false negative in ground truth segmentation detected by the CEM500K-moco pre-trained model. (d) Top, average IoU scores as a percent of the average IoU after 10,000 training iterations, bottom, absolute average IoU scores over a range of training iteration lengths.
Appendix 1—figure 1.
Appendix 1—figure 1.. Deduplication and image filtering.
(a) Breakdown of fractions (top) and representative examples (bottom) of patches labeled ‘uninformative’ by a trained deep learning (DL) model based on defect (as determined by a human annotator). (b) Receiver operating characteristic curve for the DL model classifier and a Random Forest classifier evaluated on a holdout test set of 2000 manually labeled patches (1000 informative and 1000 uninformative).
Appendix 1—figure 2.
Appendix 1—figure 2.. Randomly selected images from CEMraw, CEMdedup, and CEM500K.
Appendix 1—figure 3.
Appendix 1—figure 3.. Schematics of the MoCoV2 algorithm and UNet-ResNet50 model architecture.
(a) Shows a single step in the MoCoV2 algorithm. A batch of images is copied; images in each copy of the batch are independently and randomly transformed and then shuffled into a random order (the first batch is called the query and the second is called the key). Query and key are encoded by two different models, the encoder and momentum encoder, respectively. The encoded key is appended to the queue. Dot products of every image in the query with every image in the queue measure similarity. The similarity between an image in the query and its match from the key is the signal that informs parameter updates. More details in He et al., 2019. (b) Detailed schematic of the UNet-ResNet50 architecture.
Appendix 1—figure 4.
Appendix 1—figure 4.. Randomly selected images from the Bloss et al., 2018 pre-training dataset.
Appendix 1—figure 5.
Appendix 1—figure 5.. Visual comparison of results on the UroCell benchmark.
The ground truth and Authors’ Best Results are taken from the original UroCell publication (Žerovnik Mekuč et al., 2020). The results from the CEM500K-moco pre-trained model have been colorized to approximately match the originals; 2D label maps were not included in the UroCell paper.
Appendix 1—figure 6.
Appendix 1—figure 6.. Images from source electron microscopy (EM) volumes are unequally represented in the subsets of CEM.
The line at 45° shows the expected curve for perfect equality between all source volumes (i.e. each volume would contribute the same number of images to CEMraw, CEMdedup, or CEM500K). Gini coefficients measure the area between the Lorenz Curves and the line of perfect equality, with 0 meaning perfect equality and 1 meaning perfect inequality. For each subset of cellular electron microscopy (CEM), approximately 20% of the source 3D volumes account for 80% of all the 2D patches.
Appendix 1—figure 7.
Appendix 1—figure 7.. Plot showing the percent of random crops from an image that will be 100% uninformative based on the percent of the image that is informative.

Similar articles

Cited by

References

    1. Berning M, Boergens KM, Helmstaedter M. SegEM: efficient image analysis for High-Resolution connectomics. Neuron. 2015;87:1193–1206. doi: 10.1016/j.neuron.2015.09.003. - DOI - PubMed
    1. Bloss EB, Cembrowski MS, Karsh B, Colonell J, Fetter RD, Spruston N. Single excitatory axons form clustered synapses onto CA1 pyramidal cell dendrites. Nature Neuroscience. 2018;21:353–363. doi: 10.1038/s41593-018-0084-6. - DOI - PubMed
    1. Buhmann J. Automatic detection of synaptic partners in a Whole-Brain Drosophila EM Dataset. bioRxiv. 2019 doi: 10.1101/2019.12.12.874172. - DOI
    1. Canny J. A computational approach to edge detection. IEEE Transactions on Pattern Analysis and Machine Intelligence. 1986;8:679–698. doi: 10.1109/TPAMI.1986.4767851. - DOI - PubMed
    1. Carion N, Massa F, Synnaeve G, Usunier N, Kirillov A, Zagoruyko S. End-to-End object detection with transformers. arXiv. 2020 https://arxiv.org/abs/2005.12872

Publication types

MeSH terms

LinkOut - more resources