. 2021 Apr 8:10:e66190.
doi: 10.7554/eLife.66190.

Inflammation rapidly recruits mammalian GMP and MDP from bone marrow into regional lymphatics

Affiliations

Inflammation rapidly recruits mammalian GMP and MDP from bone marrow into regional lymphatics

Juana Serrano-Lopez et al. Elife. .

Abstract

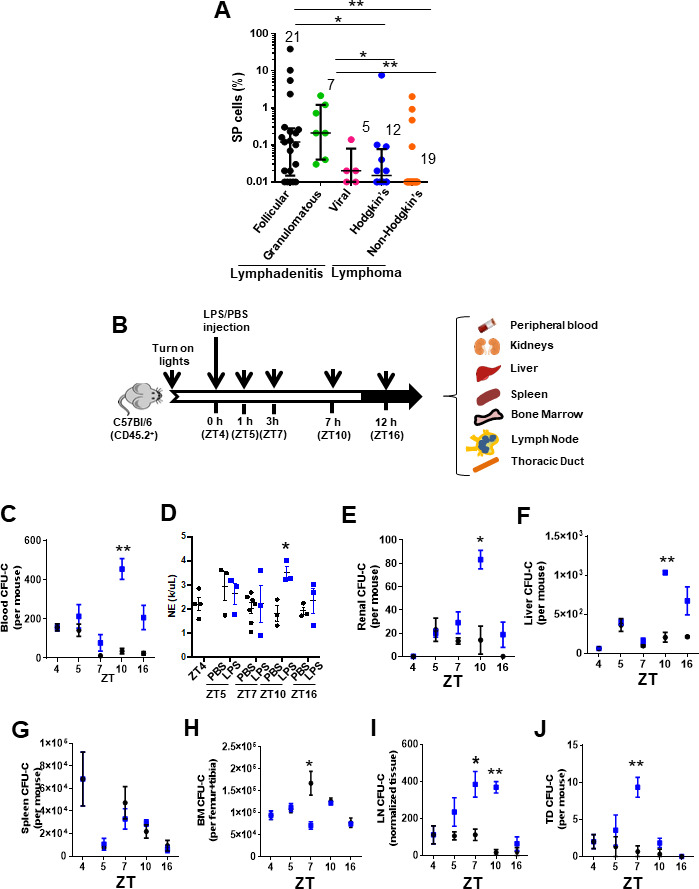
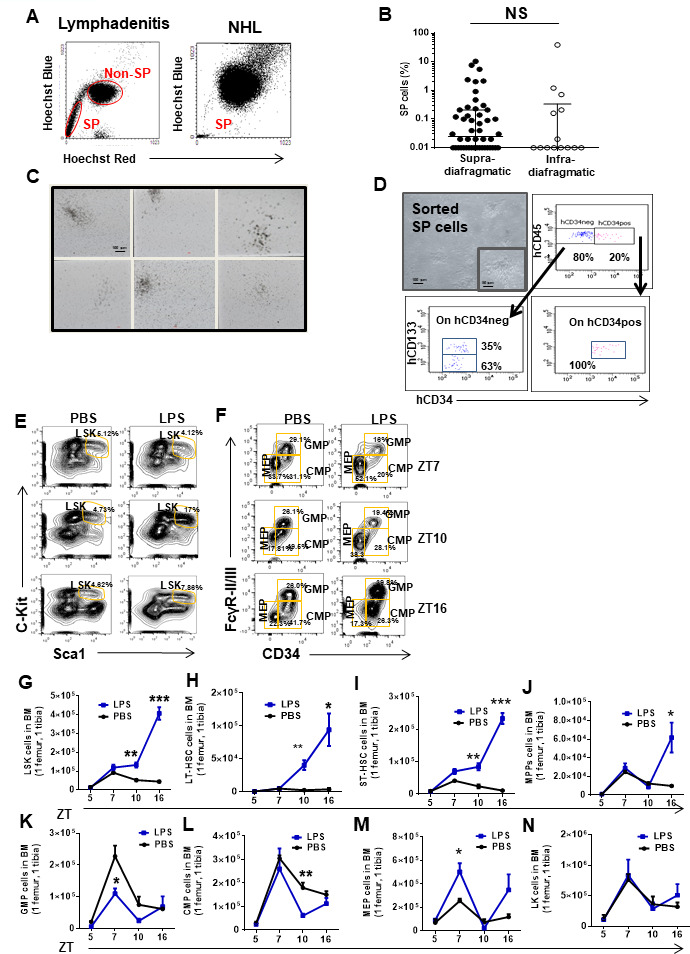
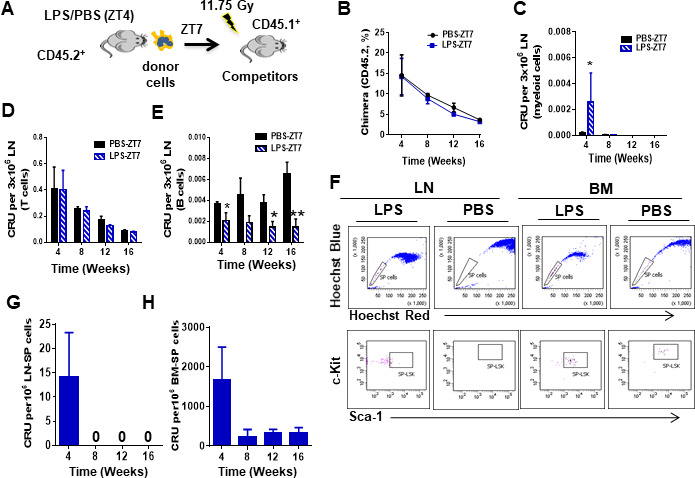
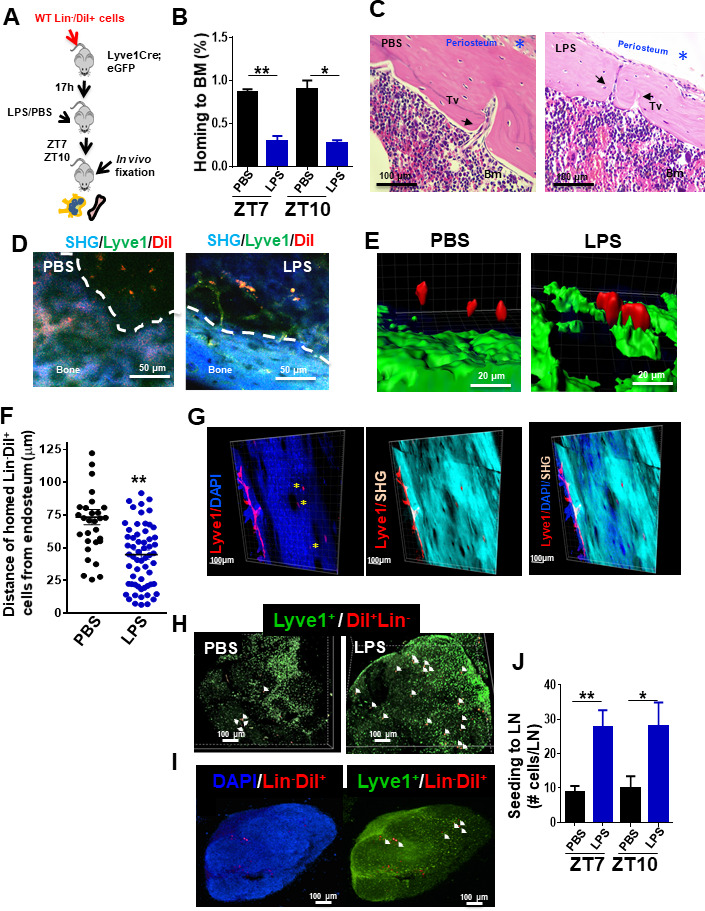
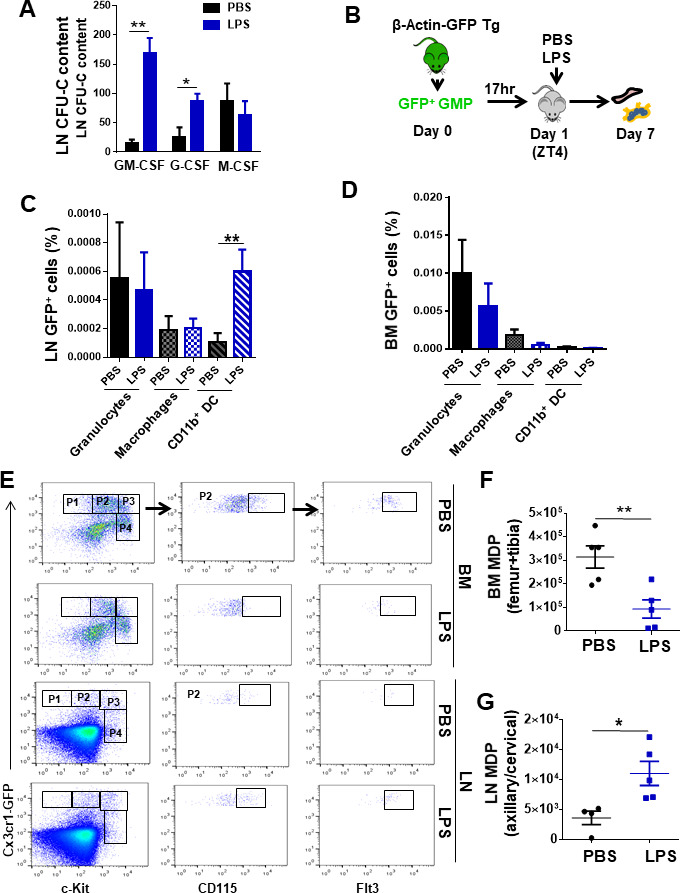
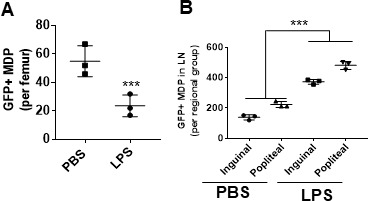
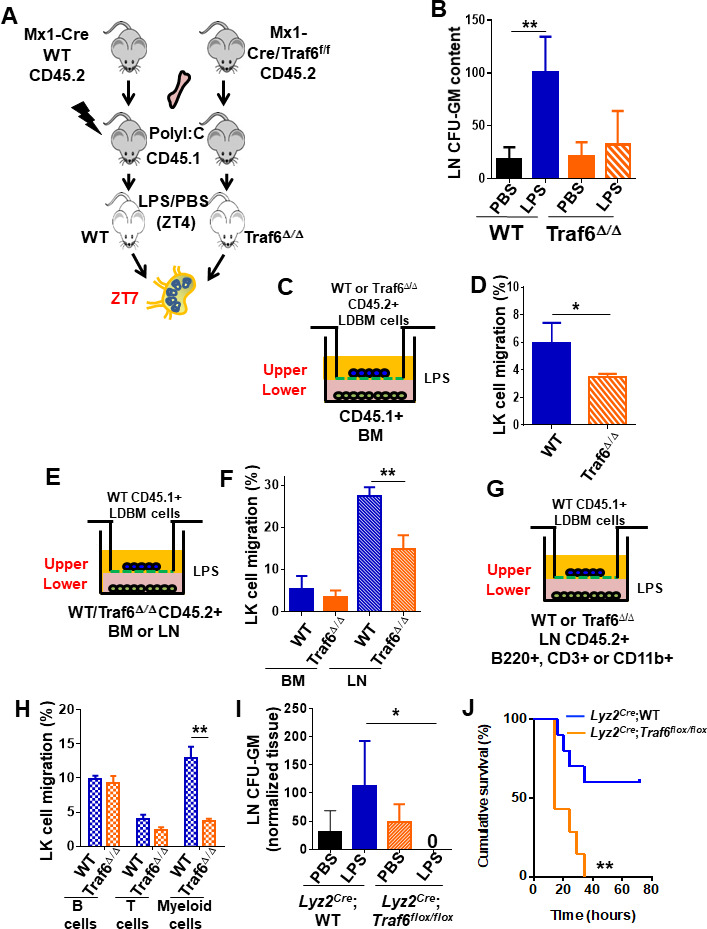
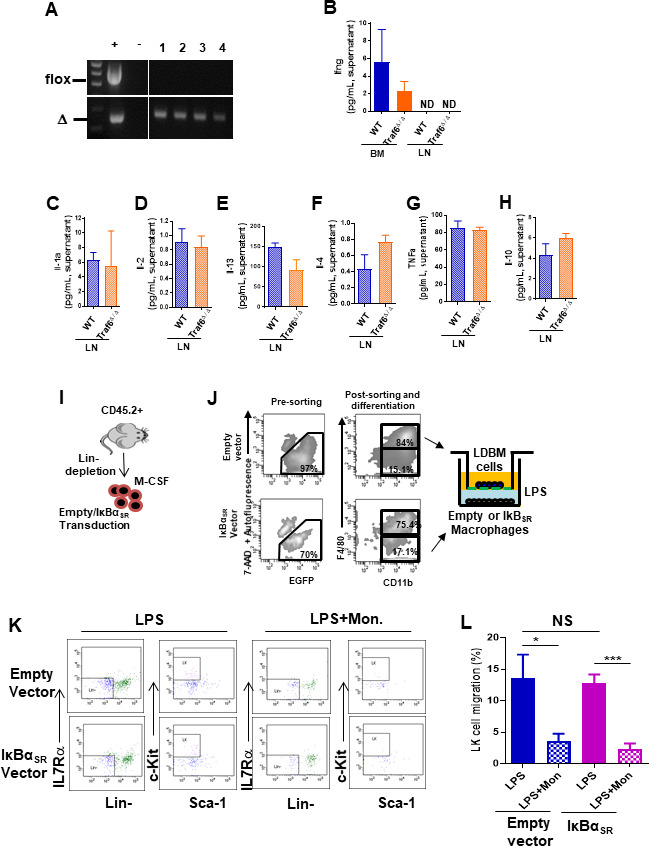
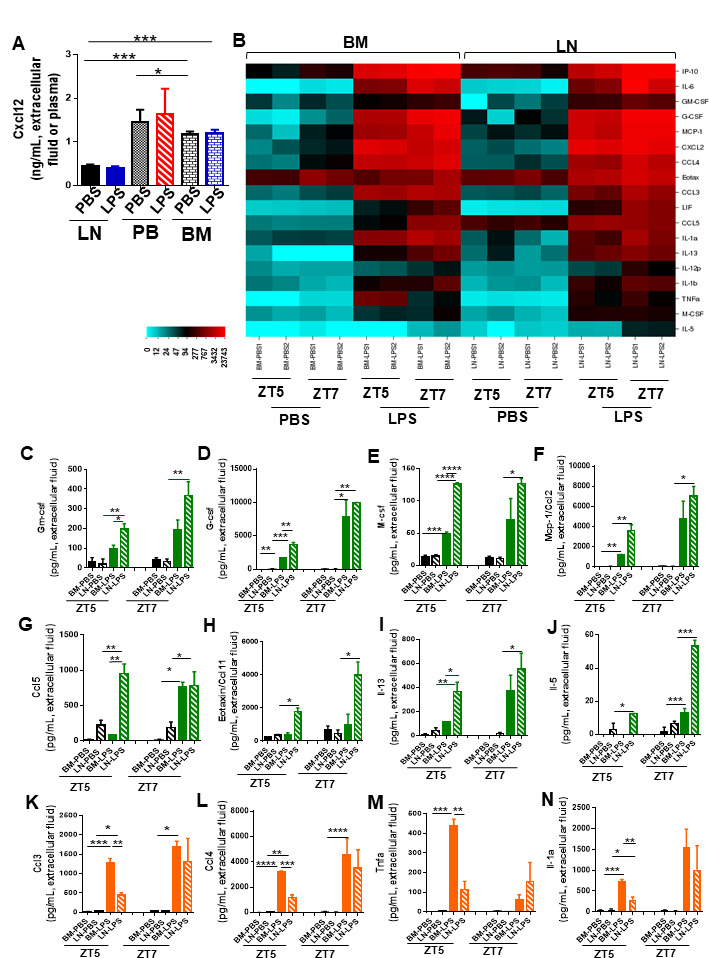
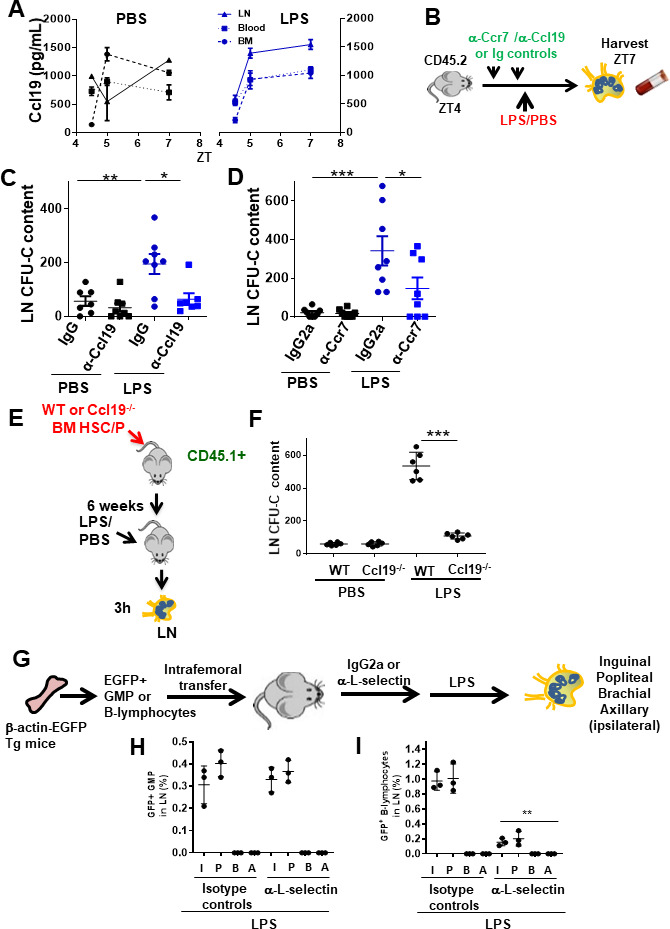
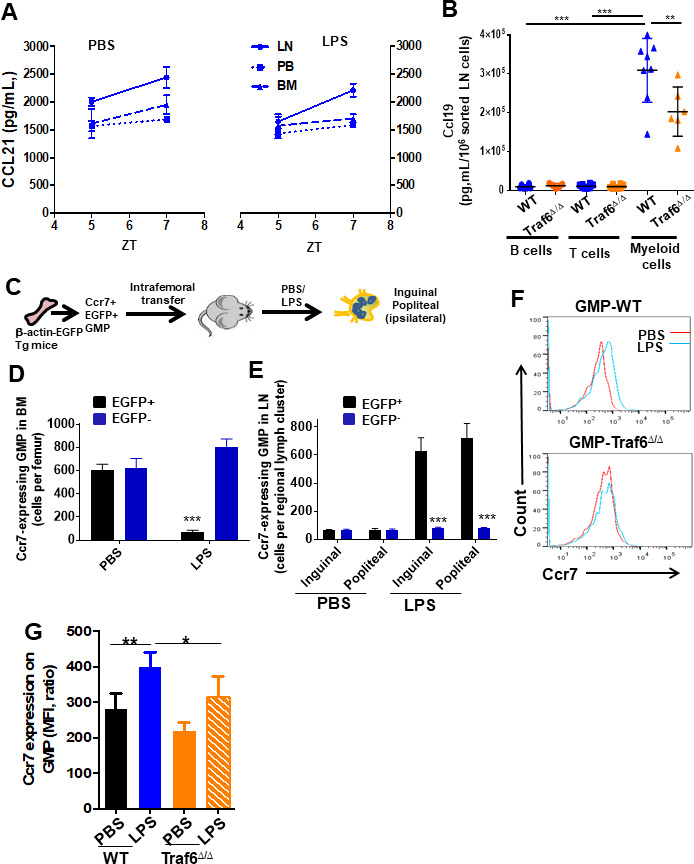
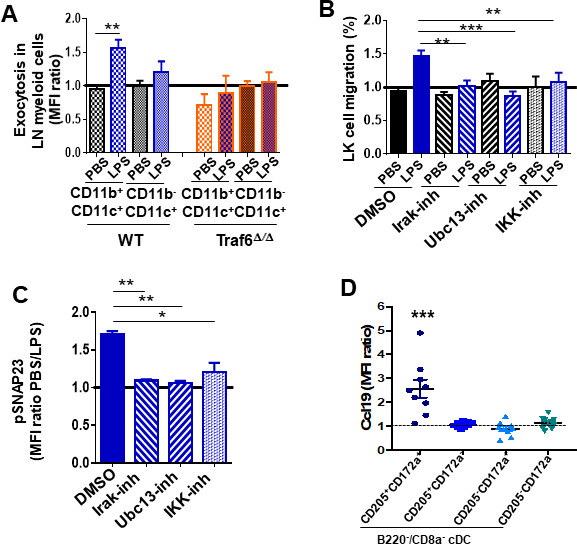
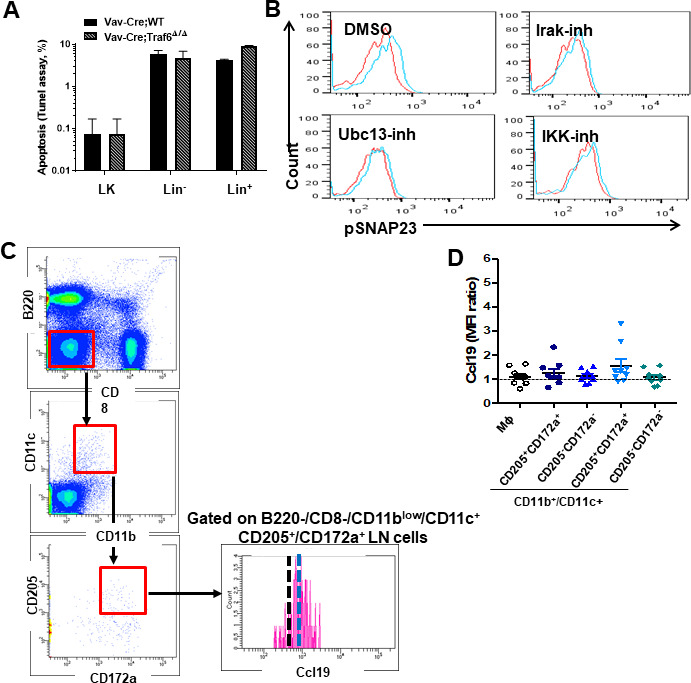
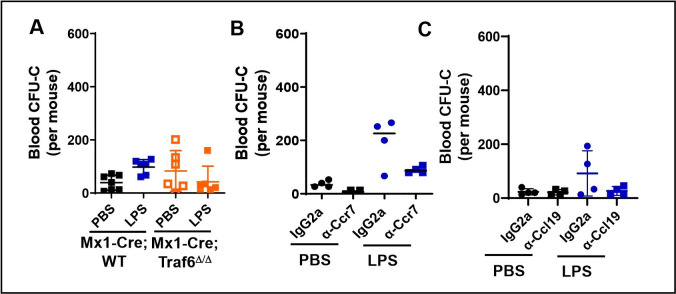
Innate immune cellular effectors are actively consumed during systemic inflammation, but the systemic traffic and the mechanisms that support their replenishment remain unknown. Here, we demonstrate that acute systemic inflammation induces the emergent activation of a previously unrecognized system of rapid migration of granulocyte-macrophage progenitors and committed macrophage-dendritic progenitors, but not other progenitors or stem cells, from bone marrow (BM) to regional lymphatic capillaries. The progenitor traffic to the systemic lymphatic circulation is mediated by Ccl19/Ccr7 and is NF-κB independent, Traf6/IκB-kinase/SNAP23 activation dependent, and is responsible for the secretion of pre-stored Ccl19 by a subpopulation of CD205+/CD172a+ conventional dendritic cells type 2 and upregulation of BM myeloid progenitor Ccr7 signaling. Mature myeloid Traf6 signaling is anti-inflammatory and necessary for lymph node myeloid cell development. This report unveils the existence and the mechanistic basis of a very early direct traffic of myeloid progenitors from BM to lymphatics during inflammation.

Keywords: bone marrow; circulation; endotoxemia; human; immunology; inflammation; lymphatics; medicine; mouse; myeloid progenitors.

Plain language summary

When the body becomes infected with disease-causing pathogens, such as bacteria, the immune system activates various mechanisms which help to fight off the infection. One of the immune system’s first lines of defense is to launch an inflammatory response that helps remove the pathogen and recruit other immune cells. However, this response can become overactivated, leading to severe inflammatory conditions that damage healthy cells and tissues. A second group of cells counteract this over inflammation and are different to the ones involved in the early inflammatory response. Both types of cells – inflammatory and anti-inflammatory – develop from committed progenitors, which, unlike stem cells, are already destined to become a certain type of cell. These committed progenitors reside in the bone marrow and then rapidly travel to secondary lymphoid organs, such as the lymph nodes, where they mature into functioning immune cells. During this journey, committed progenitors pass from the bone marrow to the lymphatic vessels that connect up the different secondary lymphoid organs, and then spread to all tissues in the body. Yet, it is not fully understood what exact route these cells take and what guides them towards these lymphatic tissues during inflammation. To investigate this, Serrano-Lopez, Hegde et al. used a combination of techniques to examine the migration of progenitor cells in mice that had been treated with lethal doses of a bacterial product that triggers inflammation. This revealed that as early as one to three hours after the onset of infection, progenitor cells were already starting to travel from the bone marrow towards lymphatic vessels. Serrano-Lopez, Hegde et al. found that a chemical released by an “alarm” immune cell already residing in secondary lymphoid organs attracted these progenitor cells towards the lymphatic tissue. Further experiments showed that the progenitor cells travelling to secondary lymphoid organs were already activated by bacterial products. They then follow the chemical released by alarm immune cells ready to respond to the immune challenge and suppress inflammation. These committed progenitors were also found in the inflamed lymph nodes of patients. These findings suggest this rapid circulation of progenitors is a mechanism of defense that contributes to the fight against severe inflammation. Altering how these cells migrate from the bone marrow to secondary lymphoid organs could provide a more effective treatment for inflammatory conditions and severe infections. However, these approaches would need to be tested further in the laboratory and in clinical trials.


Conflict of interest statement

JS, SH, SK, JS, JF, AW, PR, YR, LC, HG, HG, SL, IM, JS, DS, JC No competing interests declared

Figures

Figure 1.
Figure 1.. Inflammation induces early mobilization of hematopoietic stem cells and progenitors to lymph organs in humans and mice.
(A) Content of side population (SP)cells in human lymph node (LN) by flow cytometry. LN biopsies had been blindly identified histologically as lymphadenitis, subcategorized in follicular (FL, black circles, n = 21), granulomatous (GL, green circles, N = 7), and viral (VL, pink circles, n = 5) and lymphomas, subcategorized in Hodgkin’s lymphoma (HL, blue circles, n = 12) or non-Hodgkin’s lymphoma (NHL, orange circles, n = 19). (B) Strategy for lipopolysaccharide (LPS) administration and collection of tissues (blood, kidneys, liver, spleen, bone marrow (BM), lymph node (LN), and thoracic duct (TD)) at specific times. LPS or vehicle control PBS was administered at the early rest phase into C57Bl/6 (CD45.2+) mice, and tissue specimens were collected before (zeitgeber time [ZT]4), 1 hr (ZT5), 3 hr (ZT7), 6 hr (ZT10), or 12 hr (ZT16) later. (C) Myeloid colony-forming-cell unit (CFU-C) content in peripheral blood (PB) from C57Bl/6 mice pre-treated with PBS (black circles) or LPS (blue circles) at different circadian cycle times. (D) Absolute neutrophil count in PB from C57Bl/6 mice pre-treated with PBS (black circles) or LPS (blue circles) at different circadian cycle times. (E–J) Myeloid CFU-C content in organs at different circadian cycle times. CFU-C contained in kidneys (E), liver (F), spleen (G), BM (H), LN (I), and TD (J) in response to PBS (black circles) or LPS (blue squares) at different circadian cycle times (n = 3–4 mice per time point and treatment). ZT4 = 10 am (time of LPS administration). ZT7: 1 pm (3 hr post-administration of LPS). ZT10: 4 pm (6 hr post-administration of LPS). ZT16: 10 pm (12 hr post-administration of LPS). Results are shown as mean ± SD. *p<0.05, **p<0.01.
Figure 1—figure supplement 1.
Figure 1—figure supplement 1.. Clonogenic and long-term multilineage potential of human and murine hematopoietic stem cells and progenitors (HSC/P) in lymph node (LN).
(A) Representative flow cytometry dot plots of side population (SP) cells from human LN biopsies diagnosed with lymphadenitis (left flow panel) and non-Hodgkin’s lymphoma (NHL, right flow panel). SP cells form a tail cluster on the left side. (B) Graph represents the percentage of SP cells in human LN biopsies categorized according to their anatomical location. Supra-diaphragmatic location (solid circles) included neck and axillary LN and infra-diaphragmatic location (open circles) included mesenteric and inguinal LN. (C) Representative colony-forming unit (CFU-C) micrographs in human LN diagnosed with follicular lymphadenitis. Scale bar: 100 µm. (D) Clonogenic potential of lymphadenitis-derived SP cells (upper left; with magnification of a CFU-GM in outlined inset) and fluorescence-activated cell sorter (FACS) analysis of LN SP-derived hematopoietic progenitors (upper right and bottom panels) maintained for 1 week in culture as previously described (Esplin et al., 2011). All SP-derived progenitors were positive for pan-leukocyte surface marker CD45 but had heterogenic expression for CD34 and CD133 surface markers. (E, F) Representative FACS profiles of murine bone marrow (BM) HSC/P in response to in vivo administration of PBS (left panels) or lipopolysaccharide (LPS) (right panels) at specified zeitgeber time (ZT). (G–N) Time response in the BM content of LSK (G), long-term HSC (LT-HSC) (H), short-term HSC (ST-HSC) (I), multipotential progenitors (MPP) (J), granulocyte-macrophage progenitors (GMPs) (K), common myeloid progenitors (CMP) (L), megakaryocyte-erythroid progenitor (MEP) (M), and LK cells (N) in response to PBS (black lines) or LPS (blue lines). Values represent mean ± SD of a minimum of four mice per group. *p<0.05, **p<0.01, ***p<0.001.
Figure 1—figure supplement 2.
Figure 1—figure supplement 2.. Myeloid progenitor migration to lymph node (LN) in response to lipopolysaccharide (LPS) is independent of NF-κB activation.
(A) Schema for the competitive long-term reconstitution potential of LN cells (donor cells) from C57Bl/6 (CD45.2+) mice treated with PBS/LPS and harvested at zeitgeber time (ZT)7 (3 hr) into lethally irradiated CD45.1+ B6.SJLPtprca Pep3b/BoyJ recipient mice (n = 3 mice per group). (B–E) Competitive repopulating unit (CRU) assay of LN cells as assessed by flow cytometry of allotype CD45.2-expressing cells in transplanted mice followed for up to 16 weeks. (B) Overall CRU as gated on CD45.2+ cells in response to donor cells from mice pre-treated with PBS (black line) or LPS (blue line). (C–E) Myeloid cell (C), T-cell (D), and B-cell (E) contributing CRU in response to donor cells from mice pre-treated with PBS (solid bar) or LPS (blue mosaic bar). (F) Representative example of fluorescence-activated cell sorter analysis for side population (SP) cells (upper dot plots) and SP-LSK potential (lower dot plots) from PBS- and LPS-treated LN or bone marrow (BM) tissues at ZT7 (3 hr). Hoechst: Hoechst 33342 staining for blue (blue) and red (red) fluorescence emissions. (G, H) Donor-derived chimera of sorted LN- or BM-SP cells obtained from LPS-treated mice.
Figure 2.
Figure 2.. Draining of bone marrow (BM)-derived lineage negative cells into lymphatics.
(A) Schema for adoptive transfer of BM-derived lineage negative cells (Lin-) labeled with 1,1'-dioctadecyl-3,3,3',3'-tetramethylindocarbocyanine perchlorate (DiI) dye into lymphatic endothelium reporter Lyve1eGFP mice. By 16 hr after cell transplantation, lipopolysaccharide (LPS) or PBS were administered into the Lyve1eGFP mice at zeitgeber time (ZT)4 (10 am; time of LPS administration). BM and lymph node (LN) cells were analyzed at ZT5.5 (11.30 am, 1.5 hr after LPS administration), ZT7 (1 pm, 3 hr after LPS administration), and ZT10 (4 pm, 6 hr after LPS administration) for labeled Lin- cells (Lin-/DiI+). (B) Frequency of Lin-/DiI+ homed to BM (solid bars) (mosaic bars) after PBS (black solid bar) or LPS (blue solid bar) administration at ZT7 (1 pm, 3 hr after LPS administration) and ZT10 (4 pm, 6 hr after LPS administration). (C) Representative 3D reconstruction images of the whole bone by two-photon microscopy showing lymphatic vessels (Lyve1) surface marker (red), nuclei with DAPI (blue), and cortical bone with second harmonic signal (SHG, light blue). The scale bars, 100 μm. (D, i–iv) Intravital two-photon microscopy imaging (IVM) of long bones from Lyve1eGFP mice showing lymphatic vessels (displayed in green) near to the surface of the bone (blue, detected by SHG signal) and homed Lin-/DiI+ cells (displayed in red). (i, iii) IVM of PBS specimen. (ii, iv) IVM of LPS specimen. (E, F) Analysis and quantification of the distance of homed Lin-/DiI+ (red) cells to Lyve1eGFP (green) cells after PBS/LPS administration at ZT5.5 (11.30 am, 1.5 hr after LPS administration) analyzed by Imaris 7.7.2 software. (G) Two-photon microscopy examples of images of longitudinal femoral sections stained with anti-Lyve1 antibody and DAPI, and analyzed for specific fluorescence signal and SHG for cortical bone. (H, I) Representative of 3D reconstitution images of PBS- and LPS-treated LN tissues (H) and cross-sections of LPS-treated LN (I) analyzed by confocal microscopy showing the location of mobilized Lin-/DiI+ cells (red; nucleus stained by DAPI in blue) in relation with Lyve1+ cells (green; nucleus stained by DAPI in blue). The Z-stack dimensions of upper panels were X = 1266.95 μm, Y = 1266.95 μm, and Z = 344 μm. Calibrate: XY = 2.47 μm and Z = 4 μm. Resolution: 512 × 512 × 86. The Z-stack dimensions of lower panels were: X = 1259.36 μm, Y = 1259.36 μm, and Z = 132 μm. Calibrate: XY = 2.46 μm and Z = 4 μm. Resolution of images was 512 × 512 × 86. (J) Absolute count of mobilized Lin-/DiI+ cells counted within LN at ZT7 (1 pm, 3 hr after LPS administration, solid bars) and ZT10 (4 pm, 6 hr after LPS administration, mosaic bars) after PBS/LPS administration. N = 4–14 LNs analyzed per time point in a minimum of three mice per group and/or time point. Graph data depict mean ± SD. *p<0.05, **p<0.01.
Figure 3.
Figure 3.. Lymph node (LN)-mobilized granulocyte-macrophage progenitors (GMPs) preferentially differentiate into dendritic cells.
(A) Comparative quantification of the content of bipotent and unipotent myeloid progenitors in LN at zeitgeber time (ZT)7 (1 pm, 3 hr after lipopolysaccharide (LPS) administration) after PBS/LPS administration. (B) Schema of isolation and transfer of bone marrow (BM)-derived GMP from β-actin-GFP reporter mice (CD45.2+) into C57Bl/6 (CD45.2+) mice (2 × 10⁵ GFP+-GMP cells/mouse, n = 3 mice per group). After BM homing (17 hr), mice were treated with single and low dose of LPS (5 mg/kg) at ZT4 (day 1) and 7 days later BM and LN tissues were analyzed for green fluorescent protein (GFP) expression in myeloid populations by flow cytometry. (C, D) Graphs represent the percentage of GFP+-GMP differentiated to granulocytes (solid bars, Gr1++CD11b+CD11c-), macrophages (left mosaic bars, Gr1dimCD11b+CD11cneg), and cDC (right mosaic bars, Gr1-CD11b+ CD11c+) 7 days post-transferring after PBS/LPS administration by flow cytometry into LN (C) and BM (D). (E) Fluorescence-activated cell sorter strategy for macrophage-dendritic progenitor (MDP) content in BM and LN tissues from CX3CR-1GFP reporter mice (4–5 mice per group). Phenotypically, MDPs are defined as lineage-negative with high expression of the chemokine receptor Cx3cr1, c-fms (CD115) and Flt3 (P2), and intermediate expression of c-Kit. (F, G) Graphs show absolute numbers of MDP present in BM (F) and LN (G) 3 hr later (ZT7 [3 hr]) after PBS (black circles) or LPS (blue squares) administration. Values represent mean ± SD. *p<0.05, **p<0.01.
Figure 3—figure supplement 1.
Figure 3—figure supplement 1.. Lipopolysaccharide (LPS) induces rapid migration of macrophage-dendritic progenitors (MDPs) to regional lymph node (LN) chains.
(A) Flow cytometry analysis of green fluorescent protein (GFP) MDPs in bone marrow showing decreased MDPs upon LPS treatment. (B) Flow cytometry analysis of migrated GFP MDPs in LN (per regional group) showing increased GFP+MDPs in inguinal and popliteal LNs. Black bar: EGFP+; blue bar: EGFP-. Experiments were performed per triplicate. ***p<0.001.
Figure 4.
Figure 4.. Traf6 is a key regulator for migration of bone marrow (BM)-derived myeloid progenitors to lymph nodes (LNs) in a non-cell-autonomous manner.
(A) Schema of full chimeric mice made by non-competitive transplantation of CD45.2+ Mx1Cre;WT and Mx1Cre;Traf6flox/flox BM cells into lethally irradiated CD45.1+ B6.SJLPtprca Pep3b/BoyJ. Six weeks later Traf6 gene were deleted by intraperitoneal injection of poly(I:C). 1 week later we performed PBS/lipopolysaccharide (LPS) injection early in the rest phase (zeitgeber time [ZT]4 [10 am, time of LPS administration]) and LN-contained myeloid progenitors at ZT7 (1 pm, 3 hr after LPS administration) was scored by colony-forming unit (CFU) assay. (B) Absolute number of CFU-GM present in LN from wild-type (WT) (solid bars) and Traf6∆/∆ (orange bars) full chimeric mice (n = 6–7 mice per group) after PBS (black and orange solid bars) or LPS (blue and mosaic bars) administration. (C–H) In vitro transwell migration assay for BM-derived LK cells. (C) Experimental design for migration of WT or Traf6∆/∆ low-density (LD) BM cells (CD45.2+) toward a WT microenvironment generated by BM (CD45.1+) in the presence of LPS for 4 hr. (D) Graph represents the percentage migrated LK from WT (blue solid bar) or Traf6∆/∆ (orange mosaic bar) low-density BM (LDBM) cells to the bottom as depicted in (C). (E) Experimental design for migration of WT LDBM cells (CD45.1+) toward a gradient generated by WT or Traf6∆/∆ (CD45.2+) BM or LN cells in the presence of LPS for 4 hr. (F) Graph represents the percentage of LDBM LK migrated to the BM bottom (solid bars) or LN bottom (mosaic bars) as schemed in (E). (G) Experimental design for WT LDBM cells (CD45.1+) migration toward gradient generated by WT or Traf6∆/∆ LN-derived T-cells (CD45.2+/CD3e+/CD11b-/B220-) or B-cells (CD45.2+/CD3e-CD11b-/B220+) or myeloid cells (CD45.2+/CD3e-/CD11b+/B220-) in the presence of LPS for 4 hr. (H) Graph represents the percentage of migrated LK LDBM to the WT LN bottom (blue mosaic bars) or Traf6∆/∆ LN bottom (orange mosaic bars) as schemed in (G). In all cases, LK cell migration was determined by CD45 allotype analysis using flow cytometry in triplicate. (I) Absolute number of CFU-GM present in LN from Lyz2Cre;WT (solid bars) and Lyz2Cre;Traf6flox/flox (mosaic bars) full chimeric mice after PBS/LPS administration at ZT7 (3 hr). (J) Graph represents cumulative survival of Lyz2Cre;WT (blue line) and Lyz2Cre;Traf6flox/flox (orange line) after 10 mg/kg of LPS. (J) Survival curve after 30 mg/kg of b.w. injection in Lyz2Cre;WT (blue line) or Lyz2Cre;Traf6flox/flox (orange line). Values are shown as mean ± SD of two independent experiments with a minimum of three mice or replicates per group and experiment. *p<0.05, **p<0.01.
Figure 4—figure supplement 1.
Figure 4—figure supplement 1.. Myeloid progenitor migration to lymph node (LN) in response to lipopolysaccharide (LPS) is independent of NF-κB activation.
(A) Representative PCR amplifications show Traf6 deleted in circulating cells in four Mx1cre;Traf6flox/flox mice after poly(I:C) injections (10 mg/kg/2 days × five doses). (B) IFN-γ (Ifng) levels in the lower chamber at 4 hr after allowing transwell migration of wild-type (WT) bone marrow (BM) progenitors toward Wt or Traf6-deficient BM or LN cells (from Figure 4E, F). (C–H) Cytokine levels in the lower chamber at 4 hr after allowing transwell migration of LK cell progenitors contained in WT low-density BM (LDBM) toward WT or Traf6-deficient LN cells (from Figure 4E, F). (C) IL1-α (Il-1α). (D) IL-2 (Il-2). (E) IL-13 (Il-13). (F) IL-4 (Il-4). (G) TNF-α (Tnf-α). (H) IL-10 (Il-10). (I–L) Analysis of LK progenitor mitration toward BM-derived macrophages with exogenous expression of IκBα mutant resistant to proteasome degradation. BM Lin- cells were transduced with a MSCV-puro-eGFP bicistronic retroviral vector encoding full length of IκBα mutant and GFP+ protein. EGFP+ Lin- cells were sorted and differentiated in culture by macrophage colony-stimulating factor (M-CSF) cytokine to macrophages. Green fluorescent CD11b+-macrophages were layered on bottom chamber and stimulated them with LPS to generate myeloid chemotaxis gradient. (I) Experimental schema for the analysis of LK (Lin-/c-Kit+/Sca1-) cell migration contained in LDBM from the upper chamber to the transduced macrophage bottom stimulated with LPS and LPS + monensin (LPS + Mon) for 4 hr as depicted in (K). (J) Example of gating strategy for the sorting of transduced macrophages used in the bottom chamber of transwell assays. (K) Representative fluorescence-activated cell sorter dot plots demonstrating gating strategy to identify migrating granulocyte-macrophage progenitor (GMP) populations from the transwell migration assays. (L) Graph represents LK cell migration toward transduced macrophages in the presence of LPS (solid bars) or LPS + Mon (mosaic bars). Values represent mean ± SD of three mice per group and experiment. Experiments were performed per triplicate. ND: not detectable; NS: not significant. *p<0.05, ***p<0.001.
Figure 4—figure supplement 2.
Figure 4—figure supplement 2.. Inflammation induces temporal changes in chemokine and cytokine signatures in bone marrow (BM) and lymph node (LN).
(A) Cxcl12 in femoral or LN extracellular fluid and plasma after PBS/lipopolysaccharide (LPS) in vivo administration at zeitgeber time (ZT)7 (1 pm, 3 hr after LPS administration). (B) Heat map showing cytokine profiling release into the extracellular fluid of femora and LN in response to PBS/LPS at ZT5 (11 am, 1 hr after LPS administration) and ZT7 (1 pm, 3 hr after LPS administration). (C–N) Graphs represent levels of relevant cytokines and chemokines associated with migration/inflammatory response and released into LN extracellular fluid (black and green bars) or into femoral extracellular fluid (black and orange bars) after PBS/LPS administration into C57Bl/6 mice at ZT5 (11 am, 1 hr after LPS administration) and ZT7 (1 pm, 3 hr after LPS administration). (C–J) Extracellular LN levels of Gm-csf (C), G-csf (D), M-Csf (E), Mcp-1 (F), Ccl5 (G), eotaxin/Ccl11 (H), IL-13 (I), and IL-5 (J). (K–N) Extracellular BM levels of Ccl3 (K), Ccl4 (L), Tnfα (M), and IL-1α (N). Values are mean ± SE of two mice per treatment and experiment, pooled from two independent experiments. *p<0.05, **p<0.01, ***p<0.001; ****p<0.0001.
Figure 5.
Figure 5.. Granulocyte-macrophage progenitor (GMP) cells drain into local lymphatics and not blood circulation in early inflammation via Ccl19/Ccr7.
(A) Graph represents soluble Ccl19 chemokine in femoral or lymph node (LN) extracellular fluid and peripheral blood (PB) plasma after PBS (black lines) or lipopolysaccharide (LPS) (blue lines) administration at different circadian cycle times (zeitgeber time [ZT]4.5 [10.30 am, 0.5 hr after LPS administration], ZT5 [11 am, 1 hr after LPS administration], and ZT7 [1 pm, 3 hr after LPS administration]). (B) Strategy for in vivo neutralization of Ccr7 receptor or Ccl19 ligand by injections of anti-Ccr7 antibody or anti-Ccl19 antibody (50 μg/dose, two doses) into C57Bl/6 mice. One day after the last dose of antibodies, PBS or LPS was administered at ZT4 (10 am, time of LPS administration), and the myeloid progenitors-circulating cells from the LN and PB were measured by colony-forming unit (CFU) assay at ZT7 (1 pm, 3 hr after LPS administration). (C, D) Absolute number of progenitors present into LN from neutralized mice with anti-Ccl19/IgG (left graph) or anti-Ccr7/IgG2a (right graph) after PBS (black) or LPS (blue) administration as depicted in (B). (E) Generation of hematopoietic chimeric Ccl19 expressing (wild-type [WT]) or not (Ccl19-/-) mice and isolation of LNs after administration of PBS or LPS. (F) CFU content of LN from either WT or Ccl19-/- hematopoietic chimeric animals treated with PBS or LPS. (G) Experimental design to analyze L-selectin dependence of femoral GMP migration to regional (or distant) LN after LPS administration. (H, I) Percentages of GFP+ cells in LN after administration of an isotype control or anti-L-selectin antibodies. (H) Frequency of GFP +GMP cells in regional LN after administration of LPS was not modified by L-selectin blockade in vivo. (I) Inhibition of the migration of GFP+ B-lymphocytes to regional LNs in mice pre-treated with anti-L-selectin antibody. In (B) and (C), LN were collected at ZT7 or 3 hr after LPS. Values represent mean ± SD of replicates in two or three independent experiments. *p<0.05, **p<0.01, ***p<0.001.
Figure 5—figure supplement 1.
Figure 5—figure supplement 1.. Myeloid expression of Ccl19 ligand in lymph node (LN) and short-term differentiation of pre-treated granulocyte-macrophage progenitors (GMPs).
(A) Ccl21 in femoral or LN extracellular fluid and peripheral blood (PB) plasma after PBS (left lines) or lipopolysaccharide (LPS) (right lines) administration at different circadian cycle times. (B) Ccl19 released into the supernatant from sorted wild-type (WT) and Traf6-deficient LN T+ cells, B+ cells, and CD11b+ myeloid cells after LPS stimulation in vitro. (C–E) Experimental schema of analysis of regional migration from chimeric femora of Ccr7-expressing GMP cells to bone marrow (BM) (D) and regional (inguinal and popliteal) LN (E). (F, G) Representative example of flow cytometry analysis (F) and mean fluorescence intensity (MFI) levels (G) of Ccr7 on GMPs from wild-type (WT) and Traf6-deficient mice in the presence of PBS (black and orange solid bars) or LPS (blue solid bar and orange mosaic bar). Values represent mean ± SD of two independent experiments. **p<0.01, ***p<0.001.
Figure 6.
Figure 6.. In vivo analysis of Ccl19/Ccr7 axis during inflammation.
Pharmacological regulation of lipopolysaccharide (LPS)/Toll-like receptor (TLR) signaling pathway. (A) Annexin-V binding to membrane phosphatidylserine (PS) on lymph node (LN) myeloid populations from wild-type (WT) (left mosaic bars) and Traf6∆∕∆ (right mosaic bars) (n = 4 mice per group) after PBS or LPS administration. LN suspension cells were stained for myeloid surface markers including annexin-V and analyzed by flow cytometry. (B) Transwell migration of low-density bone marrow (LDBM)-derived LK cells toward gradient generated by pre-treated LN cells with dimethylsulfoxide (DMSO) (solid bars) as vehicle control and inhibitors (mosaic bars) against Irak1/4 (right lined), Ubc13 (left lined), and IKK (white squares), and following TLR signaling pathway activation by PBS (black) or LPS (blue). (C) Analysis of SNAP23 phosphorylation (Ser95) in LN myeloid cells previously treated with DMSO (solid bar) as vehicle control, Irak1/4 (right lined mosaic bar), Ubc13 (left lined mosaic bar), or IKK (white squares mosaic bar) inhibitors. Values represent two independent experiments as mean ± SD of two independent experiments performed in triplicate. (D) Mean fluorescence intensity (MFI) quantification of pre-stored Ccl19 into LN-residing CD11blow/CD11c+ cDC from non-manipulated mice by flow cytometry. Values represent mean ± SD of two or three independent experiments. p<0.05, **p<0.01, ***p<0.001.
Figure 6—figure supplement 1.
Figure 6—figure supplement 1.. Traf6 does not associate with changes in survival of hematopoietic cells, and progenitors and Ccl19 can be detected in a specific subpopulation of lymph node (LN) conventional dendritic cells (cDCs).
(A) Apoptosis (TUNELassay) of LK progenitors, Lin- and Lin + bone marrow (BM) cells. (B) Representative overlap histograms of phospho-SNAP23 (pSNAP23) into LN myeloid cells treated with dimethylsulfoxide (DMSO) (upper left), Irak1/4-inh (upper right), Ubc13-inh (lower left), and IKK-inh (lower right) and stimulated with PBS (red lines) or lipopolysaccharide (LPS) (blue lines). (C) Gating strategy to determine Ccl19 pre-stored into LN-residing myeloid cells basally. (D) Mean fluorescence intensity (MFI) quantification of pre-stored Ccl19 in pDC populations in basal conditions.
Author response image 1.
Author response image 1.. Peripheral blood count of myeloid progenitors at ZT7 (3 hours after PBS or LPS administration).
A. Counts in Wt vs Traf6-deficient mice. B. Counts in Wt mice treated with either an isotype control (IgG2a) or neutralizing anti-Ccr7 antibody. C. Counts in Wt mice treated with an isotype control (IgG2a) or anti-Ccl19 neutralizing antibody. No difference is statistically significant.

Similar articles

Cited by

References

    1. Akira S, Takeda K, Kaisho T. Toll-like receptors: critical proteins linking innate and acquired immunity. Nature Immunology. 2001;2:675–680. doi: 10.1038/90609. - DOI - PubMed
    1. Bellet MM, Deriu E, Liu JZ, Grimaldi B, Blaschitz C, Zeller M, Edwards RA, Sahar S, Dandekar S, Baldi P, George MD, Raffatellu M, Sassone-Corsi P. Circadian clock regulates the host response to Salmonella. PNAS. 2013;110:9897–9902. doi: 10.1073/pnas.1120636110. - DOI - PMC - PubMed
    1. Beutler B, Rietschel ET. Innate immune sensing and its roots: the story of endotoxin. Nature Reviews Immunology. 2003;3:169–176. doi: 10.1038/nri1004. - DOI - PubMed
    1. Boettcher S, Ziegler P, Schmid MA, Takizawa H, van Rooijen N, Kopf M, Heikenwalder M, Manz MG. Cutting edge: lps-induced emergency myelopoiesis depends on TLR4-expressing nonhematopoietic cells. The Journal of Immunology. 2012;188:5824–5828. doi: 10.4049/jimmunol.1103253. - DOI - PubMed
    1. Boggs DR. The total marrow mass of the mouse: a simplified method of measurement. American Journal of Hematology. 1984;16:277–286. doi: 10.1002/ajh.2830160309. - DOI - PubMed

Publication types

MeSH terms

Substances