. 2021 Apr 8;6(7):e139497.
doi: 10.1172/jci.insight.139497.

The CRTC1-MAML2 fusion is the major oncogenic driver in mucoepidermoid carcinoma

Affiliations

The CRTC1-MAML2 fusion is the major oncogenic driver in mucoepidermoid carcinoma

Zirong Chen et al. JCI Insight. .

Abstract

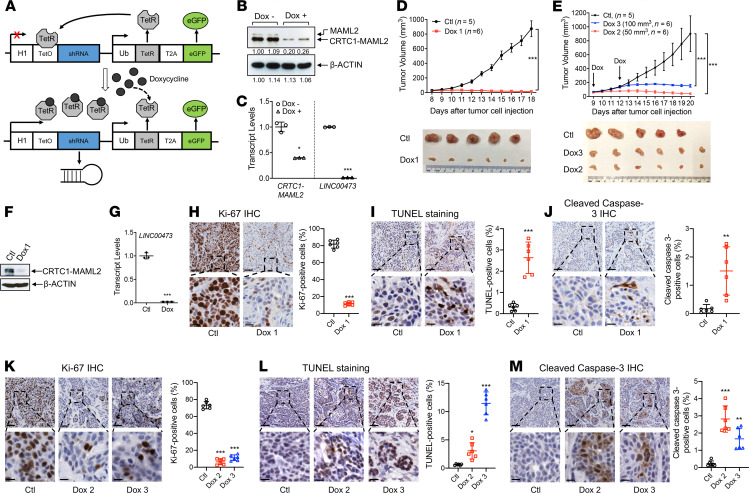
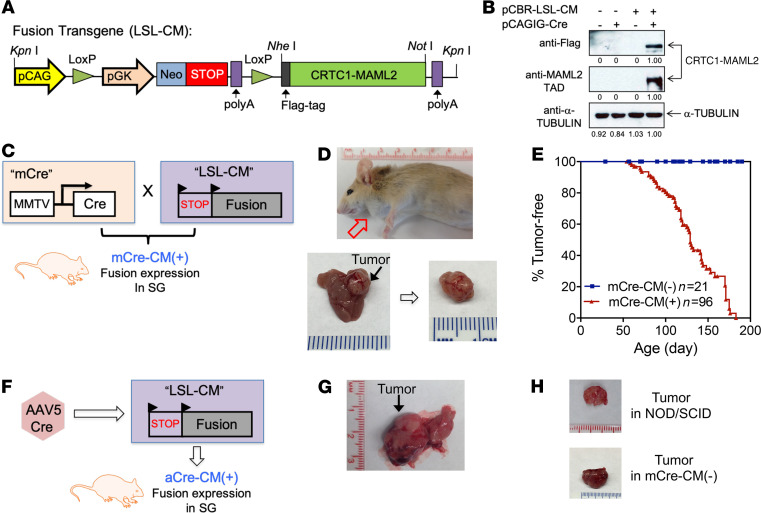
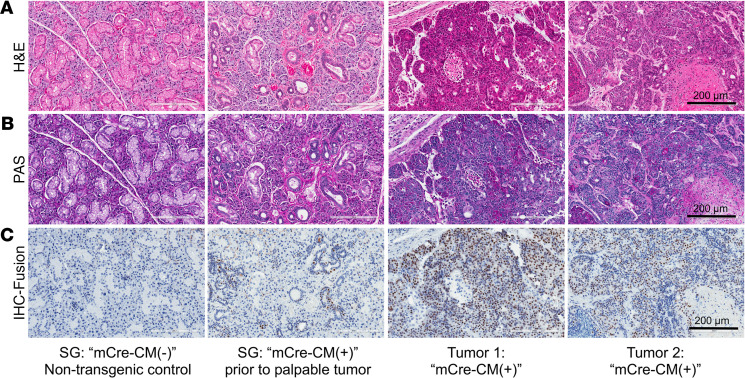
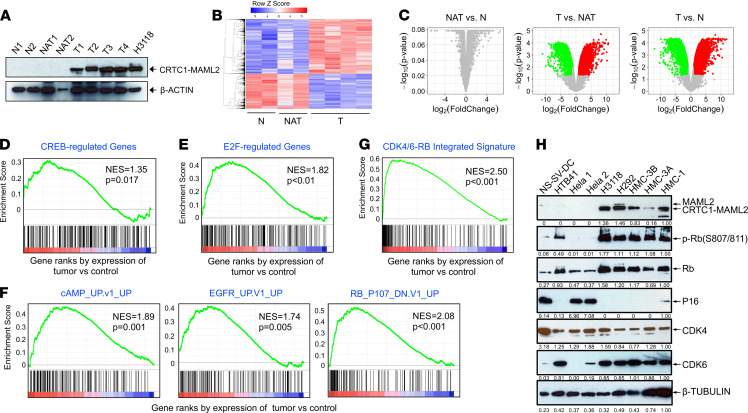
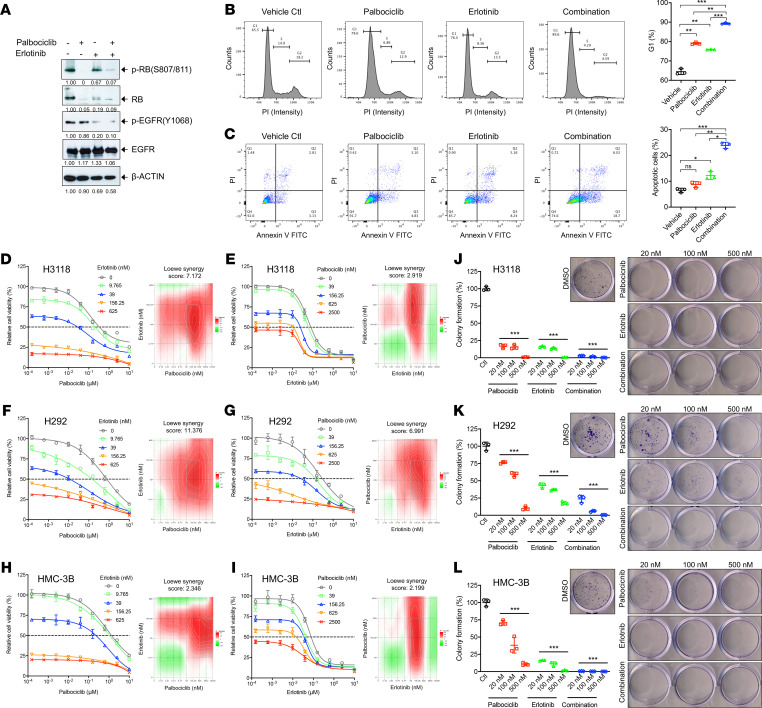
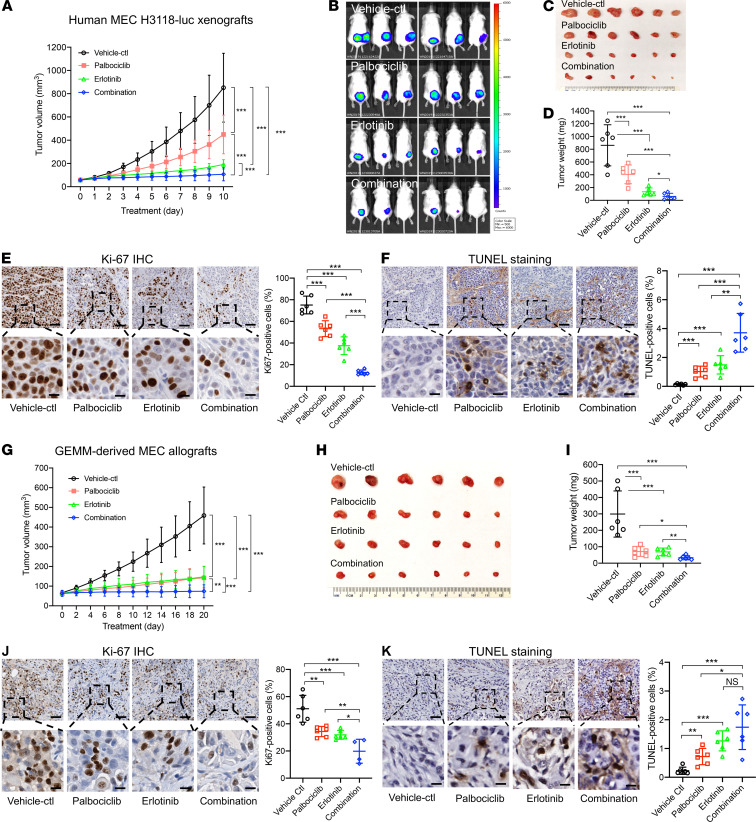
No effective systemic treatment is available for patients with unresectable, recurrent, or metastatic mucoepidermoid carcinoma (MEC), the most common salivary gland malignancy. MEC is frequently associated with a t(11;19)(q14-21;p12-13) translocation that creates a CRTC1-MAML2 fusion gene. The CRTC1-MAML2 fusion exhibited transforming activity in vitro; however, whether it serves as an oncogenic driver for MEC establishment and maintenance in vivo remains unknown. Here, we show that doxycycline-induced CRTC1-MAML2 knockdown blocked the growth of established MEC xenografts, validating CRTC1-MAML2 as a therapeutic target. We further generated a conditional transgenic mouse model and observed that Cre-induced CRTC1-MAML2 expression caused 100% penetrant formation of salivary gland tumors resembling histological and molecular characteristics of human MEC. Molecular analysis of MEC tumors revealed altered p16-CDK4/6-RB pathway activity as a potential cooperating event in promoting CRTC1-MAML2-induced tumorigenesis. Cotargeting of aberrant p16-CDK4/6-RB signaling and CRTC1-MAML2 fusion-activated AREG/EGFR signaling with the respective CDK4/6 inhibitor Palbociclib and EGFR inhibitor Erlotinib produced enhanced antitumor responses in vitro and in vivo. Collectively, this study provides direct evidence for CRTC1-MAML2 as a key driver for MEC development and maintenance and identifies a potentially novel combination therapy with FDA-approved EGFR and CDK4/6 inhibitors as a potential viable strategy for patients with MEC.

Keywords: Head and neck cancer; Mouse models; Oncogenes; Oncology.


Conflict of interest statement

Conflict of interest: The authors have declared that no conflict of interest exists.

Figures

Figure 1
Figure 1. Dox-inducible CRTC1-MAML2–targeting shRNAs decreased the growth of established human MEC xenografts by reducing cell proliferation and enhancing apoptosis.
(A) A diagram of the lentiviral-based vector (FH1tUTG) system for inducible CRTC1-MAML2 fusion–targeting shRNA expression, adapted from Herold et al. (34). (B and C) A stable H3118 MEC cell clone with CRTC1-MAML2 ishRNA (H3118-fusion ishRNA) was treated with 1 μg/mL Dox for 72 hours and analyzed for CRTC1-MAML2 fusion knockdown by Western blotting (B) and LINC00473 expression by qPCR (C). Data are mean ± SD. A 2-tailed t test was used to calculate the P values (*P < 0.05 and ***P < 0.001). (D and E) NOD.SCID mice were injected s.c. with 1 × 10⁶ H3118-fusion ishRNA cells per mouse and provided with Dox or control diet starting on the day of tumor cell injection (Dox 1 cohort) (D) or when tumors reached approximately 50 mm3 (Dox 2 cohort) and approximately 100 mm3 (Dox 3 cohort) (E). Tumor volumes at various days after tumor cell implantation and the images of resected tumors at the endpoint were shown. (F and G) The expression levels of the CRTC1-MAML2 fusion and LINC00473 in Dox-treated versus control xenograft MEC tumors were analyzed by Western blotting (F) and qPCR (G), respectively. β-Actin was used as a protein loading control. (H–M) Cell proliferation and apoptosis were evaluated on 3 Dox-treated versus control MEC xenograft tumor sections by Ki-67 IHC (H and K), TUNEL staining (I and L), and cleaved caspase 3 IHC (J and M). The positively stained nuclei/cells were quantified in 6 randomly selected visual fields (5×, 1000 × 1000 pixels) using ImageJ. Scale bar: 100 μm (upper panels), 25 μm (lower panels). A 2-tailed t test was used for 2-group comparisons and 1-way ANOVA for multiple group comparisons (*P < 0.05, **P < 0.01, ***P < 0.001).
Figure 2
Figure 2. The Cre-regulated CRTC1-MAML2 transgenic mice developed salivary gland tumors.
(A) A schematic representation of the Cre/LoxP-mediated CRTC1-MAML2 fusion transgene construct (LSL-CM). (B) Western blotting confirmed Cre-induced expression of CRTC1-MAML2 transgene. The transgenic construct was cotransfected with pCAGIG-Cre plasmid or empty vector into 293T cells, and the CRTC1-MAML2 fusion expression was detected at 36 hours after transfection by Western blotting using anti-Flag antibodies or anti-MAML2 TAD antibodies. α-Tubulin was used as a loading control. (C) A schematic diagram shows the crossing of the LSL-CM transgenic mice with MMTV-Cre mice to induce CRTC1-MAML2 transgene expression in salivary glands. The resulting mCre-CM(+) mice were monitored for tumor development. (D) A representative mCre-CM(+) mouse developed salivary gland (SG) tumor. (E) Salivary gland tumor occurrence was shown in mCre-CM(+) versus nontransgene mCre-CM(–) control cohorts. Half of mCre-CM(+) mice (n = 96) developed SG tumors by 129 days, while no tumors were observed in the control mCre-CM(–) mice (n = 21). (F) A schematic diagram shows ductal delivery of AAV5-Cre-eGFP viruses to salivary glands of LSL-CM(+) mice. The resulting aCre-CM(+) mice were monitored for tumor development. (G) A representative aCre-CM(+) mouse developed SG tumor at about 3 months after retrograde injection of AAV5-Cre-eGFP viruses. (H) Cell suspensions from primary CRTC1-MAML2–induced salivary gland tumors grew into tumors after s.c. engrafting into immunocompromised NOD.SCID mice or immunocompatible mCre-CM(–) mice containing no CRTC1-MAML2 transgene.
Figure 3
Figure 3. The CRTC1-MAML2 fusion–induced murine salivary gland tumors displayed a characteristic human MEC histological feature and expressed the CRTC1-MAML2 fusion.
(AC) Submandibular glands (SMG) from nontransgenic mCre-CM(–) littermate controls and from mCre-CM(+) mice at age of 4 weeks and salivary gland tumors developed from mCre-CM(+) mice were subjected to H&E staining for histological analysis (A); PAS staining for detecting mucin-expressing cells (B); and IHC staining with anti-MAML2 TAD antibodies for detecting the CRTC1-MAML2 fusion expression (C). Scale bars: 200 μm.
Figure 4
Figure 4. Deregulated cell cycle control in CRTC1-MAML2–induced murine MEC tumors and human CRTC1-MAML2 fusion–positive MEC-derived cell lines.
(A) Western blotting showed expression of the CRTC1-MAML2 fusion transgene in MEC tumors (T) developed from mCre-CM(+) mice, with barely detectable level in their matched tumor-adjacent salivary glands (NAT) or normal salivary glands (N) from nontransgenic mCre-CM(–) mice. β-Actin was used as a loading control. (B) Heatmap shows differentially expressed genes (DEGs) among N, NAT, and T groups. The cutoff criteria were fold-change of ≥ 2 and FDR P < 0.05. (C) Volcano plots shows differentially expressed genes in NAT versus N, T versus NAT, and T versus N groups. Green and red dots represent downregulated and upregulated genes, respectively. (D and E) CREB-regulated genes (D) and E2F-regulated genes (E) were highly enriched in CRTC1-MAML2–induced MEC tumors. (F) Representative oncogenic signatures (cAMP-induced, EGFR-induced, and RB1/RBL1 loss–induced) were enriched in the CRTC1-MAML2–induced MEC tumors. (G) CDK4/6-RB integrated signature was enriched in fusion-induced MEC tumors. (H) Western blot analysis of CRTC1-MAML2, p-Rb, Rb, P16, CDK4, and CDK6 in human fusion–negative cell lines — including a normal human immortalized salivary gland ductal cell line (NS-SV-DC), a submaxillary gland undifferentiated epidermoid carcinoma cell line (HTB-41), a cervical carcinoma cell line from 2 sources (Hela 1 and Hela 2) — and fusion-positive cell lines, including a lung mucoepidermoid cell line (H292), a parotid mucoepidermoid cell line (H3118), MEC cell lines from a palate-derived local recurrent MEC tumors and its lymph node metastasis (HMC-3A and HMC-3B), and a minor salivary gland buccal mucosa-derived mucoepidermoid (HMC-1) cell line. β-Tubulin was used as a loading control.
Figure 5
Figure 5. Combination of CDK4/6 inhibitor and EGFR inhibitor led to enhanced inhibition of human MEC cell growth and clonal expansion in vitro.
(A) Human MEC H3118 cells were treated with Palbociclib (1 μM) and Erlotinib (1 μM) individually or in combination for 24 hours. Cell lysates were harvested for Western blotting analysis. (B and C) H3118 cells were treated with Palbociclib (200 nM) and Erlotinib (200 nM), individually or in combination. Cell cycle analysis was performed 48 hours after treatment, and cells in G1 were quantified (B). Annexin V/PI staining was performed at 72 hours after treatment, and apoptotic cells were quantified (C). (DI) Human MEC cells, H3118, H292, and HMC-3B, were treated with 9-point dose concentrations of Palbociclib (1:4 dilutions starting from 10 μM) and 4 doses of static Erlotinib concentrations plus vehicle control (0, 9.8 nM, 39 nM, 156 nM, 625 nM) (D, F, and H) or 9-point dose concentrations of Erlotinib (1:4 dilutions starting from 10 μM) and 4 doses of static Palbociclib concentrations plus control (0, 39 nM, 156 nM, 625 nM, 2.5 μM) (E,G, and I) for 72 hours. Synergistic analysis was conducted using SynergyFinder2.0 with the Loewe’s reference model. Loewe’s synergy scores and color scale bars indicate strength of interaction with synergistic effect shown in red in heatmaps. (JL) Human MEC cells were seeded at 500 cells per well in 12-well plates and treated with vehicle control, Palbociclib, Erlotinib, or a combination of Palbociclib and Erlotinib the next day (n = 3 for each group). After 2-week culture, the colonies were stained with crystal violet and counted by using ImageJ software. The percentage of colony formation was represented as the ratio of the colony number in drug-treated groups to DMSO vehicle control. Data are mean ± SD. One-way ANOVA for multiple comparisons was used to calculate the P values (*P < 0.05, **P < 0.01, ***P < 0.001).
Figure 6
Figure 6. Concurrent CDK4/6 and EGFR inhibition showed enhanced antitumor effect in both human MEC xenograft and mouse CRTC1-MAML2–induced MEC allograft models.
(AF) Human CRTC1-MAML2 fusion–positive luciferase–expressing MEC (H3118-luc) xenografts were treated with vehicle control (n = 6), 25 mg/kg Palbociclib (n = 6), 25 mg/kg Erlotinib (n = 6), or 25 mg/kg Palbociclib plus 25 mg/kg Erlotinib (n = 6) via oral gavage daily for 10 days. The tumors were measured daily after treatment, and the tumor growth curve was represented by tumor volumes. (BF) Bioluminescent imaging of the xenograft tumors (B), tumor images (C), and tumor weights (D) were presented on the final day of treatment. (E and F) Representative images of IHC staining of Ki-67 (E) and TUNEL (F) on xenograft tumor sections for vehicle control, Palbociclib, Erlotinib, or their combination. (GK) The CRTC1-MAML2–positive mouse MEC allografts were treated with vehicle control (n = 6), 25 mg/kg Palbociclib (n = 6), 25 mg/kg Erlotinib (n = 6), or the 2 inhibitors in combination (1:1 ratio) (n = 6) via oral gavage daily for 20 days. The tumor volumes were measured every other day after treatment (G), tumor images (H), and weights (I) at the endpoint were presented. Representative images of Ki-67 IHC (J) and TUNEL staining (K) of allograft tumor sections were shown. The staining-positive cells in the tumor sections were quantified by ImageJ. Data are mean ± SD. One-way ANOVA test was used for multiple comparisons (*P < 0.05, **P < 0.01, ***P < 0.001). Scale bars: 100 μm (upper panels), 25 μm (lower panels).

Similar articles

Cited by

References

    1. Kaye FJ. Mutation-associated fusion cancer genes in solid tumors. Mol Cancer Ther. 2009;8(6):1399–1408. doi: 10.1158/1535-7163.MCT-09-0135. - DOI - PMC - PubMed
    1. Mitelman F, et al. The impact of translocations and gene fusions on cancer causation. Nat Rev Cancer. 2007;7(4):233–245. doi: 10.1038/nrc2091. - DOI - PubMed
    1. Latysheva NS, Babu MM. Discovering and understanding oncogenic gene fusions through data intensive computational approaches. Nucleic Acids Res. 2016;44(10):4487–4503. doi: 10.1093/nar/gkw282. - DOI - PMC - PubMed
    1. Cocco E, et al. NTRK fusion-positive cancers and TRK inhibitor therapy. Nat Rev Clin Oncol. 2018;15(12):731–747. doi: 10.1038/s41571-018-0113-0. - DOI - PMC - PubMed
    1. Druker BJ, et al. Effects of a selective inhibitor of the Abl tyrosine kinase on the growth of Bcr-Abl positive cells. Nat Med. 1996;2(5):561–566. doi: 10.1038/nm0596-561. - DOI - PubMed

Publication types

MeSH terms