DNA Breaks-Mediated Fitness Cost Reveals RNase HI as a New Target for Selectively Eliminating Antibiotic-Resistant Bacteria
- PMID: 33830249
- PMCID: PMC8321526
- DOI: 10.1093/molbev/msab093
DNA Breaks-Mediated Fitness Cost Reveals RNase HI as a New Target for Selectively Eliminating Antibiotic-Resistant Bacteria
Abstract
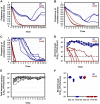
Antibiotic resistance often generates defects in bacterial growth called fitness cost. Understanding the causes of this cost is of paramount importance, as it is one of the main determinants of the prevalence of resistances upon reducing antibiotics use. Here we show that the fitness costs of antibiotic resistance mutations that affect transcription and translation in Escherichia coli strongly correlate with DNA breaks, which are generated via transcription-translation uncoupling, increased formation of RNA-DNA hybrids (R-loops), and elevated replication-transcription conflicts. We also demonstrated that the mechanisms generating DNA breaks are repeatedly targeted by compensatory evolution, and that DNA breaks and the cost of resistance can be increased by targeting the RNase HI, which specifically degrades R-loops. We further show that the DNA damage and thus the fitness cost caused by lack of RNase HI function drive resistant clones to extinction in populations with high initial frequency of resistance, both in laboratory conditions and in a mouse model of gut colonization. Thus, RNase HI provides a target specific against resistant bacteria, which we validate using a repurposed drug. In summary, we revealed key mechanisms underlying the fitness cost of antibiotic resistance mutations that can be exploited to specifically eliminate resistant bacteria.
Keywords: DNA breaks; RNase HI targeting; antibiotic resistance; fitness cost; repurposed drug.
© The Author(s) 2021. Published by Oxford University Press on behalf of the Society for Molecular Biology and Evolution.
Figures


Similar articles
-
Mutations reducing replication from R-loops suppress the defects of growth, chromosome segregation and DNA supercoiling in cells lacking topoisomerase I and RNase HI activity.DNA Repair (Amst). 2016 Apr;40:1-17. doi: 10.1016/j.dnarep.2016.02.001. Epub 2016 Feb 27. DNA Repair (Amst). 2016. PMID: 26947024
-
Multidrug-resistant bacteria compensate for the epistasis between resistances.PLoS Biol. 2017 Apr 18;15(4):e2001741. doi: 10.1371/journal.pbio.2001741. eCollection 2017 Apr. PLoS Biol. 2017. PMID: 28419091 Free PMC article.
-
Escherichia coli RNase HI inhibits murine leukaemia virus reverse transcription in vitro and yeast retrotransposon Ty1 transposition in vivo.Genes Cells. 1996 Jun;1(6):581-93. doi: 10.1046/j.1365-2443.1996.d01-265.x. Genes Cells. 1996. PMID: 9078387
-
Antibiotic resistance and its cost: is it possible to reverse resistance?Nat Rev Microbiol. 2010 Apr;8(4):260-71. doi: 10.1038/nrmicro2319. Epub 2010 Mar 8. Nat Rev Microbiol. 2010. PMID: 20208551 Review.
-
Evolutionary Mechanisms Shaping the Maintenance of Antibiotic Resistance.Trends Microbiol. 2018 Aug;26(8):677-691. doi: 10.1016/j.tim.2018.01.005. Epub 2018 Feb 10. Trends Microbiol. 2018. PMID: 29439838 Review.
Cited by
-
Epistasis decreases with increasing antibiotic pressure but not temperature.Philos Trans R Soc Lond B Biol Sci. 2023 May 22;378(1877):20220058. doi: 10.1098/rstb.2022.0058. Epub 2023 Apr 3. Philos Trans R Soc Lond B Biol Sci. 2023. PMID: 37004727 Free PMC article.
-
CRISPR-Cas Systems in the Fight Against Antimicrobial Resistance: Current Status, Potentials, and Future Directions.Infect Drug Resist. 2024 Nov 26;17:5229-5245. doi: 10.2147/IDR.S494327. eCollection 2024. Infect Drug Resist. 2024. PMID: 39619730 Free PMC article. Review.
-
Strong selective environments determine evolutionary outcome in time-dependent fitness seascapes.Evol Lett. 2022 May 26;6(3):266-279. doi: 10.1002/evl3.284. eCollection 2022 Jun. Evol Lett. 2022. PMID: 35784450 Free PMC article.
-
RNase HI Depletion Strongly Potentiates Cell Killing by Rifampicin in Mycobacteria.Antimicrob Agents Chemother. 2022 Oct 18;66(10):e0209121. doi: 10.1128/aac.02091-21. Epub 2022 Sep 26. Antimicrob Agents Chemother. 2022. PMID: 36154174 Free PMC article.
-
New option: targeting RNase J and RNase HI in the fight against multi-drug-resistant tuberculosis.Ann Med Surg (Lond). 2024 Mar 4;86(5):2376-2378. doi: 10.1097/MS9.0000000000001859. eCollection 2024 May. Ann Med Surg (Lond). 2024. PMID: 38694338 Free PMC article. No abstract available.
References
-
- Almeida Da Silva PEA, Palomino JC.. 2011. Molecular basis and mechanisms of drug resistance in Mycobacterium tuberculosis: classical and new drugs. J Antimicrob Chemother. 66(7):1417–1430. - PubMed
-
- Andersson DI, Balaban NQ, Baquero F, Courvalin P, Glaser P, Gophna U, Kishony R, Molin S, Tønjum T.. 2020. Antibiotic resistance: turning evolutionary principles into clinical reality. FEMS Microbiol Rev. 44(2):171–188. - PubMed
-
- Andersson DI, Hughes D.. 2010. Antibiotic resistance and its cost: is it possible to reverse resistance? Nat Rev Microbiol. 8(4):260–271. - PubMed
-
- Andersson DI, Levin BR.. 1999. The biological cost of antibiotic resistance. Curr Opin Microbiol. 2(5):489–493. - PubMed
Publication types
MeSH terms
Substances
LinkOut - more resources
Full Text Sources
Other Literature Sources
Medical

