Dietary Selenium Requirement for the Prevention of Glucose Intolerance and Insulin Resistance in Middle-Aged Mice
- PMID: 33830273
- PMCID: PMC8502482
- DOI: 10.1093/jn/nxab053
Dietary Selenium Requirement for the Prevention of Glucose Intolerance and Insulin Resistance in Middle-Aged Mice
Abstract
Background: Although dietary selenium (Se) deficiency or excess induces type 2 diabetes-like symptoms in mice, suboptimal body Se status usually causes no symptoms but may promote age-related decline in overall health.
Objectives: We sought to determine the dietary Se requirement for protection against type 2 diabetes-like symptoms in mice.
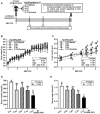
Methods: Thirty mature (aged 4 mo) male C57BL/6J mice were fed a Se-deficient torula yeast AIN-93M diet supplemented with Na2SeO4 in graded concentrations totaling 0.01 (basal), 0.04, 0.07, 0.10, and 0.13 (control) mg Se/kg for 4 mo (n = 6) until they were middle-aged (8 mo). Droplets of whole blood were used to determine glucose tolerance and insulin sensitivity in the mice from ages 5 to 8 mo. Postmortem serum, liver, and skeletal muscle were collected to assay for selenoprotein expression and markers of glucose metabolism. Data were analyzed by 1-way ANCOVA with or without random effects for time-repeated measurements using live mice or postmortem samples, respectively.
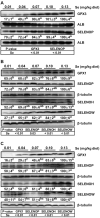
Results: Compared with control, the consumption of basal diet increased (P < 0.05) fasting serum insulin (95% CI: 52%, 182%) and leptin (95% CI: 103%, 118%) concentrations in middle-aged mice. Dietary Se insufficiency decreased (P < 0.05) 1) glucose tolerance (13-79%) and insulin sensitivity (15-65%) at ≤0.10 mg Se/kg; 2) baseline thymoma viral proto-oncogene phosphorylation on S473 (27-54%) and T308 (22-46%) at ≤0.10 and ≤0.07 mg Se/kg, respectively, in the muscle but not the liver; and 3) serum glutathione peroxidase 3 (51-83%), liver and muscle glutathione peroxidase 1 (32-84%), serum and liver selenoprotein P (28-42%), and liver and muscle selenoprotein H (39-48%) and selenoprotein W (16-73%) protein concentrations at ≤0.04, ≤0.10, ≤0.07, and ≤0.10 mg Se/kg, respectively.
Conclusions: Mice fed diets containing ≤0.10 mg Se/kg display impaired glucose tolerance and insulin sensitivity, suggesting increased susceptibility to type 2 diabetes by suboptimal Se status at levels ≤23% of nutritional needs.
Keywords: age; glucose intolerance; insulin resistance; selenium; type 2 diabetes.
© The Author(s) 2021. Published by Oxford University Press on behalf of the American Society for Nutrition.
Figures


Similar articles
-
Analyses of Selenotranscriptomes and Selenium Concentrations in Response to Dietary Selenium Deficiency and Age Reveal Common and Distinct Patterns by Tissue and Sex in Telomere-Dysfunctional Mice.J Nutr. 2017 Oct;147(10):1858-1866. doi: 10.3945/jn.117.247775. Epub 2017 Aug 30. J Nutr. 2017. PMID: 28855418
-
Both maximal expression of selenoproteins and selenoprotein deficiency can promote development of type 2 diabetes-like phenotype in mice.Antioxid Redox Signal. 2011 Jun 15;14(12):2327-36. doi: 10.1089/ars.2010.3526. Epub 2011 Mar 21. Antioxid Redox Signal. 2011. PMID: 21194350 Free PMC article.
-
A high isoflavone diet decreases 5' adenosine monophosphate-activated protein kinase activation and does not correct selenium-induced elevations in fasting blood glucose in mice.Nutr Res. 2014 Apr;34(4):308-17. doi: 10.1016/j.nutres.2014.03.003. Epub 2014 Mar 14. Nutr Res. 2014. PMID: 24774067
-
Interference of selenium and selenoproteins with the insulin-regulated carbohydrate and lipid metabolism.Free Radic Biol Med. 2013 Dec;65:1538-1547. doi: 10.1016/j.freeradbiomed.2013.07.016. Epub 2013 Jul 18. Free Radic Biol Med. 2013. PMID: 23872396 Review.
-
Selenium and diabetes--evidence from animal studies.Free Radic Biol Med. 2013 Dec;65:1548-1556. doi: 10.1016/j.freeradbiomed.2013.07.012. Epub 2013 Jul 16. Free Radic Biol Med. 2013. PMID: 23867154 Free PMC article. Review.
Cited by
-
Selenoprotein P1 as a biomarker of insulin resistance in pediatric obesity: Insights and implications.World J Clin Pediatr. 2025 Mar 9;14(1):99652. doi: 10.5409/wjcp.v14.i1.99652. eCollection 2025 Mar 9. World J Clin Pediatr. 2025. PMID: 40059895 Free PMC article.
-
Dietary Selenium Deficiency Accelerates the Onset of Aging-Related Gut Microbial Changes in Aged Telomere-Humanized Mice, With Akkermansia muciniphila Being the Most Prominent and Alleviating Selenium Deficiency-Induced Type 2 Diabetes.Aging Cell. 2025 Aug;24(8):e70130. doi: 10.1111/acel.70130. Epub 2025 Jun 20. Aging Cell. 2025. PMID: 40540389 Free PMC article.
-
Dietary Selenium Deficiency Partially Mimics the Metabolic Effects of Arsenic.Nutrients. 2021 Aug 23;13(8):2894. doi: 10.3390/nu13082894. Nutrients. 2021. PMID: 34445052 Free PMC article.
-
Selenoprotein F Knockout Caused Glucose Metabolism Disorder in Young Mice by Disrupting Redox Homeostasis.Antioxidants (Basel). 2022 Oct 25;11(11):2105. doi: 10.3390/antiox11112105. Antioxidants (Basel). 2022. PMID: 36358477 Free PMC article.
-
Characterization and Quantification of Selenoprotein P: Challenges to Mass Spectrometry.Int J Mol Sci. 2021 Jun 11;22(12):6283. doi: 10.3390/ijms22126283. Int J Mol Sci. 2021. PMID: 34208081 Free PMC article. Review.
References
-
- Xia YM, Hill KE, Burk RF. Biochemical studies of a selenium-deficient population in China: measurement of selenium, glutathione peroxidase and other oxidant defense indices in blood. J Nutr. 1989;119:1318–26. - PubMed
-
- Yang GQ, Wang SZ, Zhou RH, Sun SZ. Endemic selenium intoxication of humans in China. Am J Clin Nutr. 1983;37:872–81. - PubMed
-
- McCann JC, Ames BN. Adaptive dysfunction of selenoproteins from the perspective of the triage theory: why modest selenium deficiency may increase risk of diseases of aging. FASEB J. 2011;25:1793–814. - PubMed
-
- Zhang L, Zeng H, Cheng WH. Beneficial and paradoxical roles of selenium at nutritional levels of intake in healthspan and longevity. Free Radic Biol Med. 2018;127:3–13. - PubMed
-
- Rayman MP. Selenium and human health. Lancet North Am Ed. 2012;379:1256–68. - PubMed
Publication types
MeSH terms
Substances
Grants and funding
LinkOut - more resources
Full Text Sources
Other Literature Sources
Medical

