. 2021 May 17;131(10):e146832.
doi: 10.1172/JCI146832.

Atractylenolide I enhances responsiveness to immune checkpoint blockade therapy by activating tumor antigen presentation

Affiliations

Atractylenolide I enhances responsiveness to immune checkpoint blockade therapy by activating tumor antigen presentation

Hanchen Xu et al. J Clin Invest. .

Abstract

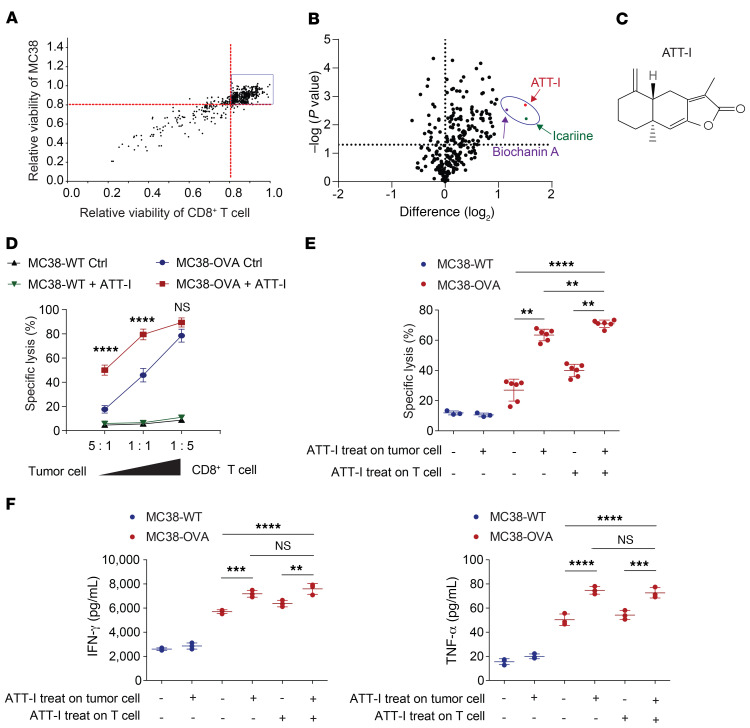
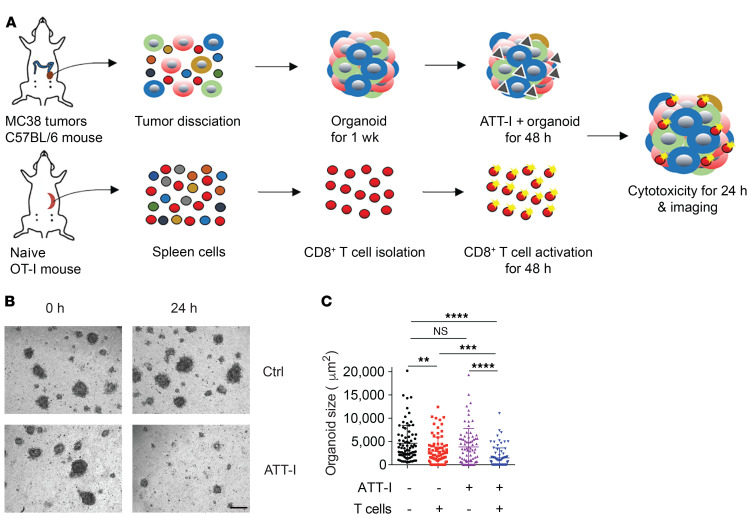
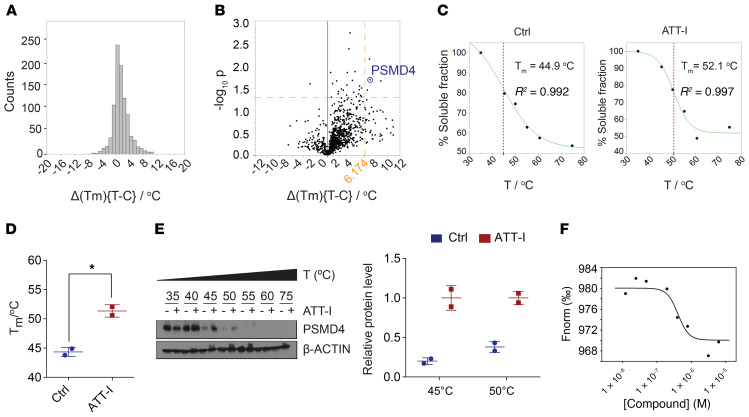
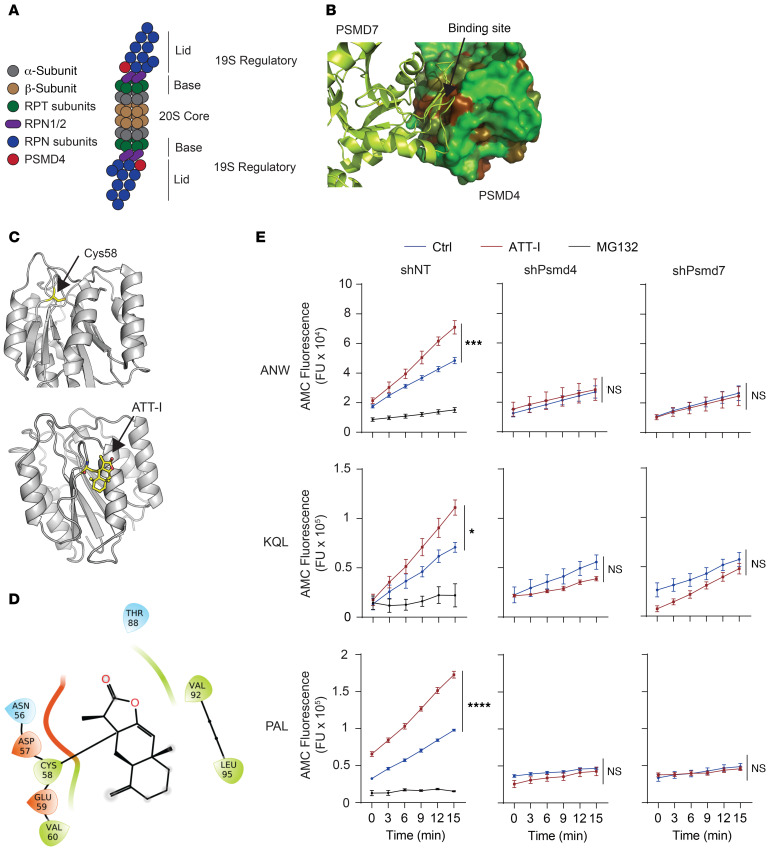
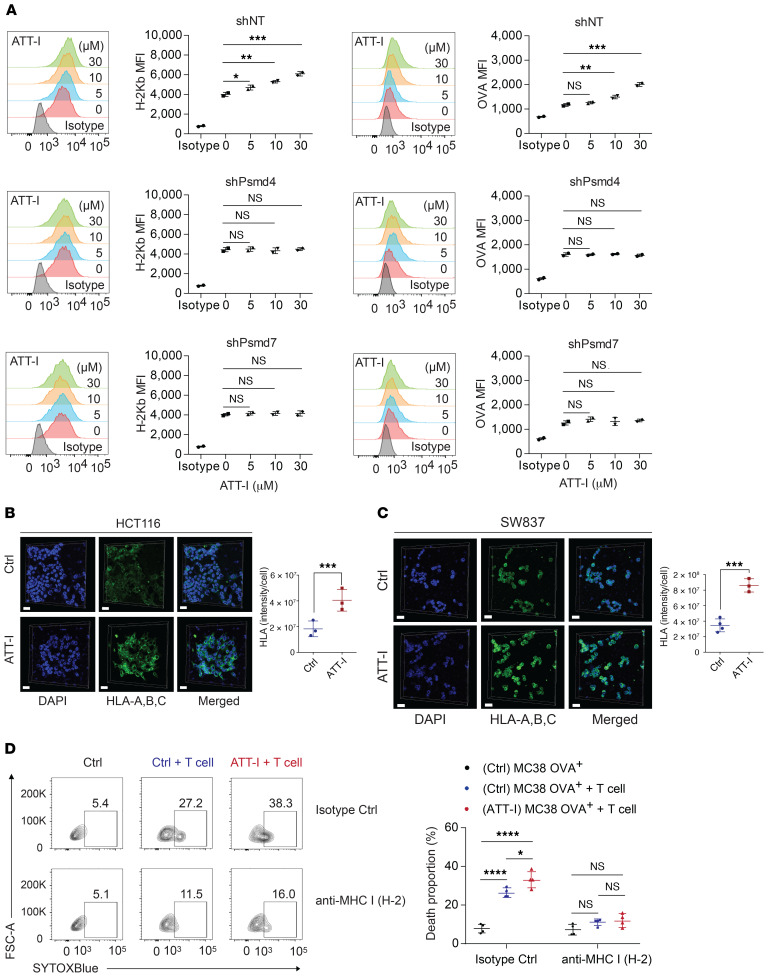
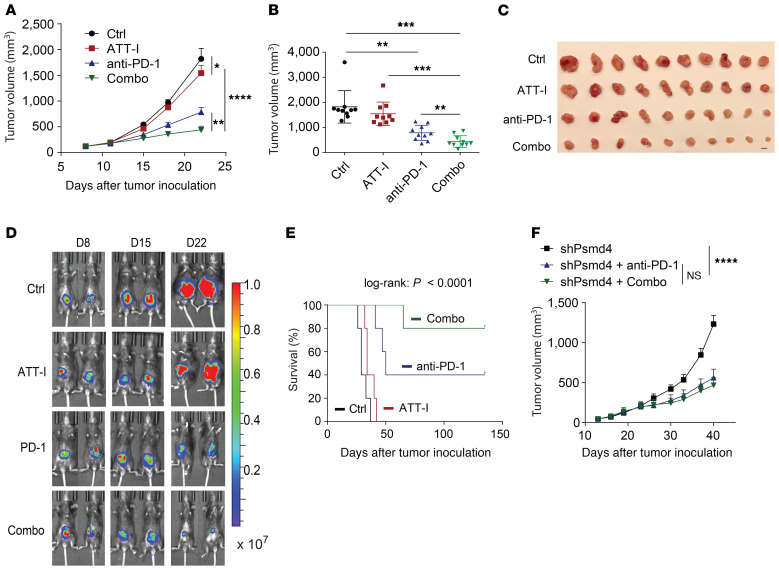
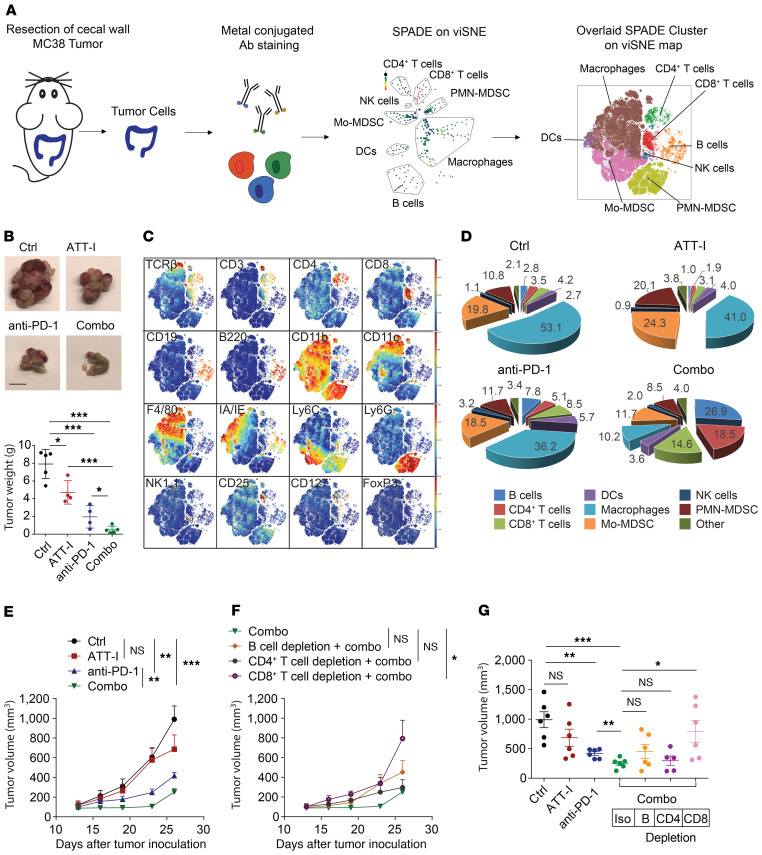
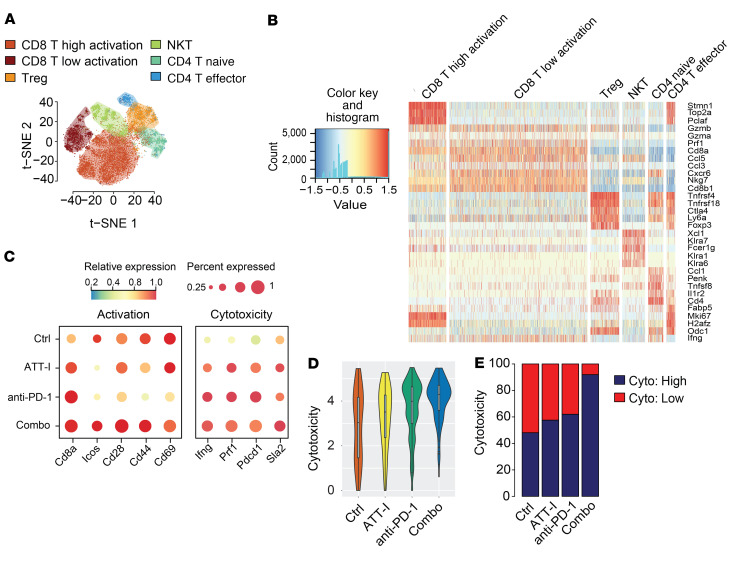
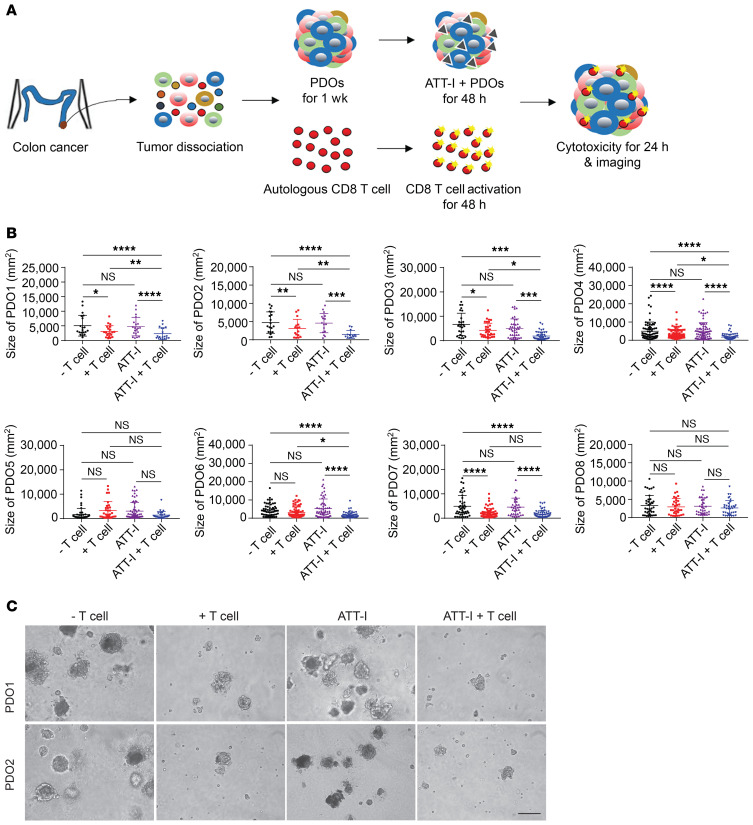
One of the primary mechanisms of tumor cell immune evasion is the loss of antigenicity, which arises due to lack of immunogenic tumor antigens as well as dysregulation of the antigen processing machinery. In a screen for small-molecule compounds from herbal medicine that potentiate T cell-mediated cytotoxicity, we identified atractylenolide I (ATT-I), which substantially promotes tumor antigen presentation of both human and mouse colorectal cancer (CRC) cells and thereby enhances the cytotoxic response of CD8+ T cells. Cellular thermal shift assay (CETSA) with multiplexed quantitative mass spectrometry identified the proteasome 26S subunit non-ATPase 4 (PSMD4), an essential component of the immunoproteasome complex, as a primary target protein of ATT-I. Binding of ATT-I with PSMD4 augments the antigen-processing activity of immunoproteasome, leading to enhanced MHC-I-mediated antigen presentation on cancer cells. In syngeneic mouse CRC models and human patient-derived CRC organoid models, ATT-I treatment promotes the cytotoxicity of CD8+ T cells and thus profoundly enhances the efficacy of immune checkpoint blockade therapy. Collectively, we show here that targeting the function of immunoproteasome with ATT-I promotes tumor antigen presentation and empowers T cell cytotoxicity, thus elevating the tumor response to immunotherapy.

Keywords: Antigen processing; Cancer immunotherapy; Colorectal cancer; Immunology; Oncology.


Conflict of interest statement

Conflict of interest: XL, XZ, and KVDJ submitted a patent (no. 63/122,232) for the method to sensitize cancer cells in immunotherapy using ATT-I.

Figures

Figure 1
Figure 1. ATT-I enhances the killing efficiency of CD8+ T cells against tumor cells.
(A) A total of 594 natural small molecule compounds purified from traditional medicinal plants were tested for their toxicity on MC38 cells and T cells freshly isolated from C57BL/6 mice. Data are presented as mean of 3 independent experiments. (B) The 446 drugs with low toxicity from (A) were tested for their effects on the CD8+ T cell–mediated cytotoxicity. MC38-OVA cells expressing luciferase were cocultured with OT-I CD8+ T cells in the presence of each drug (5.0 μM) and the T cell–mediated cytotoxicity was measured by the luciferase assay. Difference (log2): (log2 [relative viability] > 1; P < 0.05). Relative viability = (tumor cell viability of treated group) / (tumor cell viability of control group). Data are presented as mean of 3 independent experiments. Statistical analysis was conducted using 1-way ANOVA. (C) Chemical structure of ATT-I. (D) The effect of ATT-I treatment on the CD8+ T cell killing of MC38-OVA cells was measured under different ratios of tumor cells versus T cells as indicated. Data are presented as mean ± SD of 3 independent experiments. Statistical analysis was conducted using 2-way ANOVA. (E) CD8+ T cell killing assays were conducted using coculture of MC38-OVA cells and OT-I CD8+ T cells pretreated with 5 μM of ATT-I (+) or vehicle control DMSO (–). Data are presented as mean ± SD of 3 independent experiments. (F) The levels of IFN-γ (left) and TNF-α (right) in the supernatants after coculture of OT-I T cells and MC38-OVA cells pretreated with ATT-I (+) or DMSO control (–) were determined by ELISA. Data are presented as mean ± SD of 3 independent experiments. Statistical analyses were conducted using 2-way ANOVA. **P < 0.01; ***P < 0.001; ****P < 0.0001.
Figure 2
Figure 2. ATT-I enhances the antigen-specific T cell responses in MC38 tumor–derived organoids.
(A) Schematic representation of the MC38-OVA–derived organoid killing assay. OT-I CD8+ T cells were cocultured with tumor organoids generated from MC38-derived tumors in C57BL/6 mice with or without ATT-I treatment. (B) Representative figures of MC38-derived tumor organoids taken at the indicated timepoints from the same well with control or ATT-I treatment. Scale bar: 100 μm. (C) Quantification of the organoid size presented as mean ± SD of 3 parallel experiments. The size of organoids was measured as project area (μm2) using Image J software. Statistical analysis was conducted using 2-way ANOVA. **P < 0.01; ***P < 0.001; ****P < 0.0001.
Figure 3
Figure 3. PSMD4 is identified as a molecular target of ATT-I in the immunoproteasome.
(AD) Cellular thermal shift assay was conducted to identify potential molecular targets of ATT-I in MC38 cells using melting temperature (Tm) shifts. (A) Distribution plots of Δ(Tm) values for proteins from control and ATT-I–treated cells. (B) Volcano plots of Δ(Tm) values to identify potential targets of ATT-I with the most significant melting temperature changes. PSMD4 is indicated on the plots. (C) Temperature based protein-nondenaturation curves for PSMD4 in control and ATT-I–treated cell lysates. (D) Quantitative data from (C) are presented as mean ± SD of 2 parallel experiments (n = 2). Unpaired 2-tailed t test was used for statistical analysis. (E) Representative immunoblots of PSMD4 in the MC38 cell lysates with or without ATT-I treatment are shown. (F) Microscale thermophoresis (MST) binding assay determined the Kd value (Kd = 0.4 μM) for the binding of ATT-I toward PSMD4. Data shown are representative of 4 independent experiments. *P < 0.05.
Figure 4
Figure 4. ATT-I binds to PSMD4 and stabilizes the PSMD4 and PSMD7 interaction, leading to enhanced proteasomal activities.
(A) Schematic representation of the immunoproteasome. (B) Three-dimensional structure of the complex between PSMD4 and PSMD7 obtained from the cryo-EM structure of the 26S proteasome (PDB code 6EPD). PSMD4 is shown in solvent-accessible surface area, color-coded based on hydrophobicity (brown is hydrophobic and green hydrophilic). PSMD7 is shown in green ribbon representation. (C) Three-dimensional structure of PSMD4 shown in gray ribbon representation. The cysteine residue Cys58 located at the PSMD4 and PSMD7 interface is shown in capped-sticks rendering (upper panel). The predicted structure of the covalent complex between PSMD4 and ATT-I (bottom panel). PSMD4 is shown in gray ribbon rendering, and Cys-58 and ATT-I are depicted in capped-sticks representation (yellow, red, blue, and gold correspond to carbon, oxygen, nitrogen, and sulfur, respectively). (D) Ligand interaction diagram showing individual interaction of ATT with neighboring amino acids on PSMD4. (E) Activity analysis of immunoproteasomes purified from control or PSMD4-knockdown MC38 cell lysates upon treatment with ATT-I using different substrates (ANW, KQL, and PAL) as indicated. Quantitative data are presented as mean ± SD of 2 parallel experiments (n = 2). Statistical analysis was conducted using 2-way ANOVA. *P < 0.05; ***P < 0.001; ****P < 0.0001.
Figure 5
Figure 5. ATT-I enhances antigen presentation on tumor cells.
(A) MFI values of H-2Kb and H-2Kb-SIINFEKL (OVA) on the MC38-OVA cells (shNT control, shPsmd4, and shPsmd7) with ATT-I (0, 5, 10, and 30 μM), which were determined by flow cytometry analysis. Data are presented as mean ± SEM and are representative of 2 independent experiments (n = 2). Statistical analysis was conducted using 1-way ANOVA. (B and C) HLA-A,B,C on the surface of HCT116 cells (B) and SW837 cells (C) was analyzed by 3D confocal imaging of immunofluorescence. Cell nucleus was stained by 4′,6-diamidino-2-phenylindole (DAPI). Quantitative data are presented as mean ± SD of 3 to 4 parallel experiments (n = 3–4). Unpaired 2-tailed t test was used for statistical analysis. Scale bars in B and C: 30 μm. (D) The effect of ATT-I on the cytotoxicity of MC38 OVA+ after blocking the MHC-I/TCR interaction using the MHC-I antibody. Specifically, we treated MC38 OVA+ cells with and without 30 μM ATT-I for 48 hours. Rat IgG2a isotype control and anti-mouse MHC class I (H2) were used for blocking the cells overnight. The antigen-specific cytotoxicity was analyzed by flow cytometry. Data are presented as mean ± SEM and are representative of 2 independent experiments (n = 4). Statistical analysis was conducted using 1-way ANOVA. *P < 0.05; **P < 0.01; ***P < 0.001.
Figure 6
Figure 6. ATT-I enhances the immune checkpoint blockade immune responses.
(AC) Effects of the ATT-I (daily) and anti–PD-1 (3 times/week, 5 injections in total) on tumor growth (A) and tumor volume (B) of MC38-derived tumors in the subcutaneous C57BL/6 mouse model. Error bars represent SEM (n = 10 mice per group). Data shown are 1 representative of 2 independent experiments. Statistical analysis was conducted using 2-way ANOVA (A) and 1-way ANOVA (B). Pictures of the resected tumors (C). Scale bar: 1 cm. (D and E) Effects of the ATT-I (50 mg/kg, daily) and anti–PD-1 (200 μg/mouse, 3 times/week, 5 injections in total) on tumor growth, measured via bioluminescence imaging (F) and survival (G) on the orthotopic MC38-derived tumor model (log-rank test). Each group includes 5 mice. (F) Tumor growth curves of MC38-derived tumors with or without PSMD4 knockdown and treated with anti–PD-1 only or anti–PD-1 together with ATT-I (combo). Each group includes 6 mice. Statistical analysis was conducted using 2-way ANOVA. *P < 0.05; **P < 0.01; ***P < 0.001; ****P < 0.0001.
Figure 7
Figure 7. ATT-I enhances tumor-infiltrating lymphocytes and antitumor activity of cytotoxic T lymphocytes.
(A) Schematic illustration of the immune composition analysis using single-cell mass cytometry (CyTOF). Orthotopic MC38 tumors were surgically resected, dissociated to single cells, and stained with metal isotope–conjugated antibodies. Immune profiles were assessed via CyTOF (26 markers) and analyzed using the Cytobank platform. viSNE analysis was performed, and thereafter SPADE on viSNE was assessed for an overlaid clustering of the immune cell populations. (B) Representative MC38 tumor images and weights of cecal wall implanted tumors (n = 5 in each group). Statistical analysis was conducted using 1-way ANOVA. Scale bar: 1 cm. (C) viSNE plots of the indicated markers used for the determination of the cell population gates. (D) Percentages of distinct immune cell populations within the CD45+ infiltrating immune cells in colorectal cancer tumors analyzed with Cytobank (n = 5). (EG) Once the subcutaneous MC38 tumors were established, mice were randomly assigned into 7 groups and treated as indicated. Effects of the ATT-I (50 mg/kg, daily) and anti–PD-1 (3 times/week, 5 injections in total) treatment on tumor growth (E and F) and tumor volume (G) upon depletion of B cells, CD4+ T cells, and CD8+ T cells (n = 6). Error bars represent SEM and statistical analysis were conducted using 2-way ANOVA (E and F) and 1-way ANOVA (G). *P < 0.05; **P < 0.01; ***P < 0.001.
Figure 8
Figure 8. Single-cell RNA-seq analysis of mouse colorectal tumors treated with ATT-I in combination with immune checkpoint blockade therapy.
C57BL/6 mice bearing orthotopic implanted MC38-derived tumors were treated with vehicle control, ATT-I (50 mg/kg, daily), anti–PD-1 (3 times/week, 5 times in total), or ATT-I + anti–PD-1 combo. Tumors were harvested 2 weeks after initial treatment (5 tumor samples were pooled per arm). (A) t-SNE plot of the scRNA-seq data collected from all conditions. Cell types were assessed by the expression levels of known marker genes. (B) Gene expression profiles of functional marker genes in selected immune cell types. Each row and column represents 1 gene and 1 cell type, respectively. (C) Averaged expression levels of T cell activation and cytotoxic marker genes in the CD8+ effector T cells from different conditions. The dot size characterizes the proportion of CD8+ effector T cells of each condition (y axis) with expression levels (indicated by color intensity) of the selected genes (x axis). The dot color reflects the averaged expression level of each gene in of the CD8+ effector T cells of each condition. (D) Distribution of cytotoxicity scores of CD8+ effector T cells under each condition. Cytotoxic level of each cell is inferred by the averaged expression level of CD8+ T marker genes Prf1, Ifng, Tnf, Pdcd1, Sla2, and Cd8a. The y axis represents the cytotoxicity score. Combo versus anti–PD-1 (P = 1.121 × 10⁻⁶); combo versus ATT-l (P = 0.0024). Statistical analysis was conducted using unpaired 2-tailed t test. (E) Proportion of CD8+ effector T cells with significant cytotoxicity genes expressed. The y axis represents the proportion of CD8+ effector T cells with (dark blue) and without (red) significant cytotoxicity genes expressed. Combo versus anti–PD-1 (P = 1.006 × 10⁻⁹), combo versus ATT-l (P = 3.816 × 10⁻⁵), combo versus control (P = 1.557 × 10⁻⁸). Statistical analysis was conducted using Fisher’s exact test.
Figure 9
Figure 9. ATT-I enhances the autologous T cell responses in CRC patient–derived tumor organoids.
(A) Schematic representation of patient-derived organoids (PDOs) cocultured with autologous CD8+ T cells in the presence or absence of ATT-I. (B) Quantification of the organoid size presented as mean ± SD from 8 different patients (PDO1–PDO8). The size of organoids was measured as project area (μm2) using Image J software. Statistical analysis was conducted using 1-way ANOVA. (C) Microscopic images of PDOs cocultured with autologous CD8+ T cells in the presence or absence of ATT-I (30 μM) from patient 1 (PDO1) and patient 2 (PDO2). Scale bar: 100 μm. *P < 0.05; **P < 0.01; ***P < 0.001; ****P < 0.0001.

References

    1. Wallich R, et al. Abrogation of metastatic properties of tumour cells by de novo expression of H-2K antigens following H-2 gene transfection. Nature. 1985;315(6017):301–305. doi: 10.1038/315301a0. - DOI - PubMed
    1. Sade-Feldman M, et al. Resistance to checkpoint blockade therapy through inactivation of antigen presentation. Nat Commun. 2017;8(1):1136. doi: 10.1038/s41467-017-01062-w. - DOI - PMC - PubMed
    1. Hulpke S, Tampe R. The MHC I loading complex: a multitasking machinery in adaptive immunity. Trends Biochem Sci. 2013;38(8):412–420. doi: 10.1016/j.tibs.2013.06.003. - DOI - PubMed
    1. Spranger S, Gajewski TF. Impact of oncogenic pathways on evasion of antitumour immune responses. Nat Rev Cancer. 2018;18(3):139–147. doi: 10.1038/nrc.2017.117. - DOI - PMC - PubMed
    1. Beatty GL, Gladney WL. Immune escape mechanisms as a guide for cancer immunotherapy. Clin Cancer Res. 2015;21(4):687–692. doi: 10.1158/1078-0432.CCR-14-1860. - DOI - PMC - PubMed

Publication types

MeSH terms