. 2021 Apr 8;17(4):e1008973.
doi: 10.1371/journal.pgen.1008973. eCollection 2021 Apr.

Leveraging expression from multiple tissues using sparse canonical correlation analysis and aggregate tests improves the power of transcriptome-wide association studies

Affiliations

Leveraging expression from multiple tissues using sparse canonical correlation analysis and aggregate tests improves the power of transcriptome-wide association studies

Helian Feng et al. PLoS Genet. .

Abstract

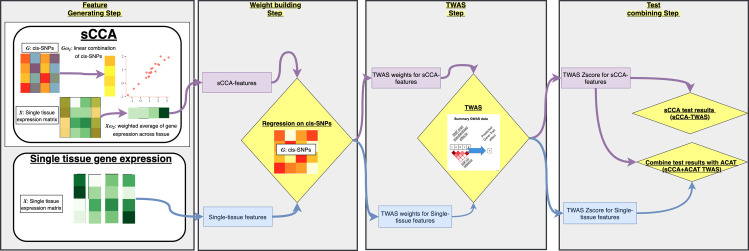
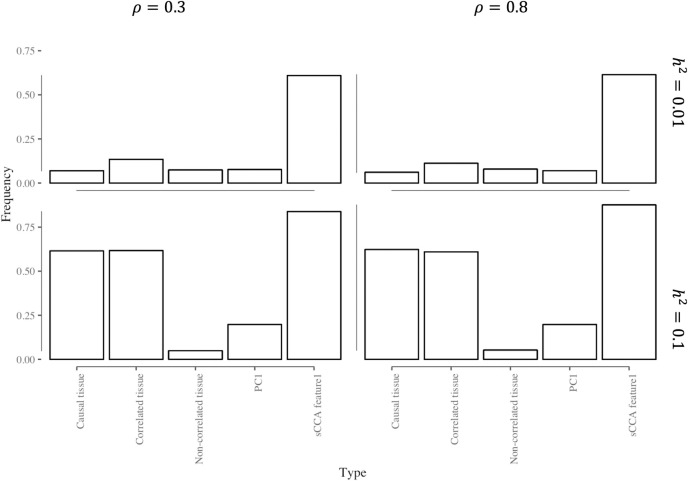
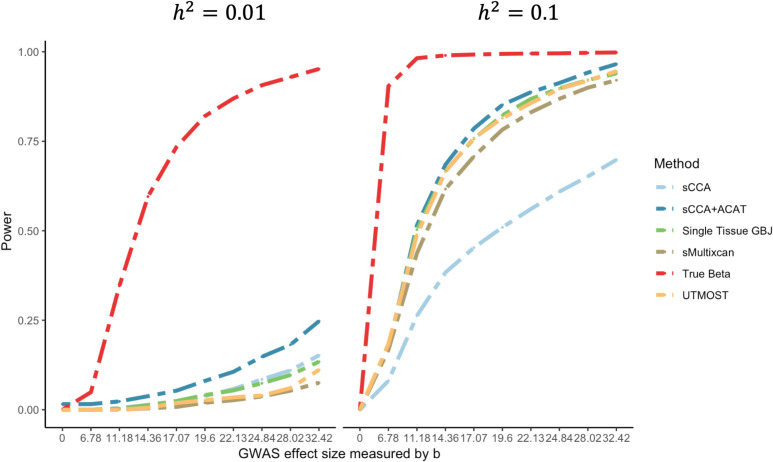
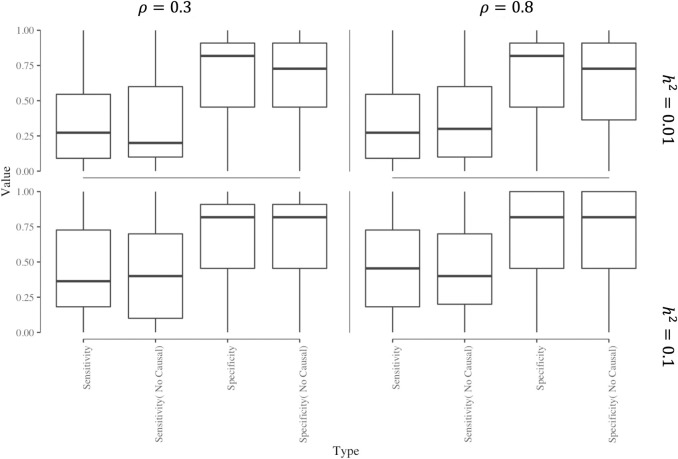
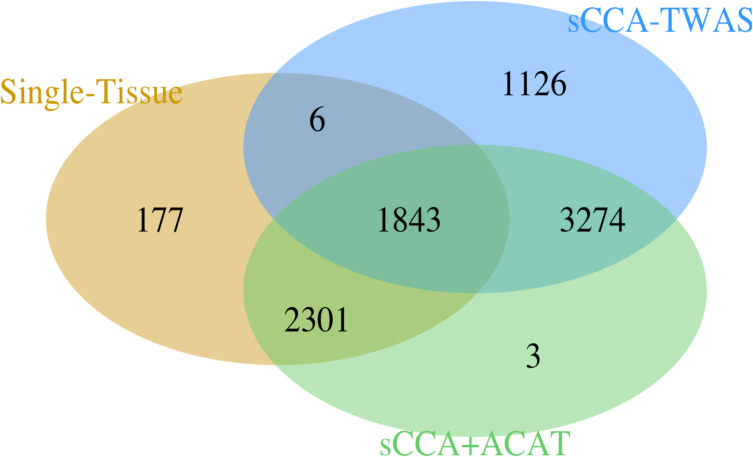
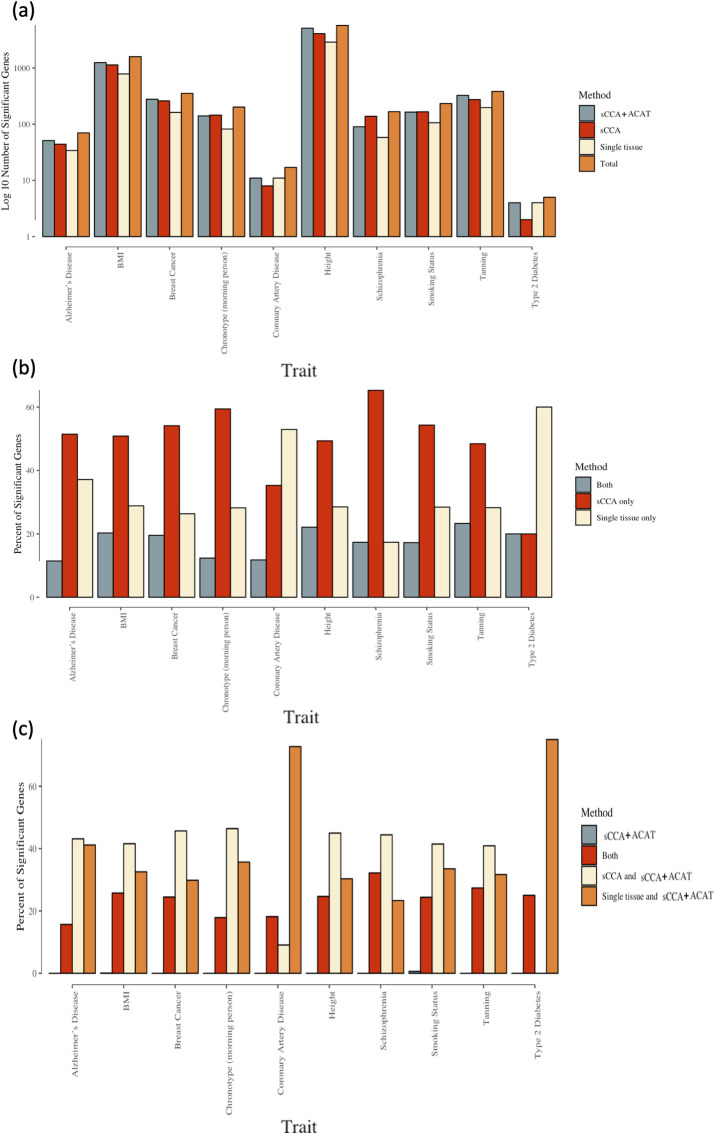
Transcriptome-wide association studies (TWAS) test the association between traits and genetically predicted gene expression levels. The power of a TWAS depends in part on the strength of the correlation between a genetic predictor of gene expression and the causally relevant gene expression values. Consequently, TWAS power can be low when expression quantitative trait locus (eQTL) data used to train the genetic predictors have small sample sizes, or when data from causally relevant tissues are not available. Here, we propose to address these issues by integrating multiple tissues in the TWAS using sparse canonical correlation analysis (sCCA). We show that sCCA-TWAS combined with single-tissue TWAS using an aggregate Cauchy association test (ACAT) outperforms traditional single-tissue TWAS. In empirically motivated simulations, the sCCA+ACAT approach yielded the highest power to detect a gene associated with phenotype, even when expression in the causal tissue was not directly measured, while controlling the Type I error when there is no association between gene expression and phenotype. For example, when gene expression explains 2% of the variability in outcome, and the GWAS sample size is 20,000, the average power difference between the ACAT combined test of sCCA features and single-tissue, versus single-tissue combined with Generalized Berk-Jones (GBJ) method, single-tissue combined with S-MultiXcan, UTMOST, or summarizing cross-tissue expression patterns using Principal Component Analysis (PCA) approaches was 5%, 8%, 5% and 38%, respectively. The gain in power is likely due to sCCA cross-tissue features being more likely to be detectably heritable. When applied to publicly available summary statistics from 10 complex traits, the sCCA+ACAT test was able to increase the number of testable genes and identify on average an additional 400 additional gene-trait associations that single-trait TWAS missed. Our results suggest that aggregating eQTL data across multiple tissues using sCCA can improve the sensitivity of TWAS while controlling for the false positive rate.


Conflict of interest statement

The authors have declared that no competing interests exist.

Figures

Fig 1
Fig 1. Methods overview.
The single-tissue-based cross-tissue TWAS approach is shown in blue arrows, the PCA based cross-tissue TWAS approach is shown in red arrows, and the sCCA-TWAS approach is shown in purple arrows.
Fig 2
Fig 2. Proportion of significant (p<0.05) heritability tests for different expression features when cis genetic variation is associated with expression in some tissues.
Here ρ denotes the strength of the genetic correlation between expression in the causal tissue and another tissue in which the expression is also associated with cis-germline variation ("correlated tissues"). "Non-correlated tissues" are the tissues where local germline variation is not associated with the gene expression. Here expression in half of the tissues is genetically correlated with that in the causal tissue, and the causal tissue is not observed (performance in the causal tissue is included as a reference). PC1 is the first principal component of cross-tissue gene expression; sCCA-feature1 is the linear combination of tissue expression values from the first pair of sCCA canonical variables. h2 denotes the proportion of expression variance in the causal tissue explained by cis-genetic variation.
Fig 3
Fig 3. Power comparison for cross-tissue TWAS methods.
Power (at α = 2.5×10⁻⁵) as a function of GWAS effect size. For each tissue, we randomly sampled the z-scores from this multivariate normal and set b=Ngwas×r2 to 0.00, 6.78, 11.18, 14.36, 17.07, 19.60, 22.13, 24.84, 28.02, 32.42 to achieve theoretical power of 5%, 10%,…, 90% at alpha level of 0.05. That is, when r2 = 1% (when variation in gene expression in the target tissue explains 1% of the variability in the trait), the GWAS sample size Ngwas ranges from 4,602 to 105,074. h2 denotes the proportion of expression variance in the causal tissue explained by cis-genetic variation. sCCA+ACAT: combining 3 sCCA-features and 22 single-tissue tests with ACAT; sCCA: combining top 3 sCCA-features tests using a Bonferroni correction; Single Tissue_GBJ: combining 22 single-tissue TWAS statistics using the GBJ test; s-MultiXcan: combining 22 single tissue based test using s-MultiXcan); UTMOST: single tissue based approach with UTMOST; true weights: a TWAS test using the true (simulated) weights relating SNPs to expression in the causal tissue.
Fig 4
Fig 4. Sensitivity and Specificity of sCCA features.
The box plot of sensitivity and specificity of sCCA putting non-zero weights on the tissue where genotype regulates gene expression. We varied underlying gene expression heritability (h2) and correlation (ρ) with the causal tissue as: (a) h2 = 0.01, ρ = 0.3; (b) h2 = 0.01, ρ = 0.8; (c) h2 = 0.1, ρ = 0.3; (d) h2 = 0.1, ρ = 0.8.
Fig 5
Fig 5. Venn Diagram of the significant expression-phenotype associations.
The Venn Diagram of the significant expression-phenotype associations for single tissue test results, sCCA-TWAS test results and ACAT combined results (p<0.05 after accounting for testing multiple genes and multiple features). sCCA+ACAT: combining 3 sCCA-features and 22 single-tissue tests with ACAT; sCCA: combining top 3 sCCA-features tests using a Bonferroni correction; Single Tissue: combining 22 single-tissue TWAS statistics using Bonferroni.
Fig 6
Fig 6
(a) Number of significant genes identified by ACAT combined test, sCCA-TWAS, TWAS using single tissue GTEx data and the total number of significant genes identified by all three methods. Different phenotypes are arranged along the x-axis and the number of significant genes identified by ACAT combined test, sCCA+TWAS, TWAS using single-tissue GTEx data and the total number of significant genes identified by all three methods are shown in the y-axis on log 10 scale. The information about the phenotype are provided in Table 1. sCCA+ACAT: combining 3 sCCA-features and 22 single-tissue tests with ACAT; sCCA: combining top 3 sCCA-features tests using a Bonferroni correction; Single Tissue: combining 22 single-tissue TWAS statistics using Bonferroni. (b) Percentage of significant associations identified by both single tissue TWAS and sCCA TWAS, by only sCCA-TWAS, and by only identified by single tissue TWAS, among all associations identified with sCCA cross-tissue TWAS or single tissue TWAS. Different phenotypes are arranged along the x-axis and the percentage of significant identified by both single tissue TWAS and sCCA-TWAS, by only sCCA-TWAS, and by only identified by single tissue TWAS are shown in the y-axis. The information about the phenotype are provided in Table 1. (c) Percent of significant identified by only sCCA+ACAT, by sCCA+ACAT, sCCA-TWAS and single tissue TWAS, by both sCCA-TWAS and sCCA+ACAT, by both single tissue TWAS and sCCA+ACAT among all significant genes. Different phenotypes are arranged along the x-axis and the percentage of significant associations by only ACAT, by ACAT, sCCA-TWAS and single tissue TWAS, by both sCCA-TWAS and ACAT, by both single tissue TWAS and ACAT are shown in the y-axis. The information about the phenotype are provided in Table 1. sCCA+ACAT: combining 3 sCCA-features and 22 single-tissue tests with ACAT; sCCA: combining top 3 sCCA-features tests using a Bonferroni correction; Single Tissue: combining 22 single-tissue TWAS statistics using Bonferroni.

Similar articles

Cited by

References

    1. Visscher PM, Wray NR, Zhang Q, Sklar P, McCarthy MI, Brown MA, et al.. 10 Years of GWAS Discovery: Biology, Function, and Translation. American journal of human genetics. 2017;101(1):5–22. 10.1016/j.ajhg.2017.06.005 - DOI - PMC - PubMed
    1. Zhang Y, Qi G, Park JH, Chatterjee N. Estimation of complex effect-size distributions using summary-level statistics from genome-wide association studies across 32 complex traits. Nat Genet. 2018;50(9):1318–26. 10.1038/s41588-018-0193-x . - DOI - PubMed
    1. Gusev A, Arthur K, Huwenbo S, Gaurav B, Wonil C, Brenda WJHP, et al.. Integrative approaches for large-scale transcriptome-wide association studies. Nature Genetics. 2016;48(3). 10.1038/ng.3506 - DOI - PMC - PubMed
    1. Gamazon ER, Wheeler HE, Shah KP, Mozaffari SV, Aquino-Michaels K, Carroll RJ, et al.. A gene-based association method for mapping traits using reference transcriptome data. Nat Genet. 2015;47(9):1091–8. Epub 2015/08/11. 10.1038/ng.3367 - DOI - PMC - PubMed
    1. Mancuso N, Kichaev G, Shi H, Freund M, Gusev A, Pasaniuc B. Probabilistic fine-mapping of transcriptome-wide association studies. bioRxiv. 2018. - PMC - PubMed

Publication types

MeSH terms