. 2021 Apr 8;16(4):e0249732.
doi: 10.1371/journal.pone.0249732. eCollection 2021.

The lockdown effect: A counterfactual for Sweden

Affiliations

The lockdown effect: A counterfactual for Sweden

Benjamin Born et al. PLoS One. .

Abstract

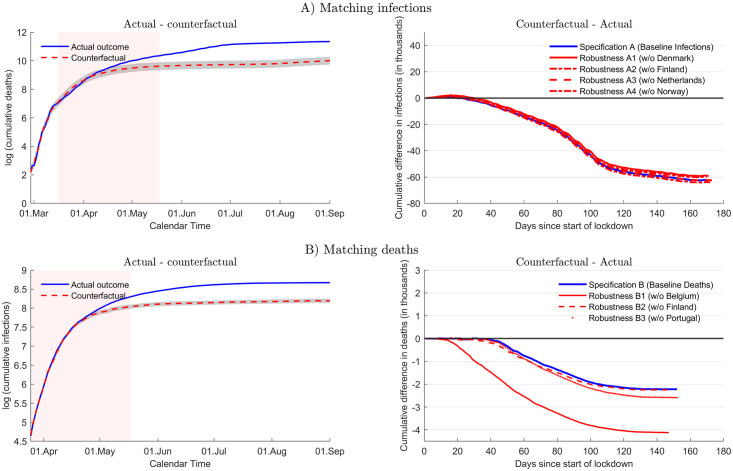
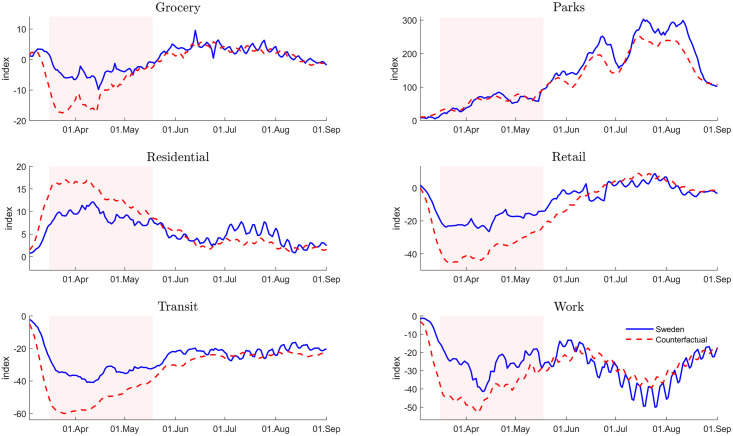
While most countries imposed a lockdown in response to the first wave of COVID-19 infections, Sweden did not. To quantify the lockdown effect, we approximate a counterfactual lockdown scenario for Sweden through the outcome in a synthetic control unit. We find, first, that a 9-week lockdown in the first half of 2020 would have reduced infections and deaths by about 75% and 38%, respectively. Second, the lockdown effect starts to materialize with a delay of 3-4 weeks only. Third, the actual adjustment of mobility patterns in Sweden suggests there has been substantial voluntary social restraint, although the adjustment was less strong than under the lockdown scenario. Lastly, we find that a lockdown would not have caused much additional output loss.


Conflict of interest statement

The authors have declared that no competing interests exist.

Figures

Fig 1
Fig 1. COVID-19 infections in Sweden.
Top-left panel compares actual infections (blue solid line) and control unit/counterfactual (red dashed line) in logs for baseline Specification A. Top-right panel shows difference of infections between counterfactual and actual outcome in thousands. Table 1 reports country weights for control unit counterfactual (Specification A (baseline)). Gray shaded area shows two standard deviations of difference between infections in Sweden and control unit during the first 13 days (matching period). Pink shaded area: lockdown period (March 15–May 17). Specifications (A1–A4): alternative control units based on restricted donor pools. Bottom panels organized in the same way, but for Specification B.
Fig 2
Fig 2. Mobility adjustment in Sweden.
Actual outcome (blue solid line) vs control unit/counterfactual (red dashed line). Vertical axis measures percentage change relative to median in early 2020. Horizontal axis measures 11-day symmetric moving average. Pink shaded area indicates lockdown period. Construction of counterfactual: see Fig 1 (Specification A, Baseline). Data source: Google mobility reports [20].

References

    1. Bonaccorsi G, Pierri F, Cinelli M, Flori A, Galeazzi A, Porcelli F, et al.. Economic and social consequences of human mobility restrictions under COVID-19. Proceedings of the National Academy of Sciences. 2020;117(27):15530–15535. 10.1073/pnas.2007658117 - DOI - PMC - PubMed
    1. Frey BS, Osterloh M. Was sagt die Glücksforschung zu Corona?; 2020. Die Volkswirtschaft 6/2020.
    1. Kermack WO, McKendrick AG. A contribution to the mathematical theory of epidemics. Procceedings of the Royal Society. 1927;115(772):700–721.
    1. Zhanga R, Li Y, Zhangc AL, Wang Y, Molina MJ. Identifying airborne transmission as the dominant route for the spread of COVID-19. PNAS. 2020;26(117):14857–14863. 10.1073/pnas.2009637117 - DOI - PMC - PubMed
    1. Flaxman S, Mishra S, Gandy A, Unwin HJT, Mellan TA, Coupland H, et al.. Estimating the effects of non-pharmaceutical interventions on COVID-19 in Europe. Nature. 2020;. 10.1038/s41586-020-2405-7 - DOI - PubMed