. 2021 May 3;218(5):e20210236.
doi: 10.1084/jem.20210236.

Broad and potent neutralizing human antibodies to tick-borne flaviviruses protect mice from disease

Affiliations

Broad and potent neutralizing human antibodies to tick-borne flaviviruses protect mice from disease

Marianna Agudelo et al. J Exp Med. .

Abstract

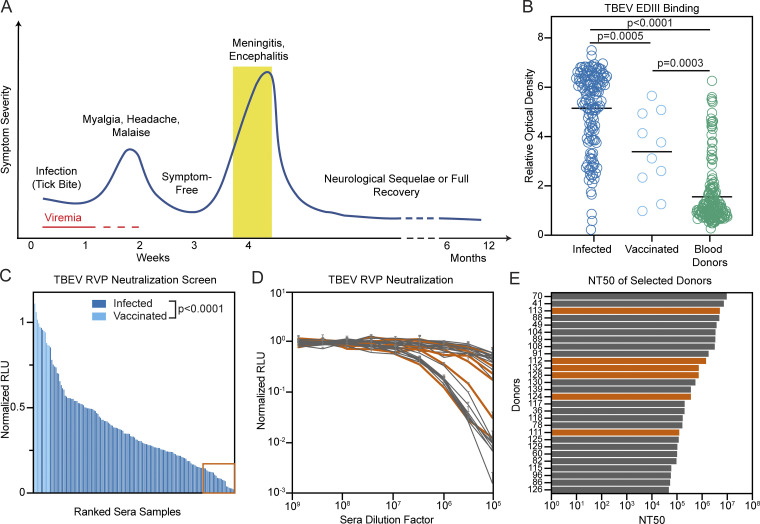
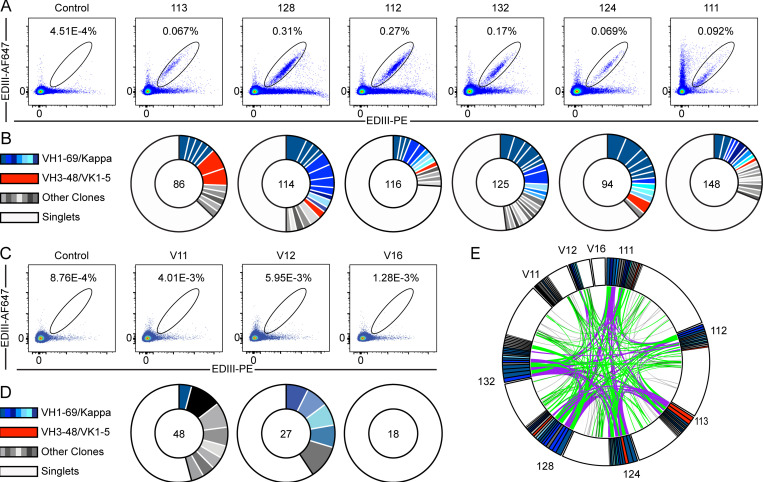
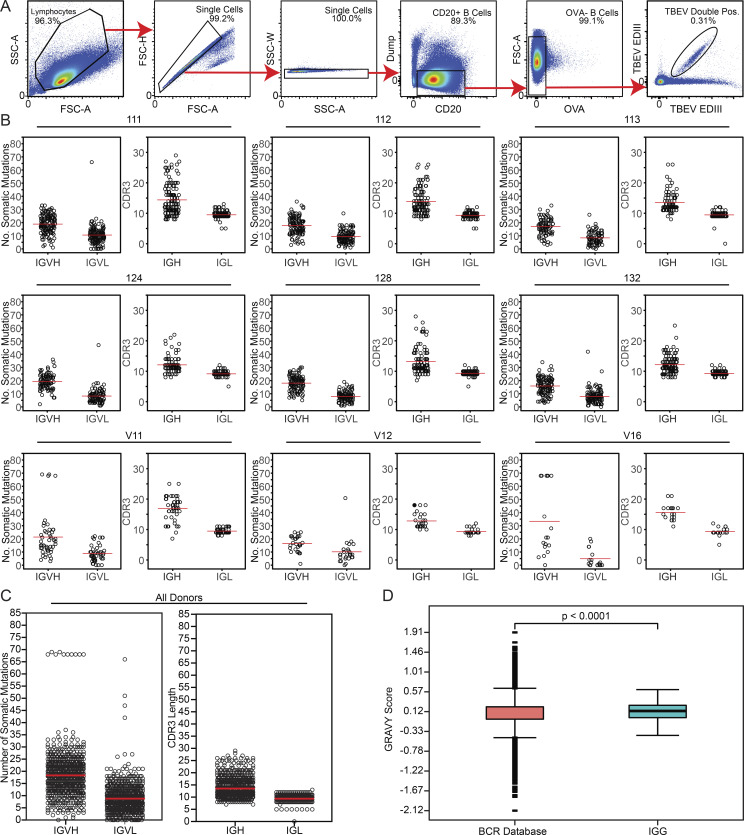
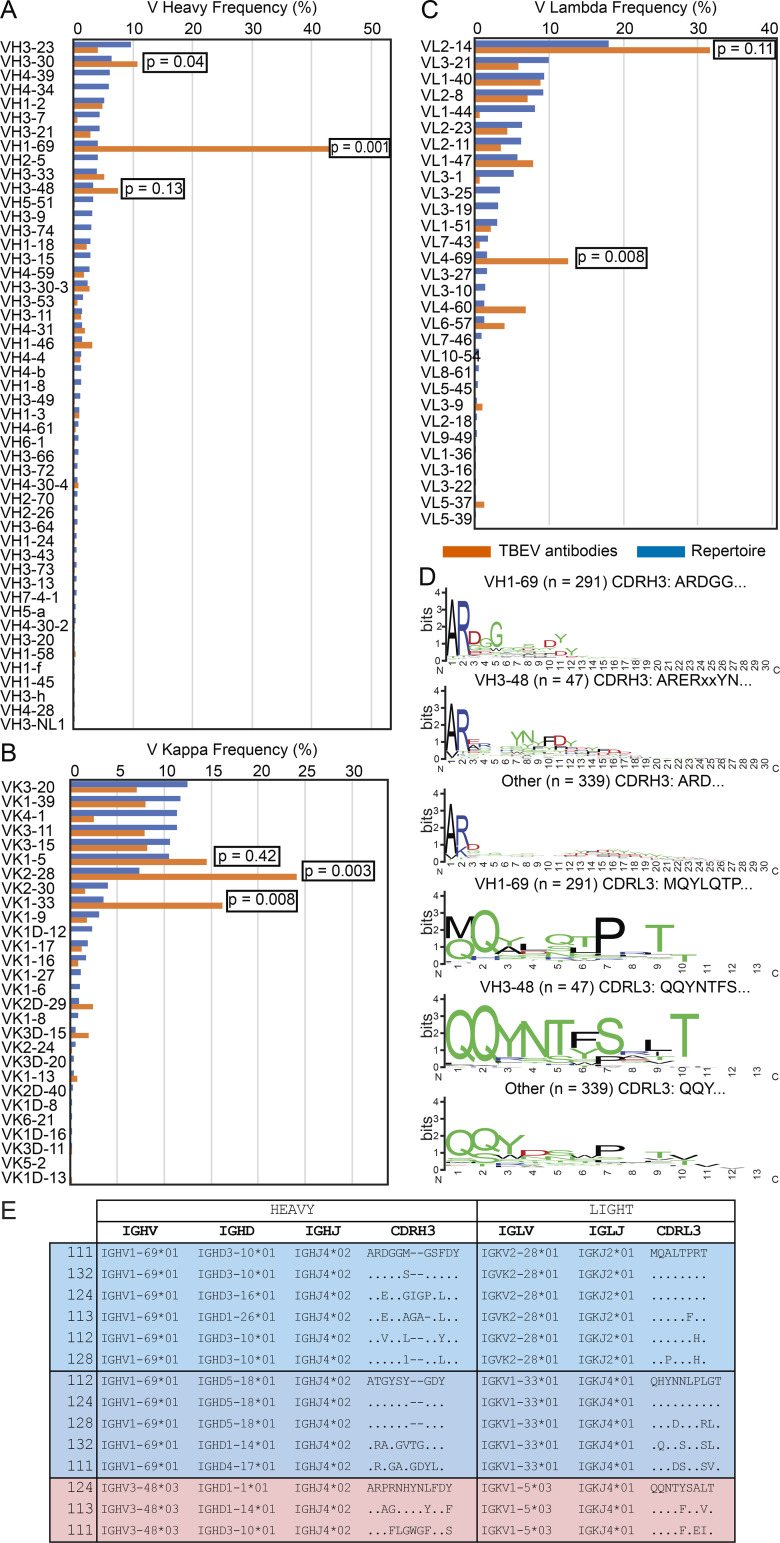
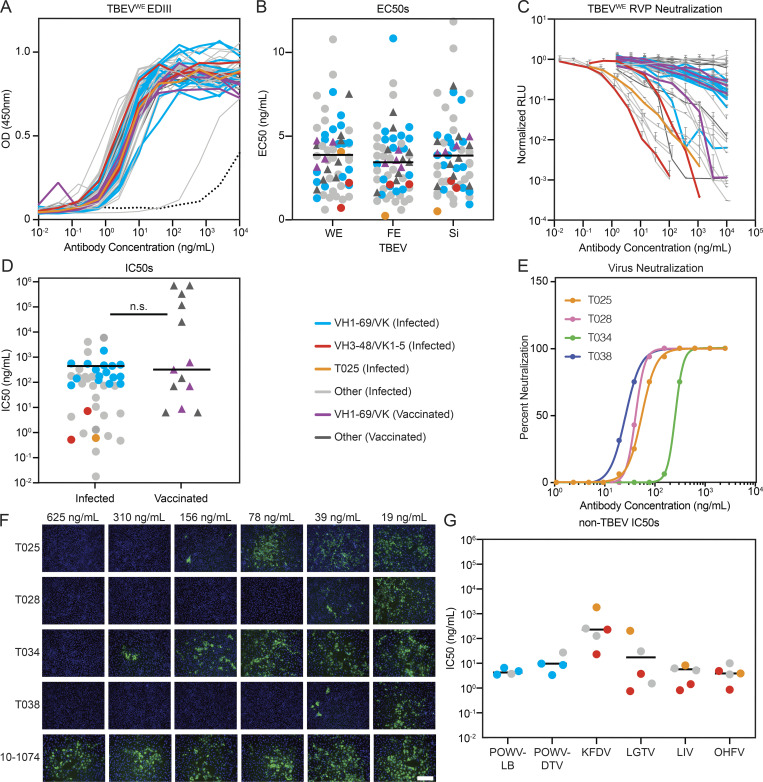
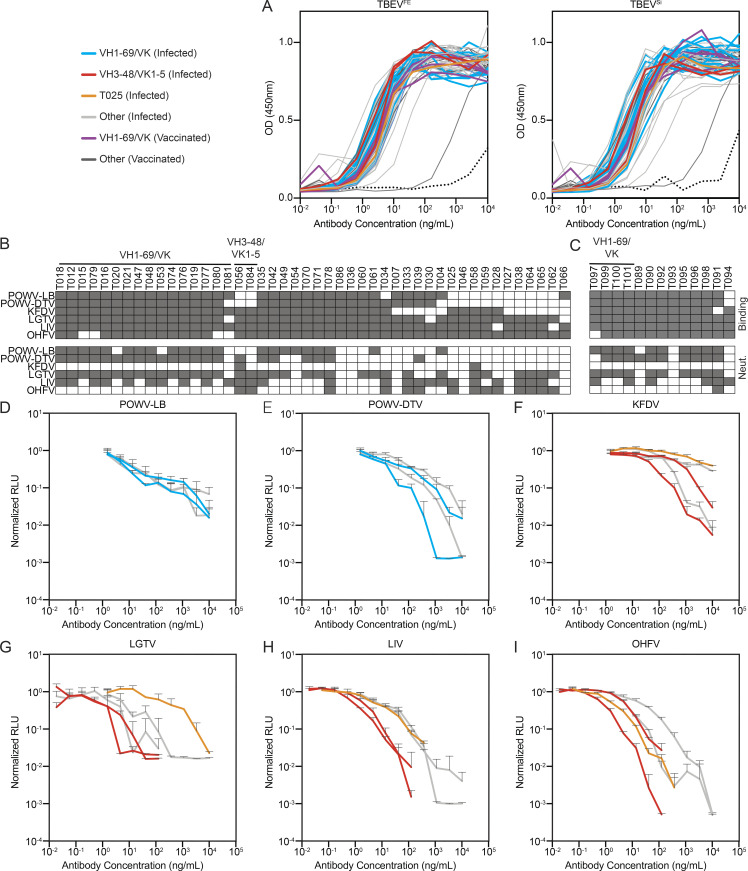
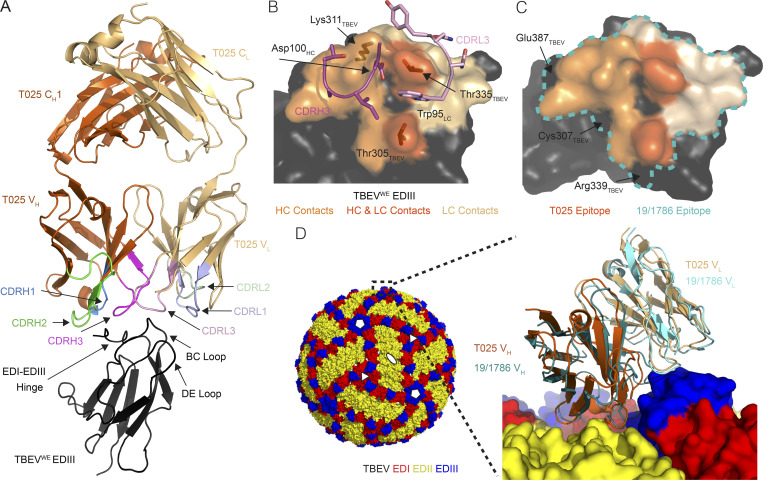
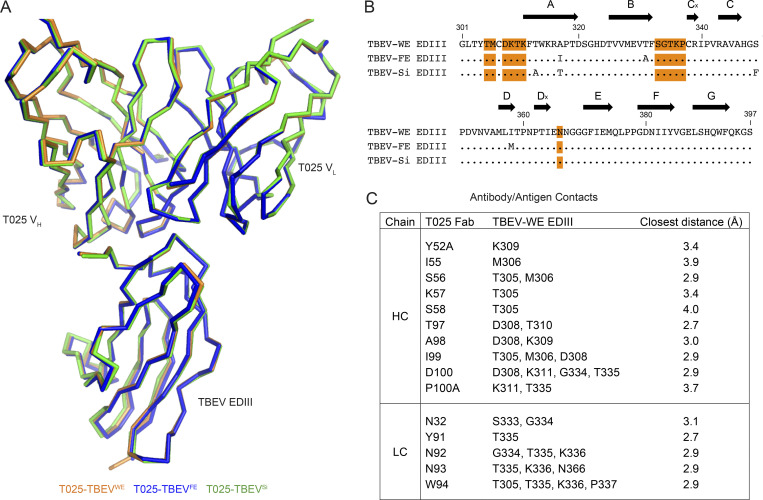
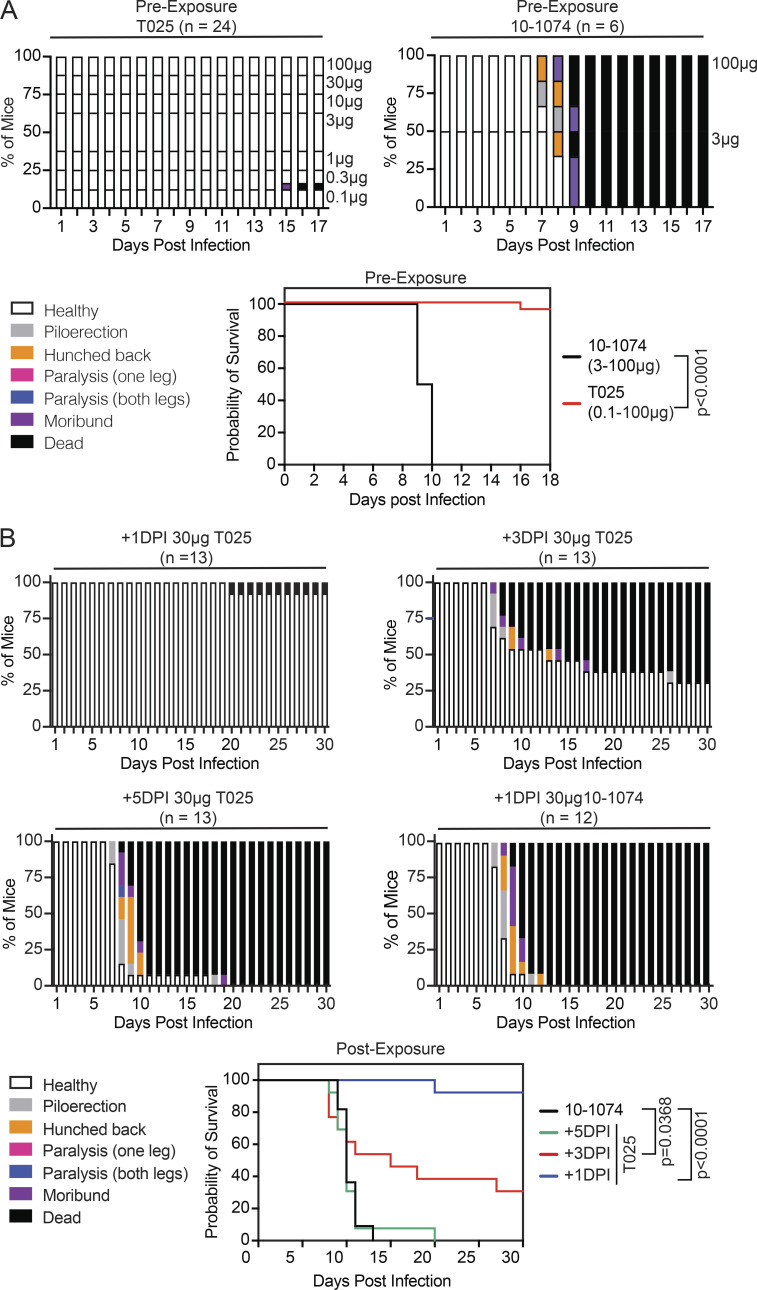
Tick-borne encephalitis virus (TBEV) is an emerging human pathogen that causes potentially fatal disease with no specific treatment. Mouse monoclonal antibodies are protective against TBEV, but little is known about the human antibody response to infection. Here, we report on the human neutralizing antibody response to TBEV in a cohort of infected and vaccinated individuals. Expanded clones of memory B cells expressed closely related anti-envelope domain III (EDIII) antibodies in both groups of volunteers. However, the most potent neutralizing antibodies, with IC50s below 1 ng/ml, were found only in individuals who recovered from natural infection. These antibodies also neutralized other tick-borne flaviviruses, including Langat, louping ill, Omsk hemorrhagic fever, Kyasanur forest disease, and Powassan viruses. Structural analysis revealed a conserved epitope near the lateral ridge of EDIII adjoining the EDI-EDIII hinge region. Prophylactic or early therapeutic antibody administration was effective at low doses in mice that were lethally infected with TBEV.


Conflict of interest statement

Disclosures: M. Agudelo, D.F. Robbiani, and M.C. Nussenzweig reported a patent to Broadly Neutralizing Antibodies to Tick-Borne Encephalitis and Related Viruses (US 63/118,461) pending. M.C. Nussenzweig reported personal fees from Celldex outside the submitted work. Additionally, M.C. Nussenzweig is a Frontier Bioscience SAB member. No other disclosures were reported.

Figures

Figure 1.
Figure 1.
Screening individuals for TBEV antibodies. (A) Diagrammatic representation of the clinical course of TBE. The approximate time of serum collection is shown in yellow. (B) TBEV EDIII IgG ELISA. Graph shows optical density measurement (y axis) relative to a negative control serum for samples from 141 TBEV-infected individuals, 10 TBEV vaccinees, and 168 random blood donors (1:500 dilution) measured in singlicate. P = 0.0005 for infected versus vaccinees; P < 0.0001 for infected versus blood donors; P = 0.0003 for vaccinees versus blood donors; calculated by one-way ANOVA followed by Tukey’s test. Horizontal lines indicate the mean. (C) TBEV RVP neutralization screening. Graph shows ranked serum neutralizing activity (1:600,000 dilution) against TBEV RVPs (average of duplicate wells) relative to no serum control. The orange box (bottom right) indicates the 28 best neutralizers of 141 TBEV-infected individuals and 10 TBEV vaccinees tested. P < 0.0001; calculated using two-tailed Mann–Whitney test. (D) TBEV RVP neutralization curves. Plot shows representative neutralization curves for each of the 28 most potent sera from C. Representative of two experiments, each performed in triplicate. Error bars indicate standard deviation. (E) Ranked NT50s for the top 28 individuals. Average of two independent experiments. In D and E, orange indicates the donors of PBMCs for antibody cloning. Related to Fig. S1 and Table S1. RLU, relative light units.
Figure S1.
Figure S1.
Clinical correlations and serum neutralization in vaccinees. (A–F) Serum TBEV EDIII ELISA data (IgG) from Fig. 1 B plotted against demographic and available clinical information. (G–L) Serum TBEV RVP neutralization data from Fig. 1 C plotted against demographic and available clinical information. A and G show age (no significance), B and H show length of hospitalization (no significance), C and I show severity of disease (no significant differences), D and J show IgM titers (IP) measured at the time of hospitalization (P = 0.0029 and P < 0.0001, respectively); E and K show IgG titers (Vienna units/ml) measured at the time of hospitalization (P < 0.0001 and no significance, respectively), and F and L show patient gender (no significant differences). Statistical significance was calculated for A, B, D, E, G, H, J, and K using two-tailed Spearman's tests; for L and F using Mann–Whitney tests; and for C and I using one-way ANOVA with Tukey’s test. (M) Correlation between serum TBEV EDIII ELISA (IgG) and RVP neutralization data. (N) TBEV RVP neutralization curves with sera from vaccinated PBMC donors. Representative of two experiments, each performed in triplicate. Data are presented as mean with standard deviation. (O) Summary of serum NT50s for all infected and vaccinated PBMC donors. Related to Fig. 1 and Table S1. RLU, relative light units.
Figure 2.
Figure 2.
Anti-TBEV antibodies from infected and vaccinated individuals. (A) Identification of TBEV-specific B cells from infected donors. Representative flow cytometry plots showing B cells binding to AF647- and PE-labeled TBEV EDIII in one control and six TBEV-infected donors. Numbers indicate percentage of double-positive B cells. The gating strategy is shown in Fig. S2 A. (B) Clonal analysis of antibody sequences. Pie charts show the distribution of antibody sequences from infected donors. The number in the center represents the total number of antibody sequences obtained. Colored or gray pie slices correspond to clonally related sequences, with the size of the slice proportional to the number of sequences. All blue slices are IGVH1–69, and all red slices are IGVH3–48/IGVK1–5. White slices correspond to antibody sequences that are not part of a clone (singlets). (C and D) Same as in A and B, but for one healthy control and three vaccinated donors. (E) Antibody sequence relatedness. Circos plot shows sequences from all donors, with color-coding as in B and D. Connecting lines indicate antibodies that share IGH and IGL V and J genes. Purple, green, and gray lines connect related clones to each other, clones to singlets, and singlets to singlets, respectively. Related to Figs. S2 and S3, Table S2, and Table S3.
Figure S2.
Figure S2.
Sorting strategy and antibody sequence analysis. (A) Sorting strategy. Forward and side scatter (FSC and SSC, respectively) were used to gate on single lymphocytes. Dump channel included CD3, CD8, CD14, CD16, and a viability dye. CD20+ B cells that failed to bind OVA (OVA) but did bind to the TBEV EDIII bait coupled with both PE and AF647 fluorophores were purified. (B) For each donor, the number of V gene somatic nucleotide mutations is shown on the left and the amino acid length of the CDR3 is shown on the right. (C) As in B, but for all donors combined. For B and C, horizontal red lines indicate the mean. (D) Distribution of hydrophobicity GRAVY scores at the IGH CDR3 of antibodies from all donors combined and compared with human repertoire (Briney et al., 2019). P < 0.0001 was determined using the Wilcoxon nonparametric test. Related to Fig. 2, Table S2, and Table S3.
Figure S3.
Figure S3.
Antibody V gene frequency and CDR3 sequences. (A) Bar graph showing the frequency of V heavy gene usage in TBEV antibodies from infected donors compared with human repertoire (Rubelt et al., 2012). (B and C) As in A, but for V kappa and V lambda genes. In A–C, orange indicates anti-TBEV antibodies isolated in this study, while blue indicates control repertoire; P values were calculated using a two-tailed t test with unequal variances. (D) Sequence logos for antibody CDR3s from infected donors generated by WebLogo. The height of the stack indicates the sequence conservation at a given position, while the height of letters within the stack indicates the relative frequency of each amino acid at that position. (E) Examples of highly similar antibody sequences found in multiple donors. Related to Fig. 2, Table S2, and Table S3.
Figure 3.
Figure 3.
Identification of potent and broadly cross-reactive monoclonal antibodies. (A) TBEVWE EDIII ELISA binding curves for 46 and 13 monoclonals from infected and vaccinated individuals, respectively. Data are representative of two experiments performed in singlicate. Dotted line is 10–1074 isotype control. (B) Dot plot summarizing average EC50 values for the antibodies in A to each of three TBEV subtype EDIIIs: TBEVWE, TBEVFE, and TBEVSi. Average of two experiments. The horizontal lines indicate the mean value. (C) RVP neutralization curves for the antibodies in A normalized to no antibody control. Data are representative of two experiments, each performed in triplicate. Error bars indicate standard deviation. (D) Dot plot summarizing the average IC50 for TBEVWE RVP neutralization by the antibodies as in C. Horizontal line indicates the mean IC50. No statistical difference was found by two-tailed Mann–Whitney test. (E and F) TBEV neutralization in vitro. In E, curves represent virus neutralization by serially diluted antibodies. Representative of two independent experiments performed in octuplicate. In F, representative immunofluorescence microscopy images of PS cells infected in the presence of the indicated antibodies are shown. Green is viral antigen, and blue is cell nuclei. Scale bar indicates 200 µm. (G) Cross-neutralization by anti-TBEV antibodies. Graph shows IC50s for selected antibodies against RVPs corresponding to POWV-LB, POWV-DTV, KFDV, LGTV, LIV, and OHFV. Average of two independent experiments performed in triplicate. Horizontal line indicates the mean IC50. In A–D and G, blue and red indicate infected donor-derived IGVH1–69/kappa and IGVH3-48/IGVK1–5 antibodies, while purple indicates IGHV1–69/kappa antibodies from vaccinated individuals. Antibody T025 is shown in orange. In B, D, and G, circles and triangles correspond to antibodies derived from infected or vaccinated donors, respectively. Related to Fig. S4, Table S4, and Table S5.
Figure S4.
Figure S4.
Antibody binding and neutralization. (A) ELISA binding curves to TBEVFE and TBEVSi EDIII for the 59 antibodies. Data are representative of two experiments. (B) Top panel shows screening for infected donor antibodies binding to a panel of tick-borne flavivirus EDIIIs, including POWV-LB, POWV-DTV, KFDV, LGTV, LIV, and OHFV. Antibodies were screened in duplicate at 1 µg/ml. Bottom panel shows screening for neutralization against RVPs corresponding to the same panel of tick-borne flaviviruses. Infected donor antibodies were screened in triplicate at 1 µg/ml. (C) Screening for vaccine antibodies binding and neutralization against a panel of tick-borne flavivirus EDIIIs and RVPs as in B. In B and C, gray indicates binding or neutralization over control. (D–I) Neutralization curves of selected antibodies against tick-borne flavivirus RVPs other than TBEV. Representative of two experiments in triplicate. Error bars indicate standard deviation. Related to Fig. 3, Table S4, and Table S5.
Figure 4.
Figure 4.
T025 antibody recognizes a lateral ridge epitope on TBEV EDIII that is exposed on the mature virus structure. (A) T025 recognition of the TBEVWE EDIII. T025 interacts with the N-terminal region (EDI–EDIII hinge, the BC loop, and the DE loop) on TBEVWE EDIII. (B) T025 epitope. TBEVWE EDIII residues with an atom within 4 Å of a residue in the T025 Fab are highlighted on a surface representation of the EDIII antigen. CDRH3 and CDRL3 are shown as ribbon backbone with stick side chains. (C) T025 recognizes a similar epitope as the anti-TBEV mouse antibody 19/1786. The T025 epitope is shown in shades of orange; the 19/1786 epitope is outlined in a blue dashed line. Residues within the 19/1786 epitope, but not in the T025 epitope, are labeled. Epitopes are defined as residues that contain an atom within 4 Å of an atom in a residue on the antibody. (D) Surface representation of the cryo-EM structure of TBEV (PDB accession no. 5O6A) shown with fivefold, threefold, and twofold icosahedral symmetry operators at select vertices (left) with inset comparing binding poses of T025 and 19/1786 antibodies (right). Inset: Close-up of the indicated portion (dotted box) of the cryo-EM structure of the viral surface interacting with the 19/1786 VHVL domains (PDB accession no. 5O6V) with the E domains labeled in red, yellow, and blue and the VHVL domains in teal and cyan. The T025-TBEVWE EDIII crystal structure was docked onto a virion EDIII adjacent to an icosahedral twofold symmetry axis after alignment of the EDIII domains (RMSD = 0.97 Å, 82 Ca atoms). The T025 VHVL binds EDIII with a similar pose as the 19/1786 VHVL. Related to Fig. S5 and Table S6.
Figure S5.
Figure S5.
T025 antibody recognizes three subtypes of TBEV EDIII. (A) Overlay of crystal structures of T025 Fab bound to EDIII from three subtypes of TBEV. Structures were aligned on all Cα atoms in the Fab–EDIII complex and shown as orange (T025-TBEVWE EDIII), blue (T025-TBEVFE EDIII), or green (T025-TBEVSi EDIII) ribbons. RMSDs for Fab-EDIII alignments are 0.54 Å (T025-TBEVWE EDIII and T025-TBEVFE EDIII; 518 Cα atoms) and 0.26 Å (T025-TBEVWE EDIII and T025-TBEVSi EDIII; 525 Cα atoms). The CHCL domains of the Fabs were omitted for clarity. (B) Sequence alignment of EDIIIs from three strains of TBEV. Residues that contain an EDIII atom within 4 Å of an atom within a residue in T025 in each crystal structure are highlighted in orange. β-Strands are shown as arrows and defined according to Rey et al. (1995). (C) Contact residues between T025 Fab and TBEVWE EDIII. Contacts were identified using AntibodyDatabase (West et al., 2013) and defined as residues in which any atom is within 4 Å of an atom from a residue on the interacting partner. Related to Fig. 4.
Figure 5.
Figure 5.
Prevention and therapy with T025. (A) T025 is efficacious in preexposure prophylaxis. Mice were treated with T025 or 10–1074 (isotype control) 24 h before infection with a lethal dose of TBEV-Hypr. Top: Histogram shows disease score over time. Antibody dose is indicated on the right. Two independent experiments were combined, with three mice per group. Bottom: Kaplan–Meier survival curve. The P value was calculated with the Mantel–Cox test (P < 0.0001). (B) T025 protects mice when administered after infection. Mice were treated with 30 µg T025 or control 10–1074 at 1, 3, or 5 d post infection (DPI). Three experiments were combined, with six or seven mice per group; P < 0.0001 for +1 DPI, P = 0.0368 for +3 DPI, and no significant difference for +5 DPI by Mantel–Cox test.

References

    1. Adams, P.D., Afonine P.V., Bunkóczi G., Chen V.B., Davis I.W., Echols N., Headd J.J., Hung L.W., Kapral G.J., Grosse-Kunstleve R.W., et al. 2010. PHENIX: a comprehensive Python-based system for macromolecular structure solution. Acta Crystallogr. D Biol. Crystallogr. 66:213–221. 10.1107/S0907444909052925 - DOI - PMC - PubMed
    1. Albinsson, B., Vene S., Rombo L., Blomberg J., Lundkvist Å., and Rönnberg B.. 2018. Distinction between serological responses following tick-borne encephalitis virus (TBEV) infection vs vaccination, Sweden 2017. Euro Surveill. 23:17–00838. 10.2807/1560-7917.ES.2018.23.3.17-00838 - DOI - PMC - PubMed
    1. Arras, C., Fescharek R., and Gregersen J.P.. 1996. Do specific hyperimmunoglobulins aggravate clinical course of tick-borne encephalitis? Lancet. 347:1331. 10.1016/S0140-6736(96)90977-0 - DOI - PubMed
    1. Battye, T.G., Kontogiannis L., Johnson O., Powell H.R., and Leslie A.G.. 2011. iMOSFLM: a new graphical interface for diffraction-image processing with MOSFLM. Acta Crystallogr. D Biol. Crystallogr. 67:271–281. 10.1107/S0907444910048675 - DOI - PMC - PubMed
    1. Baykov, I.K., Matveev A.L., Stronin O.V., Ryzhikov A.B., Matveev L.E., Kasakin M.F., Richter V.A., and Tikunova N.V.. 2014. A protective chimeric antibody to tick-borne encephalitis virus. Vaccine. 32:3589–3594. 10.1016/j.vaccine.2014.05.012 - DOI - PubMed

Publication types

MeSH terms