. 2021 Jul 15;138(2):160-177.
doi: 10.1182/blood.2020009244.

Allele-specific expression of GATA2 due to epigenetic dysregulation in CEBPA double-mutant AML

Affiliations

Allele-specific expression of GATA2 due to epigenetic dysregulation in CEBPA double-mutant AML

Roger Mulet-Lazaro et al. Blood. .

Erratum in

Abstract

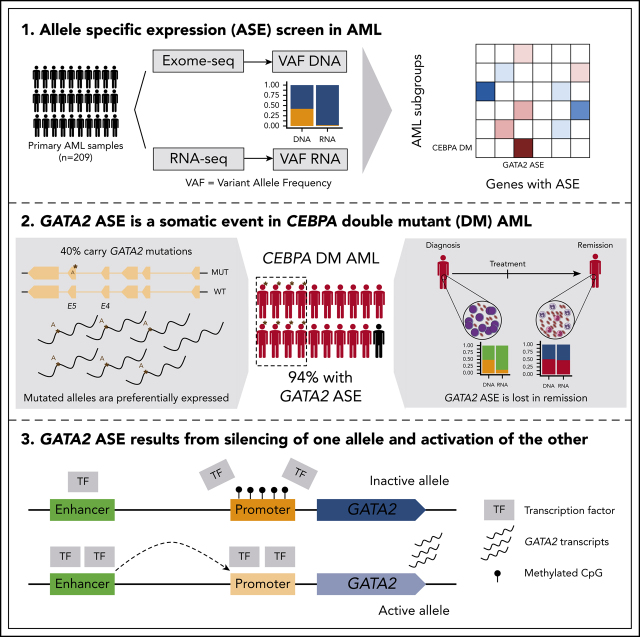
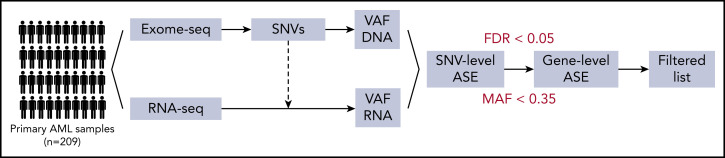
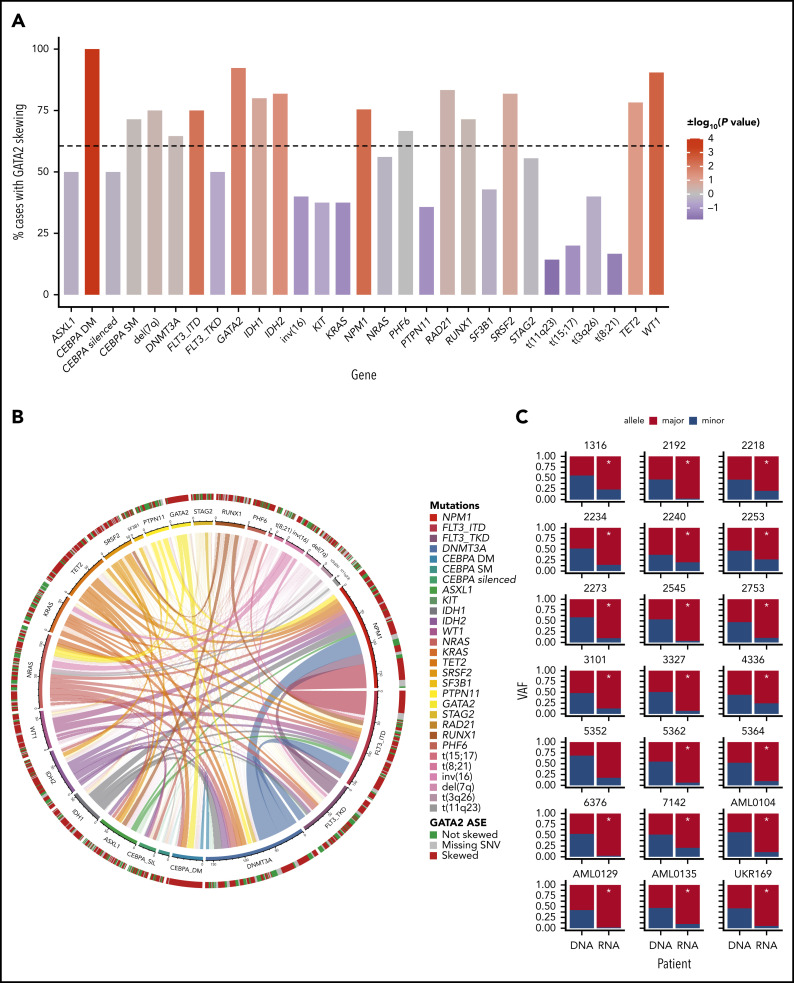
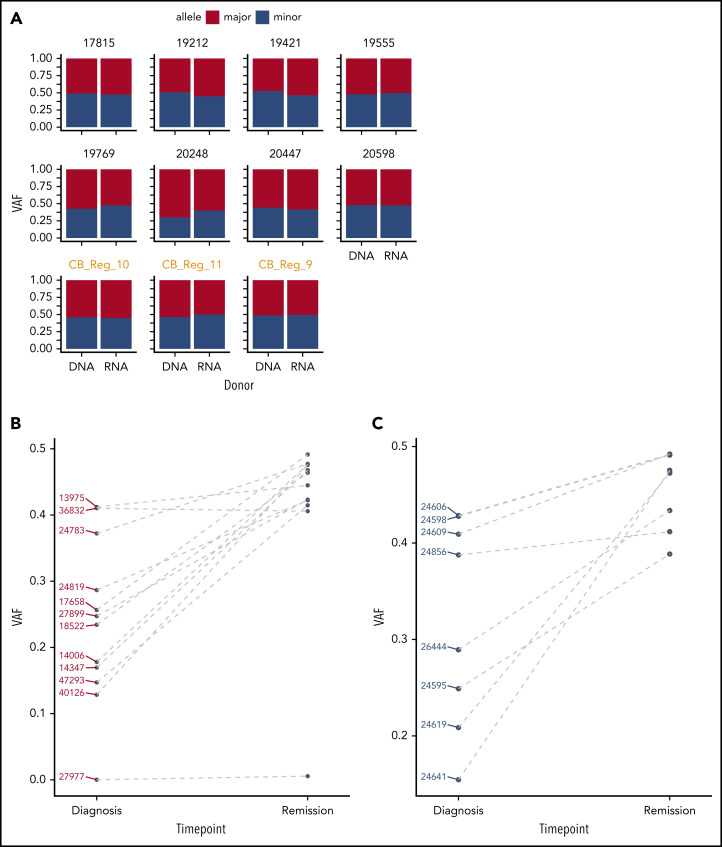
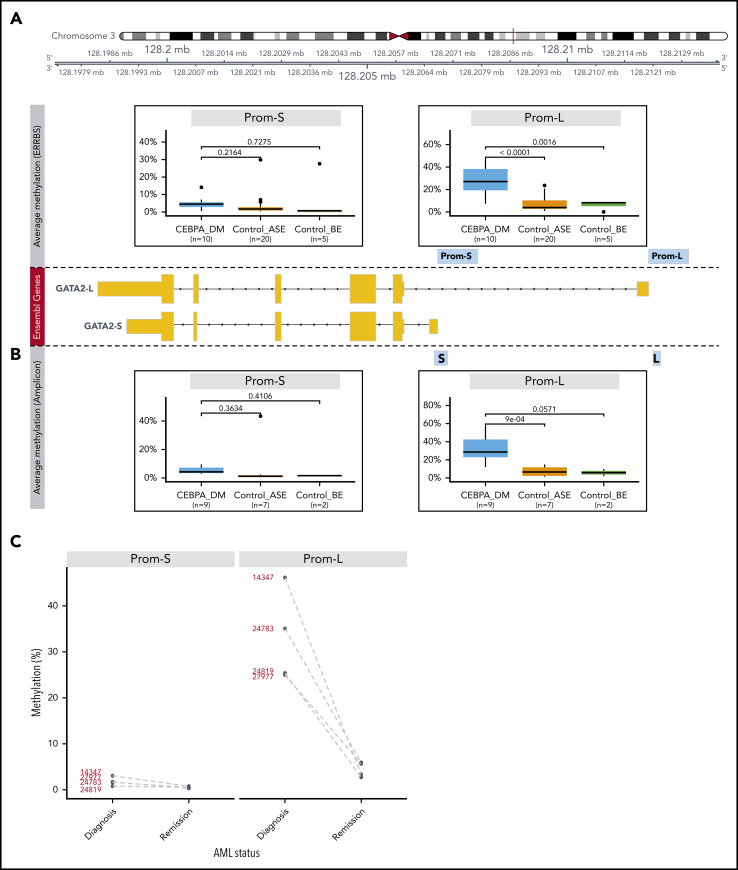
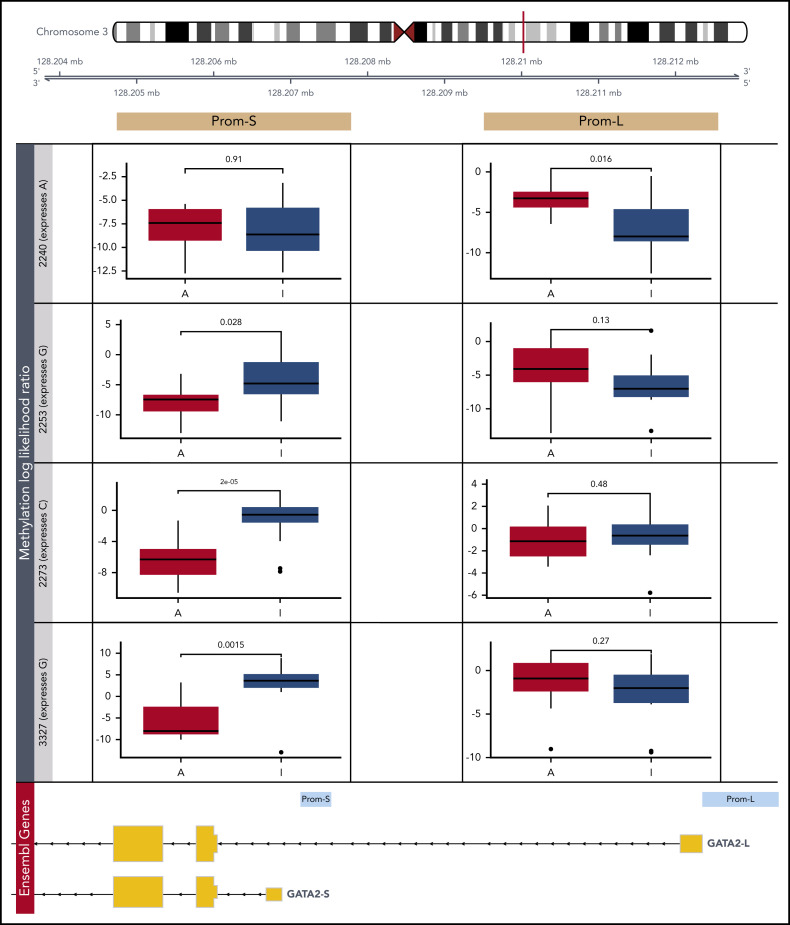
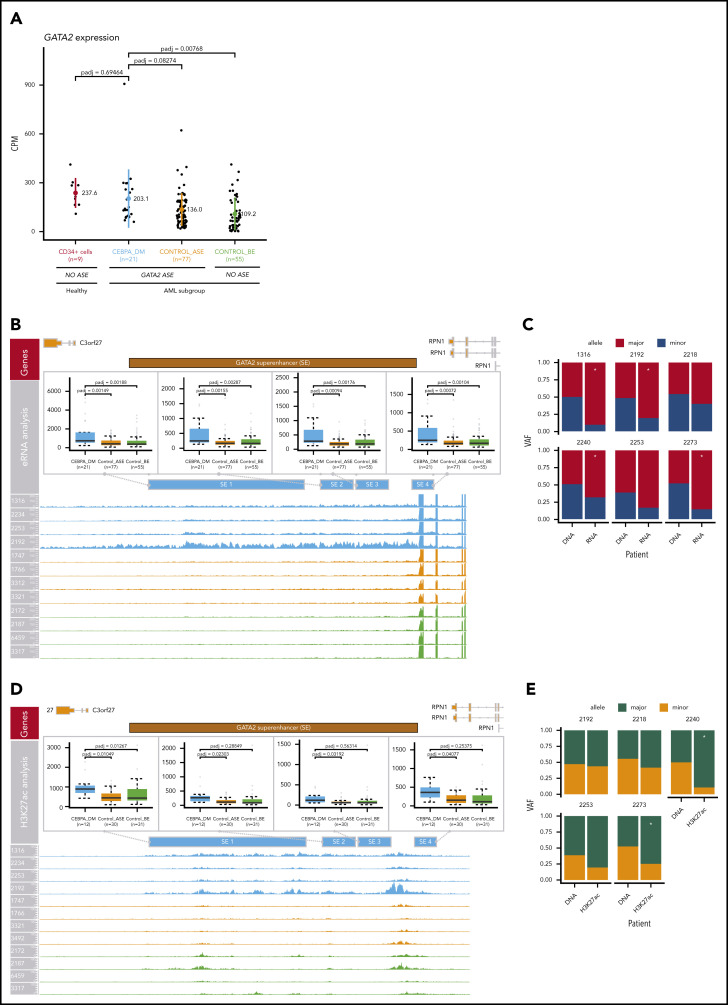
Transcriptional deregulation is a central event in the development of acute myeloid leukemia (AML). To identify potential disturbances in gene regulation, we conducted an unbiased screen of allele-specific expression (ASE) in 209 AML cases. The gene encoding GATA binding protein 2 (GATA2) displayed ASE more often than any other myeloid- or cancer-related gene. GATA2 ASE was strongly associated with CEBPA double mutations (DMs), with 95% of cases presenting GATA2 ASE. In CEBPA DM AML with GATA2 mutations, the mutated allele was preferentially expressed. We found that GATA2 ASE was a somatic event lost in complete remission, supporting the notion that it plays a role in CEBPA DM AML. Acquisition of GATA2 ASE involved silencing of 1 allele via promoter methylation and concurrent overactivation of the other allele, thereby preserving expression levels. Notably, promoter methylation was also lost in remission along with GATA2 ASE. In summary, we propose that GATA2 ASE is acquired by epigenetic mechanisms and is a prerequisite for the development of AML with CEBPA DMs. This finding constitutes a novel example of an epigenetic hit cooperating with a genetic hit in the pathogenesis of AML.


Figures

None
Graphical abstract
Figure 1.
Figure 1.
Schematic representation of the automated pipeline for ASE detection. Raw reads were aligned by STAR (RNA-seq) or bwa (exome sequencing [exome-seq]). SNVs were called with an ensemble of programs and annotated based on function, population frequency, and NGS statistics. This allowed the subsequent filtering of variants that were both real and informative. For every SNV, the variant allele frequency (VAF) at the DNA and RNA levels was computed, and SNV information was aggregated at the gene level. Finally, ASE was determined based on frequency of the minor allele (MAF) <0.35 and false discovery rate (FDR) <0.05 in a χ2 test.
Figure 2.
Figure 2.
Association between genes with ASE and gene mutations or cytogenetic aberrations. Statistical association was computed with a 2-sided Fisher’s exact test and represented as −log10 (P value) for odds ratios >1 or log10 (P value) for odds ratios <1. Positive values, indicating positive association, are depicted in red, and negative values are depicted in blue. For clearer visualization, the limits of the scale were set at −4 and +4. Associations that achieved significance are highlighted with an empty (P < .05) or full (P < .01) circle.
Figure 3.
Figure 3.
Occurrence of GATA2 ASE in AML subgroups. (A) Bar plot indicating the percentage of cases with GATA2 ASE in each mutational subgroup. The color of the bars indicates the strength of the association as log10 (P value), with a sign determined by the nature of the association. The scale ranges from blue for negative associations to red for positive associations. The dotted horizontal line indicates the percentage of cases with GATA2 ASE in the whole AML cohort. (B) Circos plot indicating the cooccurrence of mutations in AML and GATA2 ASE. (C) Bar plots for each patient with CEBPA DM showing GATA2 ASE, observed by the discrepancy between VAF at the DNA level and VAF at the RNA level. *Indicates significance at a false discovery rate <0.05 in a χ2 test.
Figure 4.
Figure 4.
GATA2 ASE is only present in leukemia cells. (A) Bar plot showing the absence of GATA2 ASE in CD34+ cells, of which 8 were derived from bone marrow and 3 from cord blood (in orange). The average VAF along the GATA2 gene at the DNA and RNA levels was identical in all samples. (B) Comparison of VAF measured in RNA at diagnosis or remission in CEBPA DM samples. (C) Comparison of VAF measured in RNA at diagnosis or remission in NPM1-mutated samples.
Figure 5.
Figure 5.
Methylation analysis of GATA2 promoters. (A) Differential methylation analysis of putative promoters of the 2 expressed GATA2 isoforms using ERRBS (Prom-S and Prom-L). The following groups were compared: CEBPA_DM (n = 10), Control_ASE (n = 20), and Control_BE (n = 5). The y-axis indicates the percentage of methylation, averaged for all the CpG positions in each promoter region. (B) Differential methylation analysis of the promoters of the 2 expressed GATA2 isoforms using bisulfite treatment followed by amplicon sequencing. Note that the amplified regions (denoted as S and L) are selections of the sequences examined in the ERRBS data. Groups were defined as described: CEBPA_DM (n = 9), Control_ASE (n = 7), and Control_BE (n = 2). (C) Methylation changes in GATA2 promoters of paired diagnosis-remission samples from patients with CEBPA DM AML.
Figure 6.
Figure 6.
Detection of allele-specific methylation in GATA2 promoters. Differential methylation analysis of putative promoters of the 2 expressed GATA2 isoforms by Nanopore sequencing (Prom-S and Prom-L). In 4 patients with CEBPA DM, the more abundant allele (A) was compared with the less transcriptionally active allele (I) based on a heterozygous single-nucleotide polymorphism: rs72983369 for 2240 and rs1573858 for 2253, 2273, and 3327. Methylation likelihood ratios computed by Nanopolish were averaged across all reads mapping to each allele.
Figure 7.
Figure 7.
Compensation of GATA2 levels by superenhancer activation. (A) Comparison of GATA2 expression levels in AML groups and CD34+ normal control cells (n = 9). The following AML groups were compared: CEBPA_DM (n = 21), Control_ASE (n = 77), and Control_BE (n = 55). No loss of GATA2 expression was observed in CEBPA DMs. (B) Analysis of enhancer RNA (eRNA) expression in the GATA2 −110-kb superenhancer. (C) ASE of eRNA in the GATA2 superenhancer, comparing CEBPA_DM (n = 21), Control_ASE (n = 77), and Control_BE (n = 55). The VAF of the DNA and the eRNA are shown. (D) Analysis of H3K27ac binding levels in the GATA2 −110-kb superenhancer, comparing CEBPA_DM (n = 12), Control_ASE (n = 30), and Control_BE (n = 31). (E) Allele specific binding of H3K27ac in the GATA2 super-enhancer. The VAF of the DNA and the H3K27ac reads are shown. *Indicates significance at a false discovery rate <0.05 in a χ2 test.

References

    1. Bradner JE, Hnisz D, Young RA. Transcriptional addiction in cancer. Cell. 2017;168(4):629-643. - PMC - PubMed
    1. Papaemmanuil E, Gerstung M, Bullinger L, et al. . Genomic classification and prognosis in acute myeloid leukemia. N Engl J Med. 2016;374(23):2209-2221. - PMC - PubMed
    1. Bhagwat AS, Lu B, Vakoc CR. Enhancer dysfunction in leukemia. Blood. 2018;131(16):1795-1804. - PMC - PubMed
    1. Gröschel S, Sanders MA, Hoogenboezem R, et al. . A single oncogenic enhancer rearrangement causes concomitant EVI1 and GATA2 deregulation in leukemia. Cell. 2014;157(2):369-381. - PubMed
    1. Shi J, Whyte WA, Zepeda-Mendoza CJ, et al. . Role of SWI/SNF in acute leukemia maintenance and enhancer-mediated Myc regulation. Genes Dev. 2013;27(24):2648-2662. - PMC - PubMed

Publication types

MeSH terms

Substances